Early in the COVID-19 pandemic, it was not clear how healthcare utilization and spending would change. Although one might expect health costs to increase during a pandemic, there were other factors driving spending and utilization down.
In spring of 2020, healthcare use and spending dropped precipitously due to cancellations of elective care to increase hospital capacity and social distancing measures to mitigate community spread of the coronavirus. Although telemedicine use increased sharply, it was not enough to compensate for the drop in in-person care. As the year progressed, healthcare use and spending began to rebound as in-person care resumed for hospital and lab services and COVID-19 testing became more widely available. However, overall health spending appears to have dropped slightly in 2020, the first time in recorded history.
As of December 2020, health services spending was down about 2.7% (seasonally adjusted annual rates) and it remained suppressed in January 2021. When adding in spending on prescription drugs, total health spending was down by just about 1.5% as of December 2020 compared to the same time in 2019. The U.S. GDP fell by 3.5% by the end of 2020, meaning that, although health spending dropped, it likely represented a larger share of the economy than in past years.
The drop in health spending in 2020 reflects a decrease in utilization for non-COVID medical care. Particularly early in the pandemic, it appears many people delayed or went without medical care they otherwise would have received. Although healthcare use picked up toward the end of the year, it was not enough to compensate for the missed care earlier in the year. Additionally, the cost of COVID-19 vaccine administration will likely have an upward effect on claims costs in 2021, as several insurers noted in their rate filings to state regulators.
Related Content:


In 2020, health services revenue fell by 1% compared to 2019
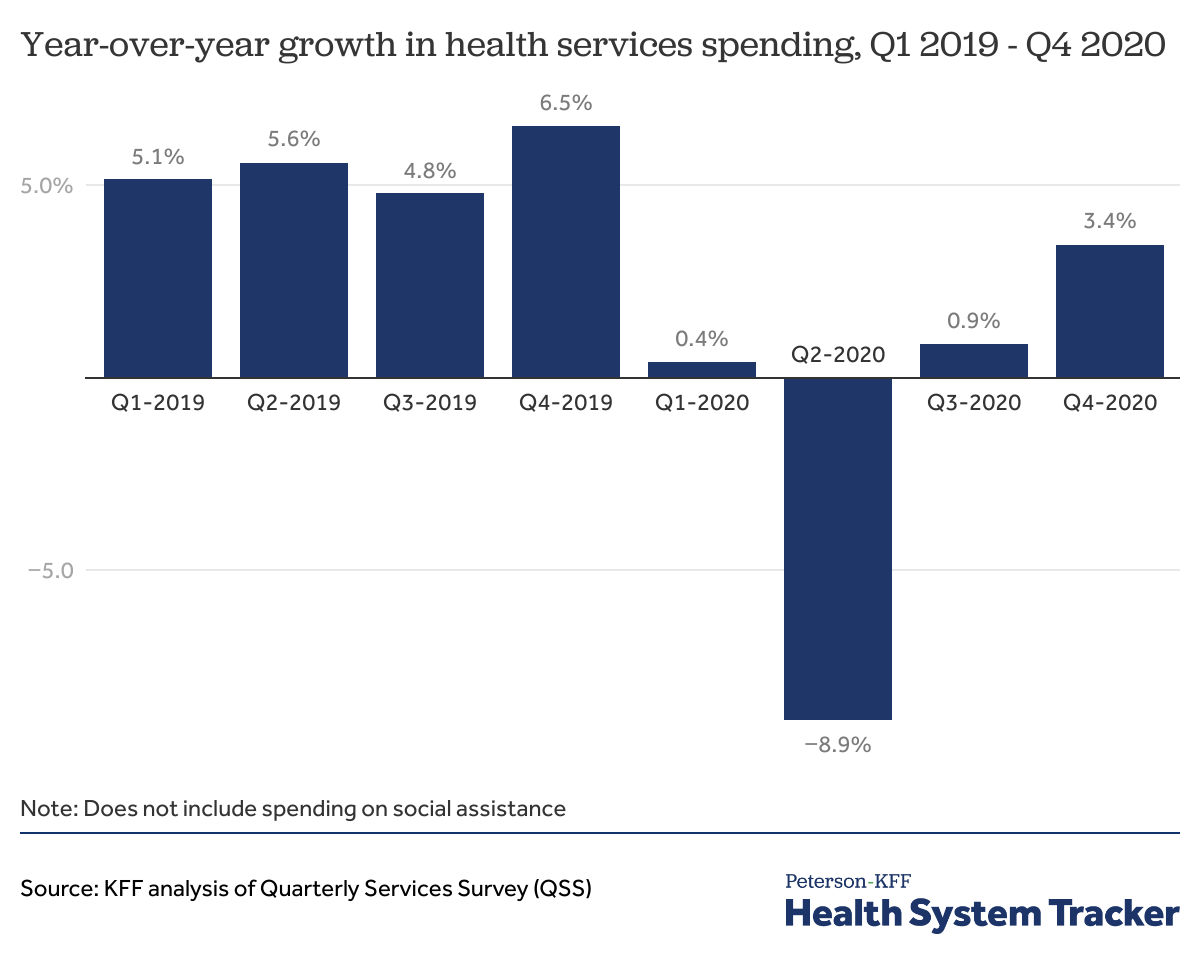
One way to look at health spending is to use the Quarterly Services Survey (QSS) data. Across all health services, which excludes prescription drugs and social services, health services revenue was down by -8.9% in the second quarter of 2020 relative to the second quarter of 2019. In third quarter 2020, health services revenue was up by 0.9% from third quarter 2019. In fourth quarter 2020, health services revenue was up 3.4% relative to the fourth quarter of 2019.
Although spending rebounded at the end of 2020, health services spending was nevertheless down by about 1% in 2020 relative to 2019. The QSS data do not include spending on pharmaceuticals, which, as discussed more below, have been spared from pandemic-related spending drops.
Spending on health services dropped sharply in March and April 2020, but has mostly recovered since
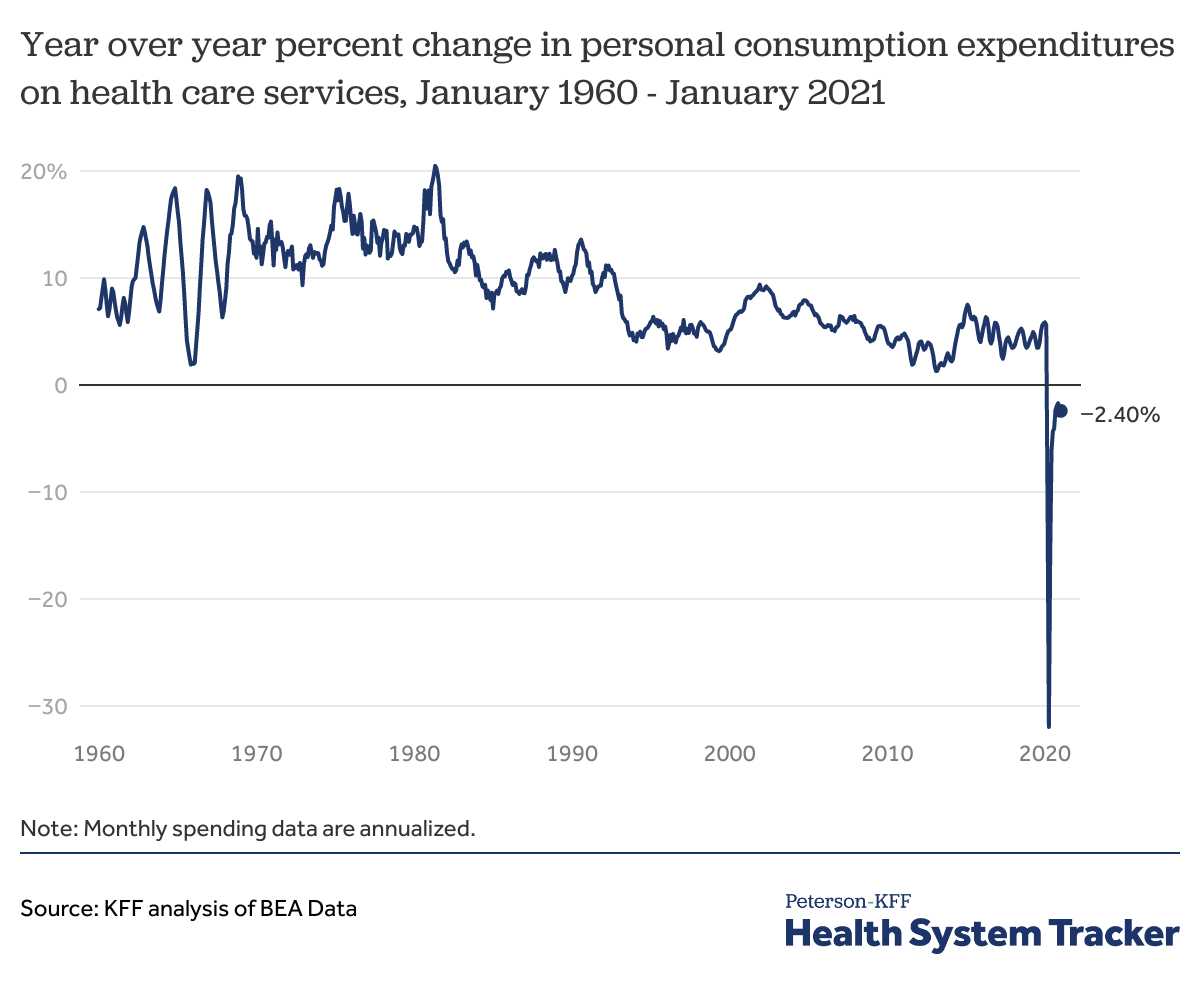
Another way to look at health spending trends is to use the personal consumption expenditure (PCE) data from the Bureau of Economic Analysis (BEA), which is published monthly on an annualized basis. Like the QSS, the BEA’s personal consumption expenditures (PCE) data show spending on health services was down sharply in spring 2020. (The monthly figures are estimates, and are later adjusted, in part based on results from the QSS.)
At the nadir in April 2020, personal consumption expenditures on health services (not including pharmaceuticals) were down by -31.9% on an annualized basis. This was unprecedented, as year-over-year personal consumption expenditures on health services have grown every month since the data became available in the 1960s. However, after plummeting in spring 2020, spending on health services has rebounded, and by January 2021, was down just -2.4% from the previous year (seasonally adjusted at annual rates).
The chart above does not include spending on pharmaceuticals and other medical products, which was up 5.0% year-over-year in December 2020, and up 1.0% year-over-year as of January 2021 over the same time the year before. Prescription drug revenue has not suffered from the pandemic the way health services revenue has, as the latter fell largely due to social distancing and the delay or cancellation of elective procedures. Combined spending on health services and prescription drugs was down by -1.53% as of December 2020, and by -2.2% as of January 2021 (seasonally adjusted annual rates, relative to the same month in the prior year).
As of fourth quarter 2020, U.S. GDP was down by -3.5% (seasonally adjusted at annual rates), relative to fourth quarter of 2019. This suggests health spending may represent a somewhat larger share of the economy in 2020 than in past years. The National Health Expenditure Accounts (NHEA) are the official source of health spending in the U.S. The NHEA counts a broader set of health-related spending compared to the BEA methodology. The NHEA data showed health spending as a percent of the U.S. economy was 17.7% in 2019. The NHEA estimates of health spending as a share of the economy in 2020 will be updated later in the year. Based on BEA data, we estimate health spending as a percent of the U.S. economy might have increased by 0.1 percentage points in 2020.
Related Content:
By the end of 2020, physician’s office spending was still down from 2019
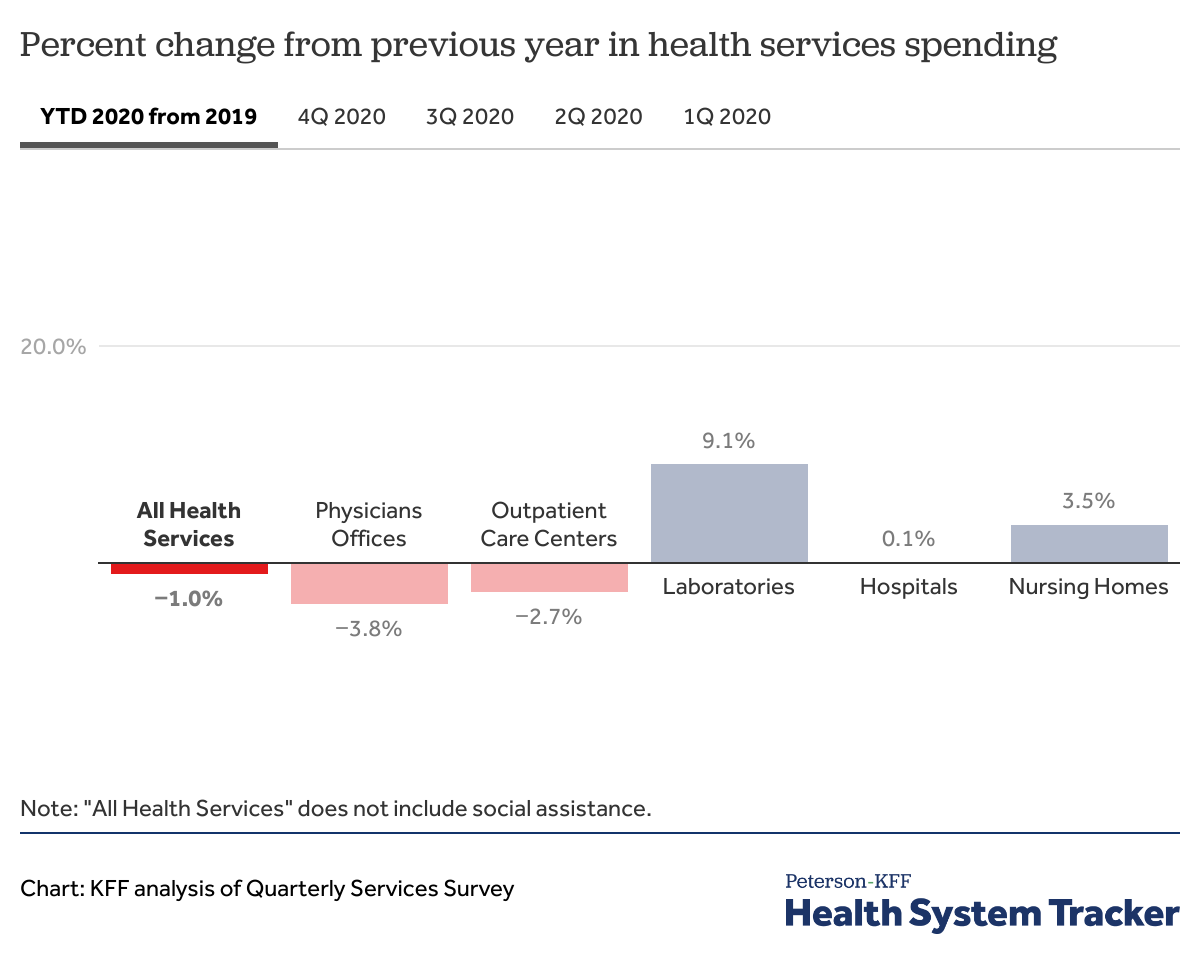
Through 2020, the Quarterly Services Survey shows that health services spending is down by 1.0% relative to 2019. Ambulatory care settings, like physician offices (-3.8%) and outpatient care centers (-2.7%), saw drops in annual health revenue, while revenue for labs and nursing homes increased and hospital revenue was about flat. Although not shown in this chart, dental providers have seen some of the largest drops in revenue among health services.
As can be seen by clicking on the quarterly revenue tabs in the chart above, revenue for some health service providers has been volatile. For example, spending on medical and diagnostic laboratories was down by -14.5% in the second quarter of 2020, but as COVID-19 testing became more widely available through the year, spending on labs was up by 32.7% in the fourth quarter year-over-year.
Similarly, hospital revenue was down by -5.6% in the second quarter of 2020, with the cancellation of many elective procedures, but revenue bounced back in the third and fourth quarters, rising 5.7% over the previous year by fourth quarter 2020. On net, hospital revenue was therefore mostly unchanged in 2020 compared to 2019.
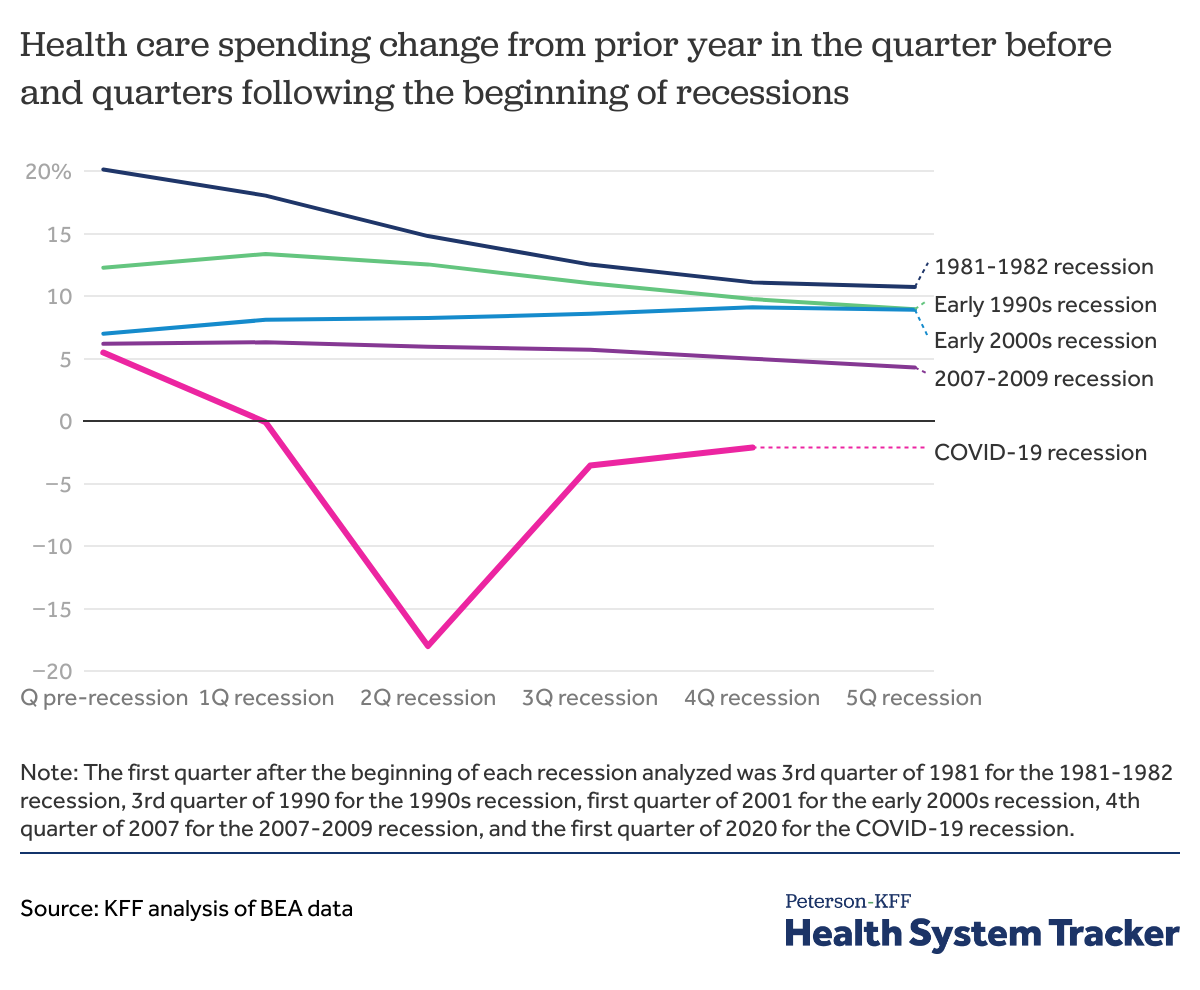
The COVID-19 recession is the first recession during which health spending has decreased
Although social distancing and hospital capacity concerns were key drivers of the drop in health spending in 2020, use of health services may have also been suppressed due to affordability concerns amid the struggling economy.
In the chart above, we compare health spending in the quarter before, the quarter of, and the four quarters following the beginning of a recession based on BEA quarterly data. In previous recessions, except for the 2000s recession, health spending growth slowed down in the quarter following the first quarter of the recession, as compared to the same quarter of the previous year. Following the 2000 recession, year-over-year health spending growth increased from 7% in the quarter before to 9% in the fourth quarter relative to the same quarter in the year before.
Health spending growth has slowed down in the quarters following the beginning of some recessions. However, the COVID-19 recession marks the first of the past 5 recessions to result in a decrease in health spending growth year-over-year. Health spending was down -18% in the second quarter of 2020 and stayed down at -2.1% in the fourth quarter of 2020 over the prior year.
Related Content:
Hospital admissions fell in the spring of 2020, but were back to about 94% by December
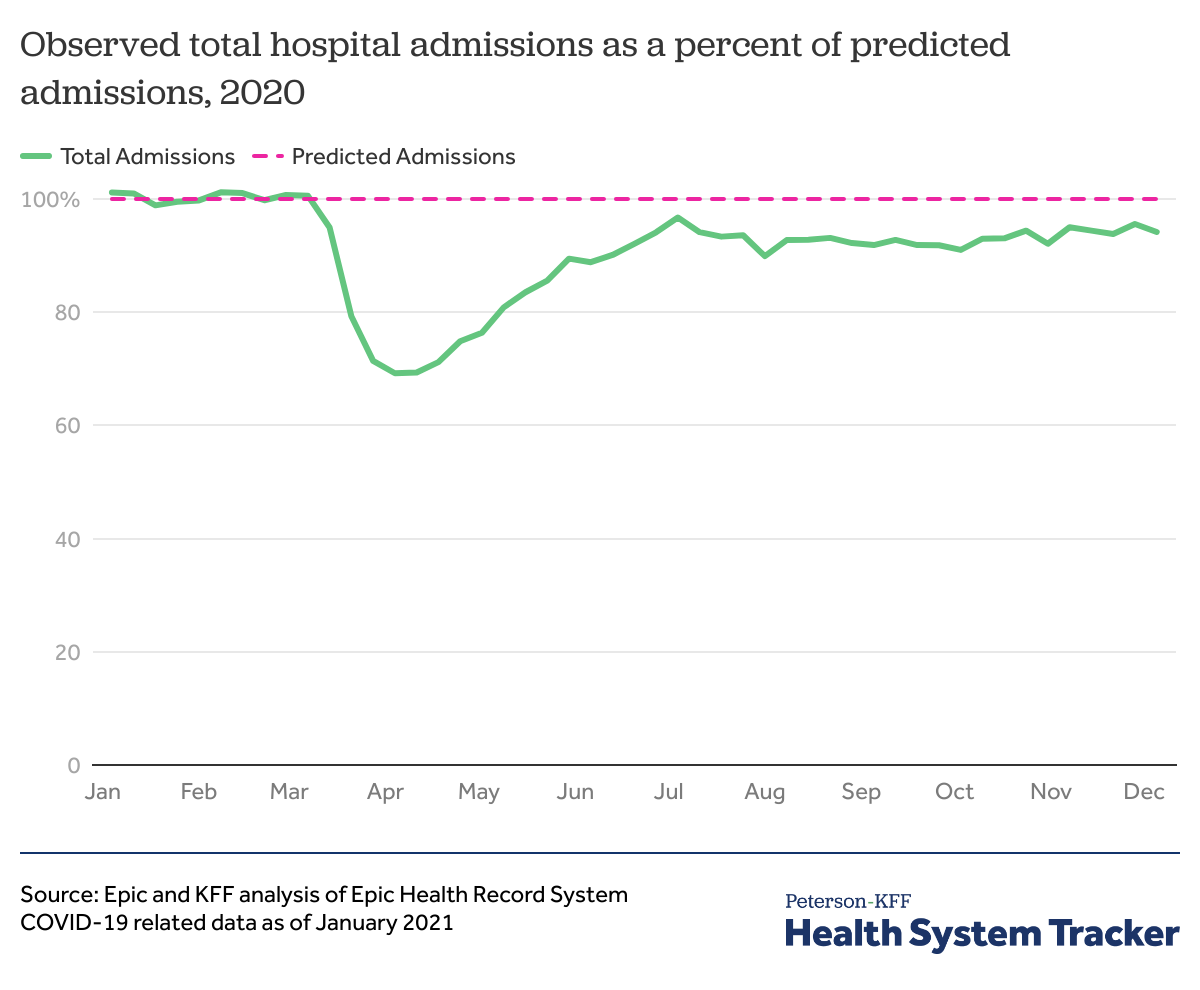
An analysis of hospital utilization data by Epic and KFF found that while hospitalizations had fallen in the spring of 2020, admissions had picked back up to about 95% of expected utilization (based on historical patterns) by July 2020. After dropping again to 90% of expected admissions by August, overall admissions for the year rebounded to 94% of expected admissions as of December 5, 2020. As these data are only available through early December 2020, it is not yet clear how the latest spike in hospitalizations due to COVID-19 — which resulted in some hospitals again reaching capacity — affected utilization into early 2021.
Telemedicine use grew rapidly during the pandemic, but not enough to offset drops in in-person office visits
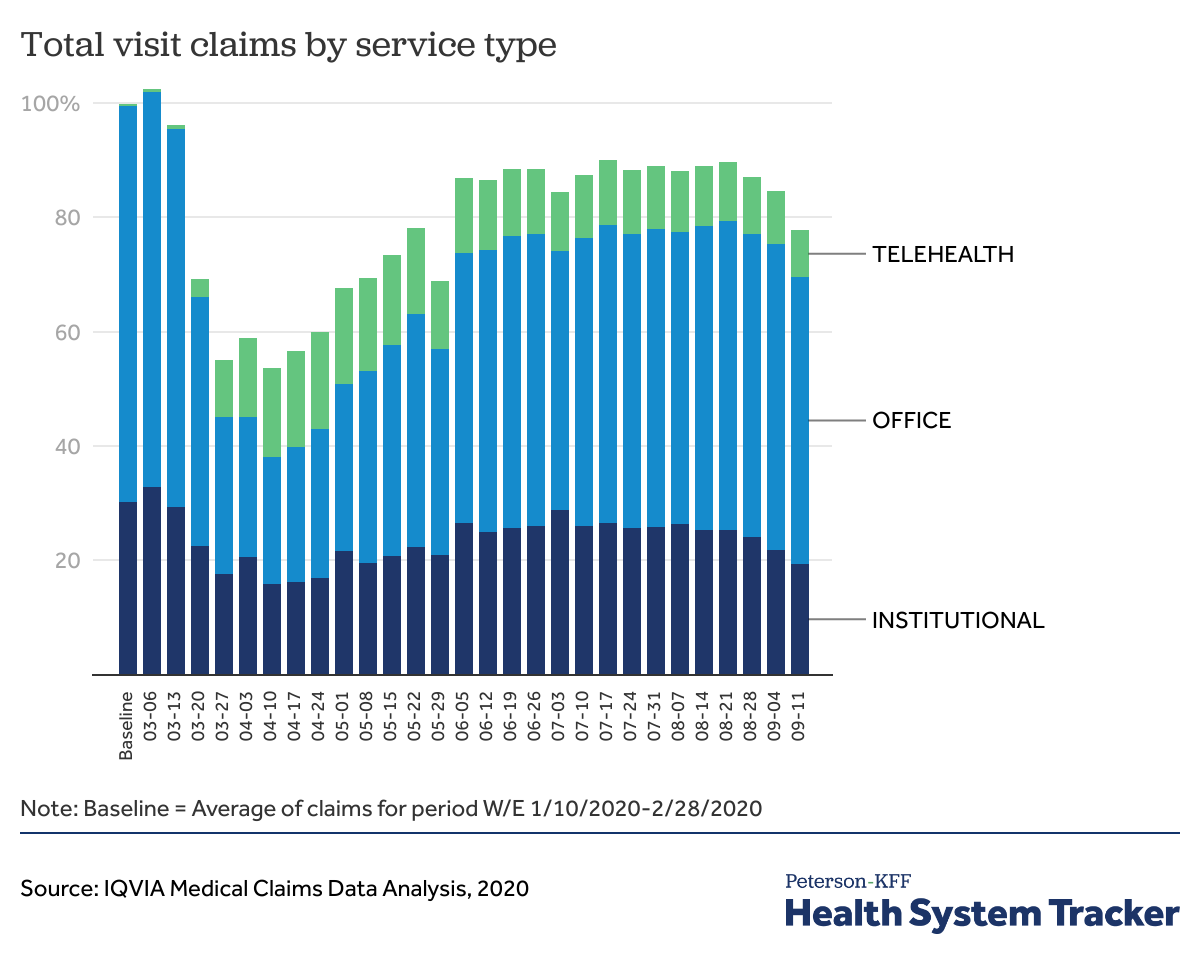
Although most employer health plans cover telemedicine services, our analysis found that telemedicine uptake before the coronavirus pandemic remained low. In 2018, 2.4% of large group enrollees who had an outpatient office visit had at least one telemedicine visit.
However, with social distancing, changes to provider payment for telehealth, and recommendations to call ahead to providers, telemedicine use has increased with the pandemic, according to analysis by IQVIA. Even so, as the chart above demonstrates, telehealth use was not large enough to fully offset the drop in in-person care. (Earlier analyses from Epic Health Research Network, FAIR Health, and CVS Health all show sharp increases in telemedicine use relative to the period before the pandemic.)
There was a drop in preventive services utilization through the third quarter of 2020
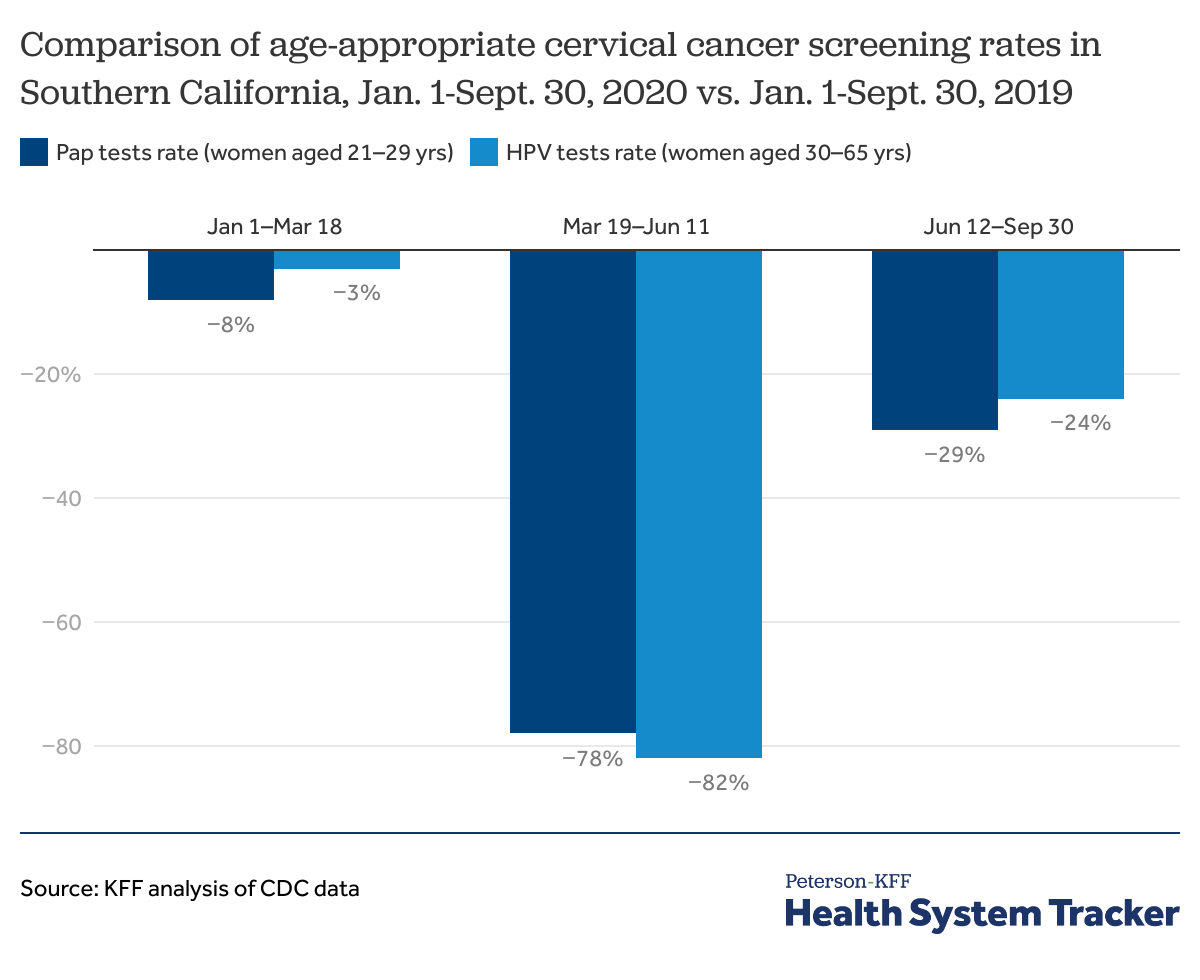
The CDC’s data on the utilization of age-appropriate women’s cervical cancer screening among women insured through Kaiser Permanente Southern California shows preventive services utilization rebounded but was considerably below the pre-pandemic levels. During March 19-June 11 of 2020, there was a 78% and 82% drop in cervical cancer screenings for women aged 21-29 years and women aged 30-65 years, respectively, relative to the same time period in 2019. During June 12-Septembre 30 of 2020, preventive services utilization remained 29% and 24% below 2019 levels for aged 21-29 years and women aged 30-65 years, respectively.
According to an analysis of electronic health records by Epic Health Research Network, the average weekly screenings for breast, colon, and cervical cancers dropped 94%, 86%, and 94% during January 20 – April 21, 2020 relative to the averages before January 20, 2020. An analysis by IQVIA found that oncology visits for newly diagnosed cancer patients began to increase in summer, but and had still not reached baseline in October. If cancer cases are missed or patients are diagnosed at later stages, this could have long-term impacts on both health outcomes and costs. Similar patterns can be seen for other serious and chronic diseases. The sustained decrease in health services utilization, including preventive services, may lead to more serious diagnoses and increased disease burden in the future.
With uncertain short and long-term effects of COVID-19, many insurers held 2021 premiums flat
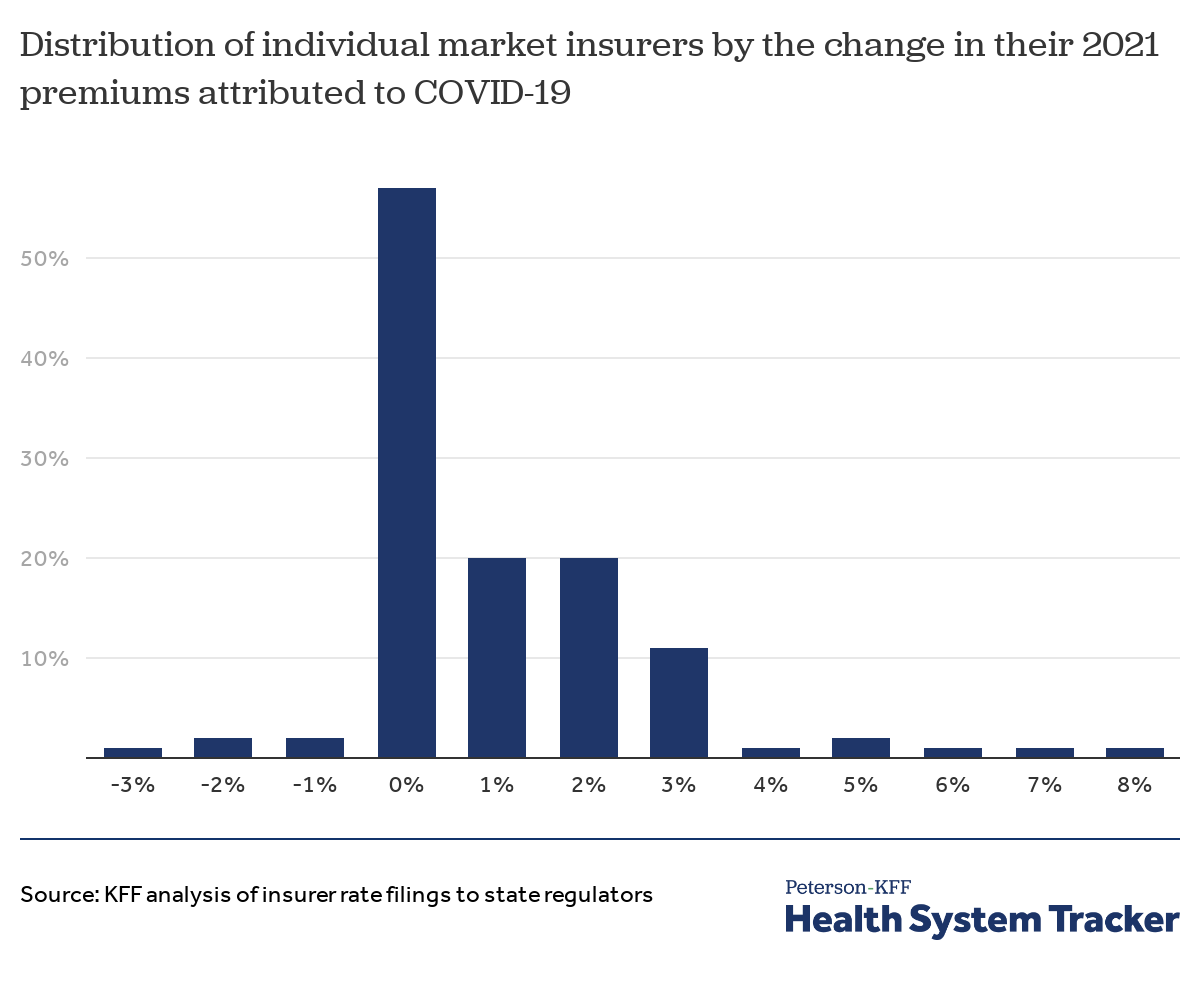
Individual market insurers are required to file detailed premium justifications to state regulators for the coming year. We analyzed these filings to assess the effect COVID-19 will have on 2021 premiums. In their rate filings, most insurers pointed to remaining uncertainty surrounding pent-up demand for delayed or forgone health services in 2020, the costs associated with distributing coronavirus vaccinations, and the direct costs of treating people with COVID-19. Of those insurers that specified a rate impact due to the pandemic, most said the pandemic would have a net-zero effect on their costs in 2021, with some insurers saying they expect costs to drop and others expecting costs to increase. This variation in expectations across insurers illustrates the remaining uncertainty of how the pandemic will continue to affect the U.S. health system in the coming year and beyond.
As the year 2020 progressed, it became clear private health insurers were likely profitable from the pandemic’s suppressed healthcare spending, and that many insurers would likely owe significant Medical Loss Ratio rebates under the Affordable Care Act. In response, a number of insurers preemptively offered premium relief and voluntarily waived cost-sharing for COVID-19 treatment and certain other services.
The Peterson Center on Healthcare and KFF are partnering to monitor how well the U.S. healthcare system is performing in terms of quality and cost.