This brief examines some of the issues and challenges researchers and other data users may encounter when using the price data reported pursuant to the Transparency in Coverage, or TiC regulation, promulgated by the Departments of Health and Human Services, Labor and Treasury (“Agencies”) during the first Trump administration. The regulation requires group health plans and health insurance issuers (“payers”) to make available, among other things, a machine-readable file with all of their in-network provider rates for covered items and services. Payers began releasing price data under the rule in July 2022, following an earlier requirement that hospitals report prices they negotiate with payers. From the onset, the complexity and extremely large size of many of the data files have made it difficult for researchers and many others to effectively gain access to the information. Over time, however, some organizations have become more proficient in downloading these data files and organizing the information for researchers and others to use. The discussion and examples in this brief use TiC data downloaded and maintained by one of those organizations, Turquoise Health. The challenges listed here are not caused by Turquoise Health; their aggregation of the data merely makes them more straightforward to identify.
A primary purpose of the TiC regulation is to make prices for health care items and services available on a comparable basis to consumers and others. The Agencies suggest that this information will allow consumers to evaluate their health care options and make cost-conscious decisions, help market participants protect and engage consumers, reduce surprises for consumers about their out-of-pocket costs, and increase market competition in ways that may reduce price variation and lower overall health care costs.
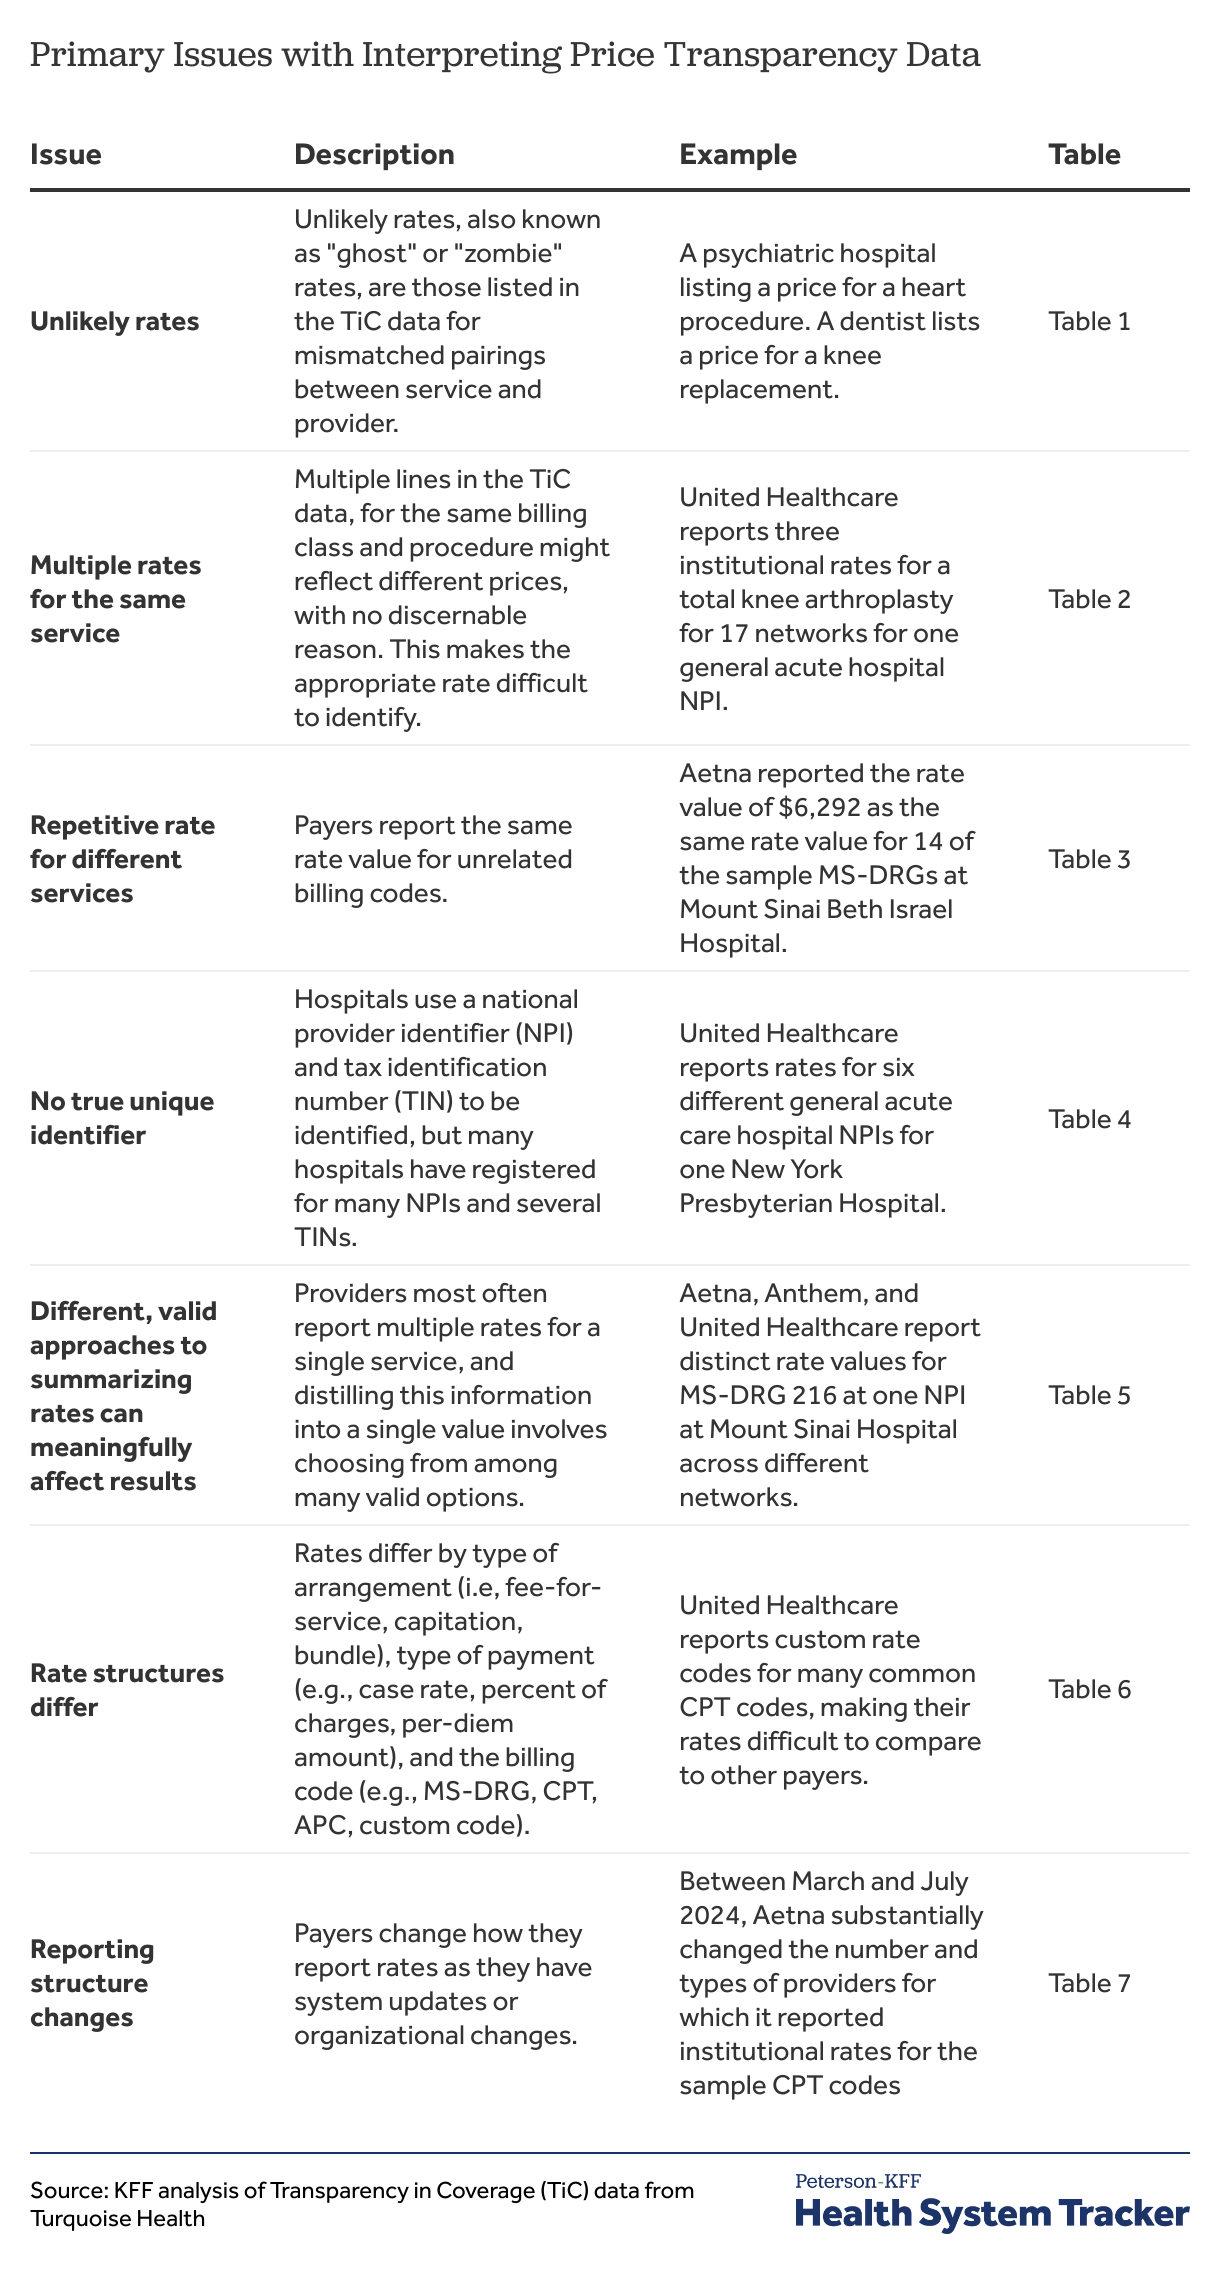
The regulation and accompanying instructions set out in significant detail the methods that payers should follow in their reporting, including how to identify providers and which billing codes to use. Ideally, a data user would be able to select a billing code for a service and a payer and see and compare the reported rates for all the providers of that service within the network within a given market or area. While oftentimes you can do this, just as regularly issues arise, raising questions about how to interpret the data. Why does a payer report three different rates for the same network with the same provider for the same service? Why does the psychiatric hospital have a rate reported for a heart surgery, and why is it the same rate as the acute care hospital at the same address? Why do a dentist and an optometrist have rates from a payer for an upper GI endoscopy, and why are the rates different for a service that neither provides? Why doesn’t United Healthcare – the largest health insurer in the country — report any institutional rates for many common CPT codes, such as the emergency room evaluation and management codes? Why does a payer have reported rates for a network or for a provider type in one month and then not in the next? This analysis examines questions such as these and discusses how they may affect researchers and other data users who want to understand and compare prices for services in a market.
After a description of the transparency data, this brief presents an overview of its key findings, divided into corresponding subsections. These key findings include:
- Unlikely rates reported for providers that do not provide the service
- Multiple rates reported for the same service
- Repetitive rates for multiple services
- Challenges identifying rates for hospitals
- Different, valid approaches to summarizing rates can meaningfully affect results
- Rate structures differ across payers
- Reporting structures can change materially over short periods of time
Each subsection references examples that are presented in further detail in the Appendix. Readers can move back and forth between each subsection and the Appendix using the corresponding links to understand the full context of each key finding. Finally, the Methods section discusses analytical choices made in this brief and defines several important terms.
Related Content:
Description of the transparency data
The amount of data made available by payers under the TiC rule is massive; Turquoise Health estimates that they take in up to 300 TB of data each month. [1] Even when duplication is removed, the remaining amount of information is far too large to evaluate in any comprehensive way. Instead, the approach taken here is to focus on the rates reported in July 2024 for a sample of billing codes by large insurers for in-network providers in New York City. More specifically, the brief illustrates though a series of examples some of structural issues and challenges that can affect the usefulness of the data, primarily from the point of view of a researcher trying to use it.
The discussion and examples presented here are based primarily on the in-network rates for fee-for-service arrangements reported by four large payers (Aetna, Anthem, Cigna, and United Healthcare) for providers located in New York City for a sample of billing codes: 26 MS-DRGs, 40 CPT codes for institutional rates; and 3 CPT codes for professional rates. Additional information, including a list and description of the sample codes, is included in the Methods. In particular, reviewing the “Important Terms for Understanding Rates” section may be helpful as there are quite a few factors that can distinguish one reported rate from another.
Key findings
The enormous volume of reported rates in the TiC data holds a promise of opening the black box of health care pricing in private coverage arrangements. Long considered trade secrets, the TiC rule requires payers to report prices negotiated with network providers for all contracted items and services, and, if different, the amounts on which cost sharing for plan enrollees is based for those items and services. A particular hope is that people using the data will be able to see and compare prices across payers and providers for similar items and services, sparking more competition over prices enabling more informed decisions by consumers and purchasers.
Using the TiC data to explore and compare reported rates for sample services reported by select payers for providers in New York City illustrates several challenges for researchers and other data users, particularly when trying to compare rates across payers. In some cases, these issues appear to flow from the way the data are required to be reported, while in others they appear to reflect the ways that payers are interpreting the requirements in reporting the information. The issues with the TiC data as currently reported raise questions about how useful it can be in doing systematic analysis.
Among the more important of these issues the KFF analysis found are the following:
Unlikely rates
The most recognized issue with the TiC data is that many of the reported rates are for providers that do not, and sometimes cannot, provide the service for which the rate is reported. These have sometimes been referred to as “ghost” rates or even “zombie” rates, but are referred to as “unlikely rates” here. As a result, using the TiC data requires, among other things, sifting through the rates to focus on those reported for providers that are most likely to provide the service in question while avoiding the rates that do not make sense.
There are several common ways that these unlikely rates occur:
Institutional rates for organizations. A recurring pattern for rates reported by each of the four payers in New York City is that the same rate or rates are reported for multiple parts of hospital (e.g., a hospital, a clinical laboratory, and psychiatric hospital at the same location) for multiple services (see example below).[2] These common rates can extend to closely affiliated providers as well (e.g., general acute care hospital and an affiliated ambulatory surgical center having the same rate for a number of services). In other cases, the same two, three, or even more rates might be reported for a hospital as well as for some or all of its affiliated parts, without any information available to determine which rate might be appropriate for which part.
Sometimes, it is quite easy to spot unlikely rates in these situations. For example, neither a clinical lab nor a psychiatric hospital is likely to be paid over $270,000 for a heart procedure. However, it can be more difficult for services that could be provided either in the hospital or in one of its affiliated parts. These situations make it difficult to give credence to rates reported for units or subparts of hospitals or other large organization because the rates may actually apply to services in another part of the institution.
Professional rates for practitioners and group practices. Another common issue across the four payers is reporting of professional rates for numerous types of practitioners or group practices that could never be involved with the service. For example, there are many cases where dentists, optometrists, and audiologists have reported rates for knee replacements, upper GI procedures and much more. Perhaps surprisingly, these different types of providers often have different rates from a payer for the same network for the same service that none of them provides, suggesting that there may be some underlying formula at work that takes something about the provider or provider’s practice into account in calculating the rates to be reported.
Data users wanting to use these professional rates may encounter a bevy of unlikely rates for unlikely providers and sifting through them requires making judgments about which types of providers are more or most likely to provide each of the services in question, taking into account among other things their type (i.e., practitioner or organization), classification (i.e., area of practice) and specialization. These decisions can dramatically affect the number of providers included in an analysis. Taking an orthopedic surgical procedure as an example, the universe could be limited to providers classified as surgeons, to only those classified as orthopedic surgeons, or even more narrowly to only those classified as orthopedic surgeons with or without certain specialties. More or less care can be given to pinpointing the most likely providers of different services, and the process can add a substantial burden to analyses that involve multiple billing codes.
Billing class and types of providers. Another source of seemingly unlikely rates occurs when payers report types of rates that do not fit with the type of provider for which they are reported. Cigna, for example, reported a large volume of institutional rates for individual practitioners (providers with what is known as a Type 1 NPI)[3] for a number of CPT codes. Institutional rates are typically paid to facilities or other organizations for the services that they deliver, not to individual practitioners. Another example is Aetna reporting the same rates as both professional rates and institutional rates at some hospitals for some MS-DRGs. Aetna in previous months also reported institutional rates for many physician group practices for services that could not realistically be provided at the practice (e.g., a total knee replacement, see Table 27), but it stopped doing so sometime in mid-2024.
The large number of unlikely and sometimes odd rates in the TiC data is actually consistent with language in the preamble to the TiC regulation, which directs payers with a rate structure that applies negotiated rates to every provider in a network tier to report those rates for every network provider that participates in that tier. This language does not suggest that payers should limit their reporting of rates for a service to participating providers that actually provide the service, or even to those that could do so. Whatever the reason for these unlikely rates, they are a big part of the TiC data and can add considerable complexity to understanding and analyzing reported rates.
Multiple rates for the same service
Another issue that can significantly complicate understanding and comparing rates for services is that payers sometimes report two or more rates for the same billing class (e.g., institutional or professional) for the same network for a service for a provider, often a hospital. Quite often data users encountering these situations will not have enough information to determine if or when any of the rates apply. These multiple rate situations arise in several ways:
Different types of negotiated rates. One situation that is easy to understand, but not necessarily easy to use, occurs when payers report more than one type of rate within a network for a service for a provider, with all of the other identifying factors the same.[4] Aetna reported both per diem and negotiated type rates (e.g., dollar values) for a number of MS-DRGs for providers in New York City, while United Healthcare did so for two of the sample MS-DRGs. United Healthcare helpfully included additional specifications for these situations in the additional information field: in this case the per diem rates were to be used within a range of revenue codes. Aetna did not include anything in this field for any of the sample rates for New York City and there is no other information that would permit data users to determine when each type of rate applies.
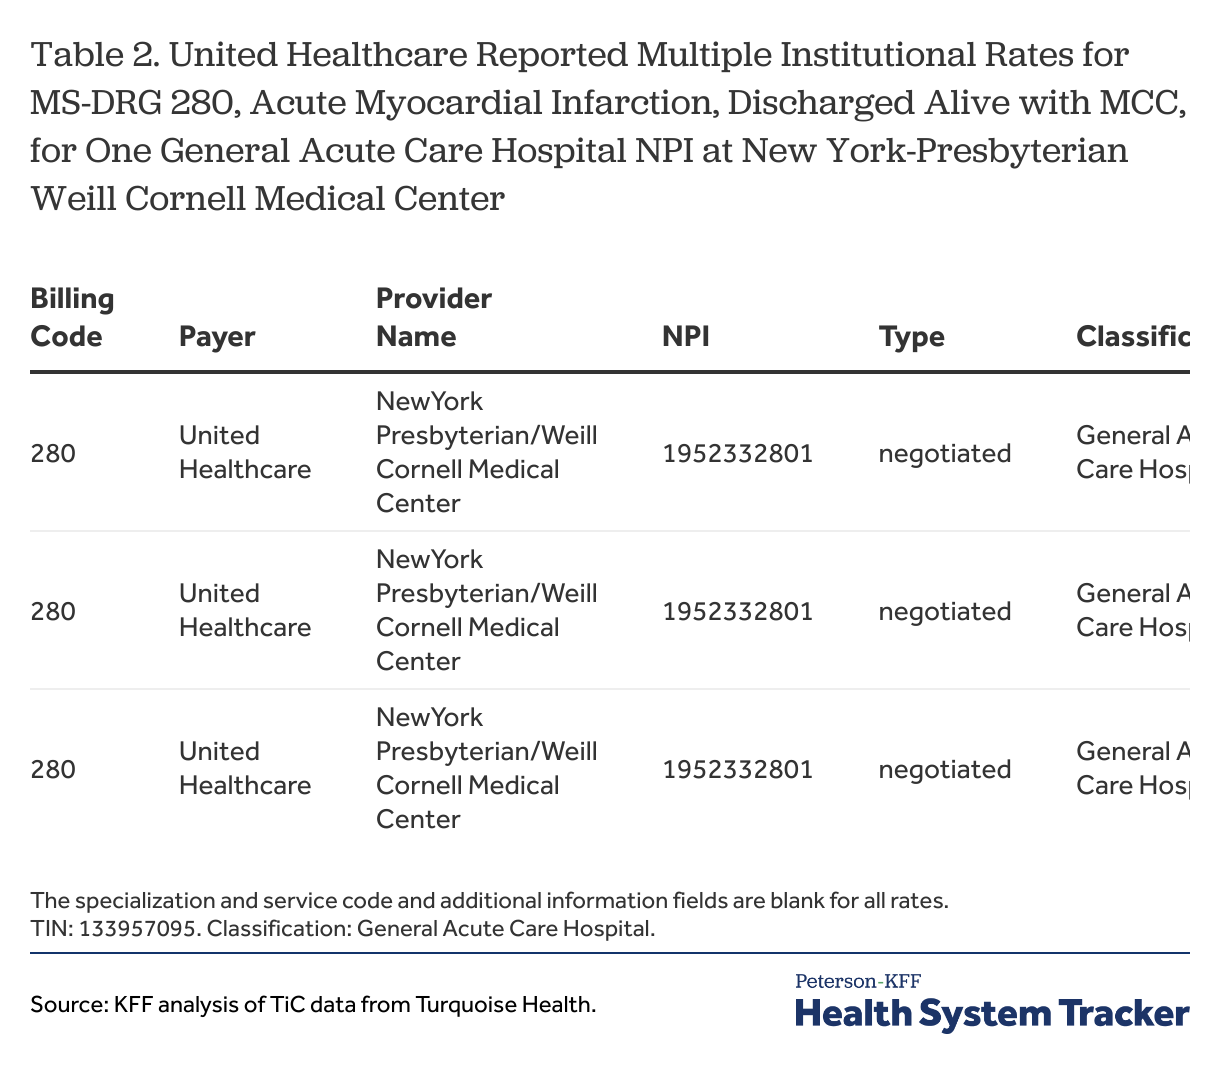
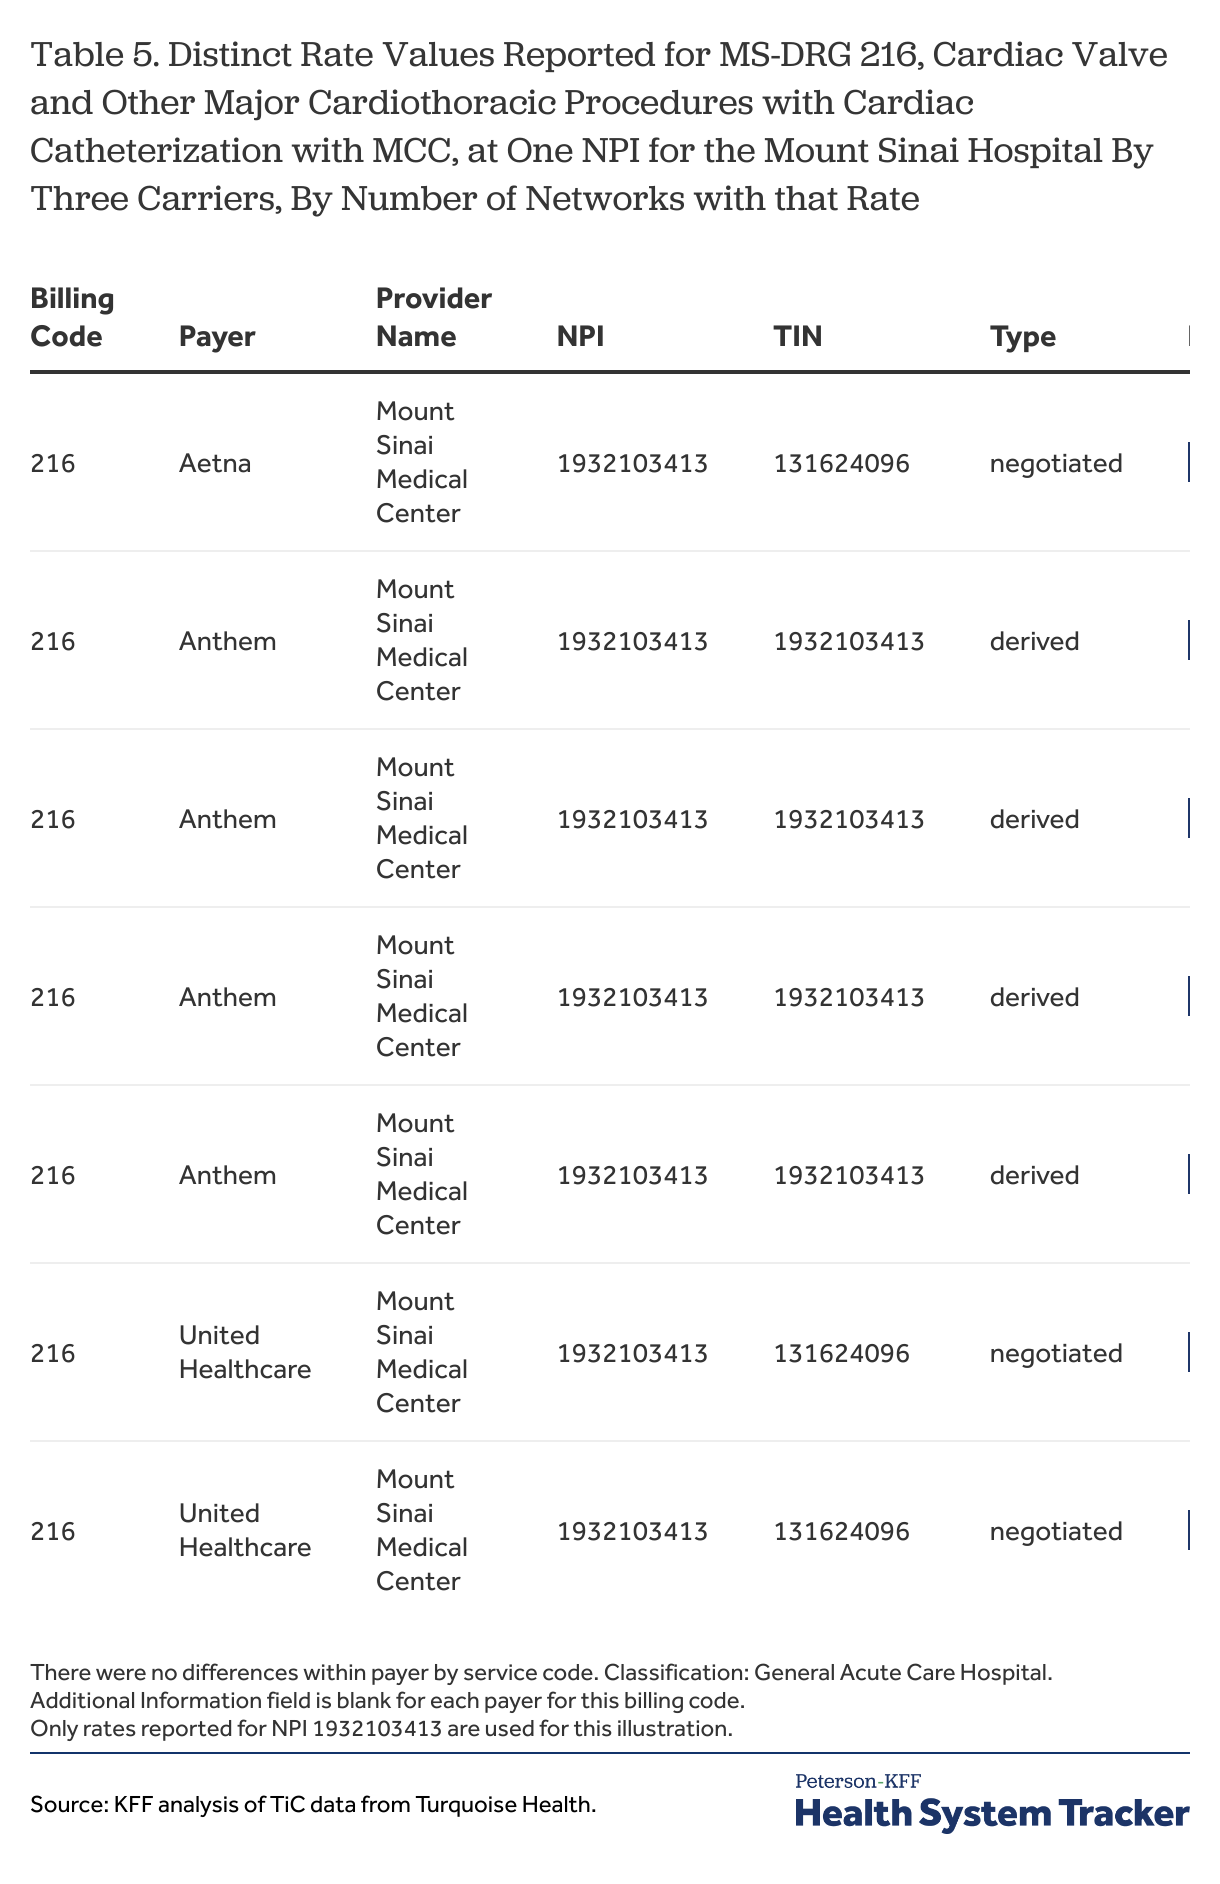
Multiple rate values with the same negotiated type. A more difficult circumstance occurs when payers report two or more rates of the same type within the same network for the same hospital or other provider for the same service, again with all other identifying factors the same. The preamble to the TiC regulation suggests that this situation should not occur, but each of the four payers reported rates this way for some of the sample billing codes for providers in New York City. In some cases this may involve just a few billing codes between a payer and provider, but in others it is more pervasive: United Healthcare reported three rate amounts for each of 26 sample MS-DRGs for 17 networks for the New York-Presbyterian Weill Cornell Medical Center; Aetna reported three rate amounts for 12 of the sample MS-DRGs and two rate amounts for nine others for all of its networks for The Mount Sinai Hospital.[5] An example is shown below; there are numerous other examples as well.
These situations present a serious issue for TiC data users because they show that there is missing information that users would need to know, but in most cases cannot know, in order to determine which of the multiple values represents the cost of the service in the circumstances of interest.[6] Of additional concern is that multiple reported rate values are not necessarily similar. There are multiple examples where the higher reported value is 20% or 30% or even a larger percentage higher than the lowest reported value for the otherwise same arrangement. This can be a meaningful range when the goal of an analysis is to summarize or compare rates in a market. Having multiple reported rates for the same situation also complicates any attempts to summarize the cost of the service for that provider: trying to collapse or summarize two or three rates into one value may not provide an accurate picture of the price for a service. Users may be tempted to drop these cases because they are ambiguous, but that may inadvertently exclude rates from important payers and providers.
Repetitive rate for different services
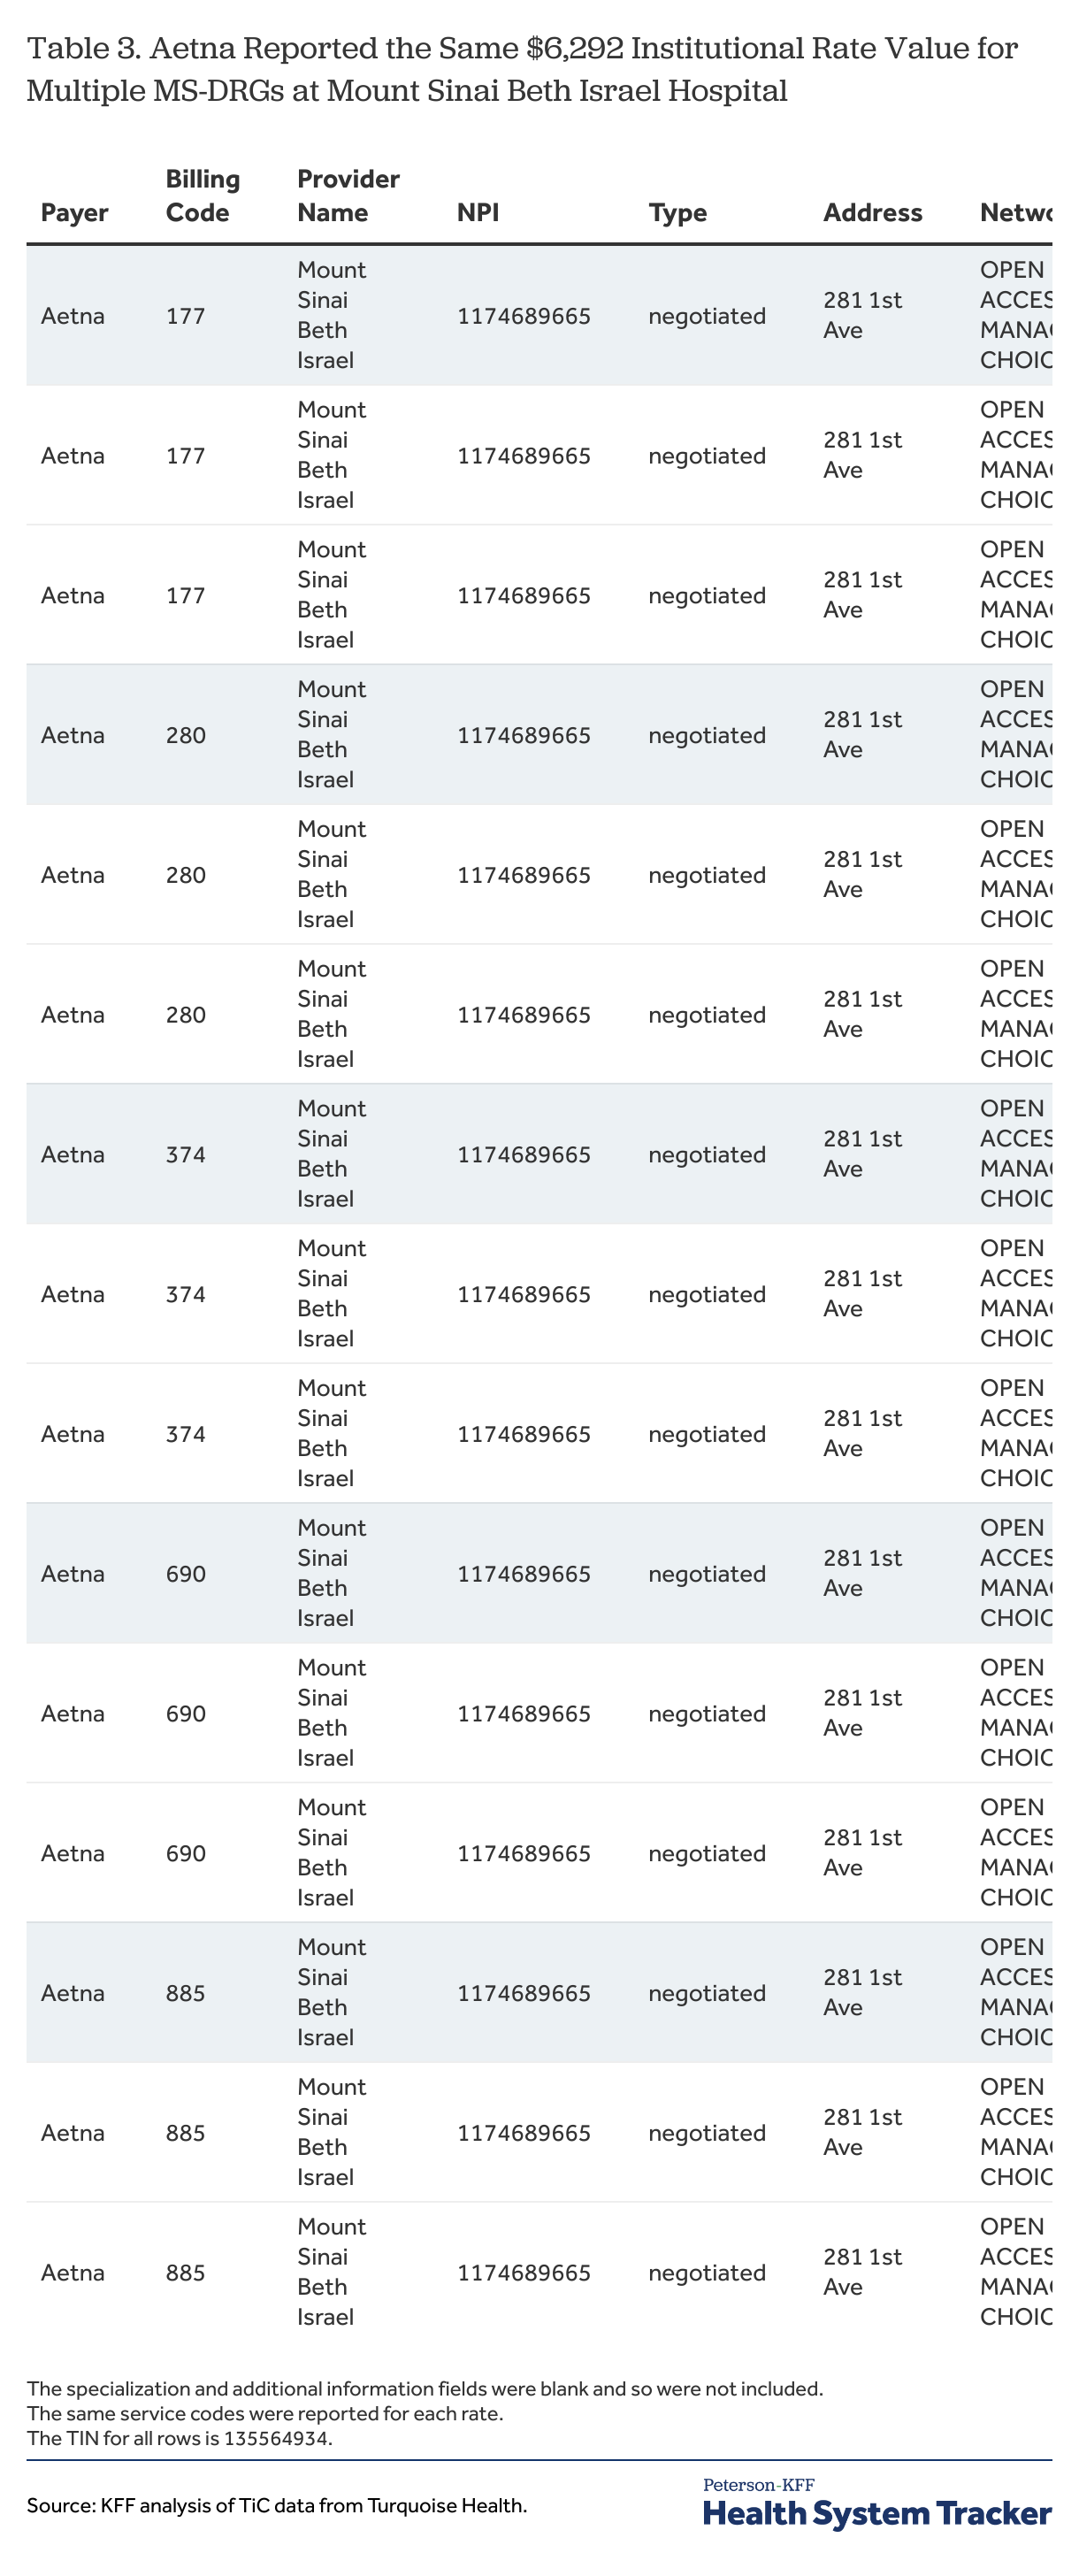
A different type of reporting problem occurs when payers report the same rate value or values for many unrelated billing codes within a network for a provider. Sometimes these repeated rate values are reported along with other rates for each of the billing codes, while in other instances the repeated value is the only rate reported. As examples, Aetna reported the rate value of $17,348 as one of multiple reported rates for 12 of the 26 sample MS-DRGs, for services ranging from heart failure to digestive malignancy; Aetna also reported the rate value of $6,292 for 14 of the sample MS-DRGs for 28 networks at Mount Sinai Beth Israel Hospital (see example below); and United Healthcare reported the rate value of $16,118 as the only rate value for 12 of the sample MS-DRGs at the Lenox Hill Hospital over a wide range of services. These values clearly cannot be meant to be the entire payment for the cost of each of the different services for which they are reported, so it seems likely that most data users would want to exclude these rates from their analyses. Detecting these situations can be a challenge, however, as these patterns realistically are not apparent unless one is viewing the rates reported by a payer for multiple billing codes with a provider side-by-side.
A more general concern is why these rates are being reported for these MS-DRG codes at all. The repetitive filing of the same amounts might suggest that the rates may be for some ancillary item or service available to patients with multiple conditions at these hospitals, but there is no way to understand this from the data. Whatever the reason, evidence that payers may be reporting rates for billing codes that do not describe the actual item or service being provided is problematic because it provides yet another reason to be skeptical about the rate amounts being reported.
No true unique identifier
One of the purposes of the TiC data is to be able to identify the rates for items and services at specific hospitals and other organizations, but it can be a challenge for data users to do so. Hospitals and other providers are identified in the data primarily by their national provider identifier (NPI), along with a tax identification number (TIN). An NPI is a unique identifier that providers receive from CMS that is used for electronic transactions under administrative simplification rules. Organizations can apply for more than NPI, and over time many hospitals have registered for multiple NPIs. Payers often report rates for more than one of these NPIs for a hospital or other organization, which raises the potential for rates or providers to be counted multiple times for the same arrangement in an analysis. United Healthcare, for example, reported rates for the sample MS-DRGs for six different NPIs classified as general acute care hospitals at the location of the New York-Presbyterian Weill Cornell Medical Center, while Aetna and Cigna reported rates for MS-DRGs for three of the same NPIs (see example below).[7] Analysts averaging rates for unique NPIs may not realize that their results are skewed because they are inadvertently including the same provider multiple times.
Unfortunately for data users that want to consolidate or summarize the rates reported for multiple NPIs at a hospital or other organization, there is not a reliable identifier to use for this. As noted above, Turquoise Health adds descriptive information about providers drawn from the NPI registry data and other sources to the database, but this information can differ in subtle and not so subtle ways across the different NPIs for an organization; for example, different variations in the organization’s name, different abbreviations in the street address, or even slight differences in the longitude and latitude information for NPIs with same address. Data users who perform their own data matching from outside sources will likely find similar issues, as many of these differences are present in the NPI database itself. Identifying reported rates with specific organizations, such as hospitals, would seem to require more complex approaches looking at the proximity of address information or searches of websites.
Different, valid approaches to summarizing rates can meaningfully affect results
There is rarely just one rate reported by a payer, per provider, per service. Payers generally report rates for several, if not many, networks for a provider NPI, and sometimes the rates vary across these networks (see example below). As noted earlier, payers sometimes report more than one rate value, per provider, per service, within a network, and these values also may vary across networks reported for the NPI. As also noted, payers sometimes report rates for more than one provider NPI for a service for an organization, each with the potential rate variation within and across the networks. The rate pattern reported for each NPI for a provider may be the same or it may differ across the NPIs. Summarizing these differences for a payer and provider involves distilling the variation within networks, across the networks, and then potentially among the different NPIs of an organization. There is no one right approach, and different choices may have a significant impact on the resulting metrics.
One key decision is how to treat the number of networks for which a rate is reported. Take for example a payer that reports two rates for an MS-DRG for an NPI at a hospital, one rate value for ten different networks and a second, lower rate value for one network. Including each network and rate separately would likely result in a summarized rate that is very close to the first rate (the median rate is the first rate and the mean would be heavily weighted to the first rate). In contrast, an approach that included only unique rate values in the calculation would likely produce a result halfway between the two values (the mean and the median would both do so), giving much more importance to the lower rate from the single network. Other approaches are also plausible, such as using the higher value, the lower value, or the most common value. Unfortunately, because the data contains no information on the local enrollment in each network, data users have no way of knowing which approach might be closer to the right one, and the results of the two approaches can be quite different if the two rate values are far apart. These choices take on more significance as more payers are added to the mix because the number of networks for which payers report rates in a market can vary widely, as can the variation in rates across networks, both of which can mask how much the approach that is chosen affects the results.
An additional set of choices emerges when payers report more than one rate in a network for a provider NPI for a service because data users must first decide whether, and if so how, to summarize the rates within networks before determining how to deal with any variation across them. Here again there a different choices; for example a data user could use all of the rates as valid rates, calculate a summary amount such as the mean, median, highest, or lowest, or even through out the observations from these networks as suspect or indeterminate. More sophisticated analyses might even seek to determine if any of the multiple rates should be dropped as unreasonable. These choices can become even more complex when a payer reports rates for multiple NPIs for a provider for a service, where the patterns of reported rates differ within or across the networks in the different NPIs.[8]
Developing an approach that addresses the issues that can arise from all of these patterns of reporting is a challenge, as is communicating the extent to which the results could vary if different approaches were used. There is no one correct approach. The TiC data is a set of prices, and there is no way to really know if one reported rate is more relevant than any other reported rate. The fact that one rate value appears in more networks does not mean that it is paid more often, nor does the fact that it appears in more NPIs at an organization. Any distillation of rates likely will camouflage the variation apparent in the examples above. Reporting ranges of rates between networks, or even within networks, along with other findings as part of an analysis, is one way one to communicate some of the variation may be lost when all of the rates between a payer and provider for a service are summarized.
Rate structures differ
A goal of the TiC regulation is to promote comparison of rates across payers and providers, but there are sometimes a surprising number of obstacles that can arise to frustrate that goal. The TiC regulation and reporting instructions require that reported rates be specified along a number of dimensions, including the type of arrangement (i.e., fee-for-service, capitation, bundle), type of payment (e.g., case rate, percent of charges, per-diem amount), and the billing code (e.g., MS-DRG, CPT, APC, custom code). The different types of arrangements and payment structures can limit comparisons — per diem rates are not readily comparable to percentage rates, and rates for bundled payments likely cannot be compared to rates in fee-for-service arrangements. Other differences that hamper comparisons arise from the ways that different payers report rates.
An example of this can be seen in the rates reported by the four payers for most of the sample MS-DRGs. While all four report rates as dollar amounts for hospitals in New York City, they used three different payment types—United Healthcare and Aetna for the most part reported “negotiated” rates, Anthem “derived” rates, and Cigna “fee-schedule” rates (see example below). Under the rule and instructions, “negotiated” type rates are agreed dollar amounts for an item or service (e.g., a case rate); “derived” rates are used when there is no negotiated rate with a provider, and are amounts that insurers assign to an item or service for internal accounting, provider reconciliation, or risk adjustment; and “fee-schedule” rates are amounts used to determine an enrollee’s cost sharing liability, when that amount is different than the negotiated rate. Payers that report fee-schedule rates are also expected to report a negotiated rate or a derived rate in most circumstances, although Cigna did not seem to do this in many instances, so data users only have the fee-schedule rates to consider.[9] Data users wanting to analyze the costs of many inpatient services in New York City would need to decide which of these different types of rates might be reasonably compared together. Negotiated type rates and derived rates are intended in the rule to be comparable, although payers seem to have a great deal of discretion as to how to calculate derived amounts. Negotiated-type rates and fee-schedule rates are not intended to be the same thing in the rule, so the two may not be comparable; excluding fee-schedule rates, however, would drop Cigna and sometimes other payers from many rate comparisons.
A second example involves the use of custom billing codes. United Healthcare reported institutional rates for over 100 custom billing codes in New York City, with descriptions such as “Emergency Room Level – 5” and “Durable Medical Equipment – 3”. These custom billing codes appear to be replacements for many common CPT codes for which United Healthcare did not report institutional rates. The use of these custom rates makes it quite difficult to include United Healthcare – the largest insurer in the country — in comparisons of rates for many common items and services provided in institutional settings.
Due to all of the differences in payment approaches and reporting, designing an analysis that includes all or even most of the important payers and providers in a market can be challenging, if not impossible. Decisions about how to limit an analysis to certain types of rates or type of billing codes, or even to a set of billing codes, can effectively exclude rates for important payers and providers from the results, and this risk grows as an analysis grows in breadth and scope. Some arrangements, such as those with capitated or bundled payment amounts, might be excluded more times than not. All of these differences in approach and reporting emphasize the importance of data users being clear about who and what is included within the scope of their findings.
Reporting structure changes
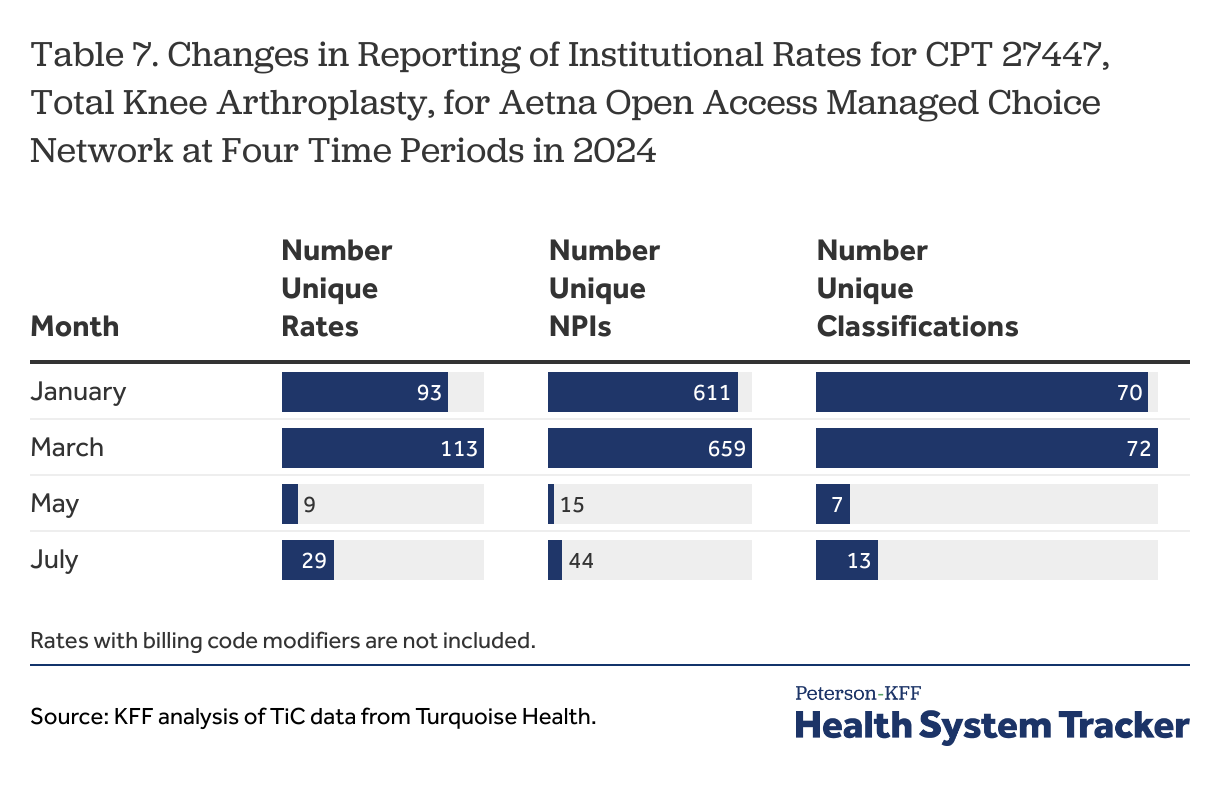
Although payers have been reporting TiC data since mid-2022, data users may still see changes in the way rates are reported. The TiC data is reported monthly, and data users should expect to see differences in rate values over time, as well as mid-year changes in networks and the types of reported rates, which are less easy to understand but still occur. For example, Aetna substantially changed the number and types of providers for which it reported institutional rates for the sample CPT codes between March and July 2024 (see example below). There were also periodic changes in the number and names of the networks for the rates reported by Anthem between January and July 2024. Cigna also made changes in how in reported rates for a custom billing code over that period.
Changes in reporting structure may reflect changes by payers in their approach to reporting or in their understanding of the rule and instructions, or they may reflect changes in how Turquoise Health ingests and interprets the rates that are reported. On a practical level, these types of changes make it harder for data users to follow trends or check their results with data from different periods. On a broader level, they suggest that this effort should still be viewed as a work in progress, and that perhaps data users should validate important findings at several time periods if it is possible.
Using the TiC data involves navigating through a very large number of reported rates to find the ones that are mostly likely to be true. The first step involves believing that the rates that seem likely are actually revealing true information about prices, and given the large number of unlikely and questionable rates that are reported, this is not a step that all people will take. Using the data and presenting findings involves addressing the some or all of the issues and challenges discussed above, from identifying likely providers and excluding unlikely ones to dealing with multiple NPIs and multiple rates being reported for the same arrangement. Although payers have been reporting rates for over two years, it has taken time for users and others to understand the issues and problems with what is being reported, even as some of those change over time. To some extent, this effort may have been viewed as a work in progress. It may be time to review some of the underlying premises and approaches to see if the reporting requirements could be clarified in ways to produce more believable comparable results.
Appendix: Examples using the TiC in-network rates data
The TiC rule requires group health plans and health issuers to disclose, among other things, all of the in-network payment rates they negotiate with health care providers. The rule, along with the reporting guidance and schema produced by CMS, specify the information that must be disclosed with each negotiated rate. This includes information identifying the plan or insurer reporting the rate (an employer identification number, EIN, or an HIOS identifier), information identifying the provider (National Provider Identifier, NPI, and a tax identification number, TIN), the type of negotiated arrangement (fee-for-service, capitation or bundle), the type of billing code (e.g., MS-DRG, CPT, HCPCS, APC), the billing code and billing code modifiers, a description of the item or service, the billing class (i.e., institutional, professional, or both), the place of service codes (e.g., office, inpatient, outpatient, emergency room, etc.), the type of payment (e.g., negotiated dollar amount, derived dollar amount, a percentage of charges, per diem dollar amount, or fee-schedule dollar amount)[10], and an additional information field where payers can add an additional description about a rate. Rates must be reported separately for each network product. Many of these data fields will be included in the examples shown below.
As noted, this Appendix includes an extended discussion of the usefulness of the TiC data, presented through a series of examples that demonstrate some of the challenges that arise when trying to use it to analyze and compare negotiated rates. The path of the discussion follows the order in which the issues present themselves when starting with a simple comparison, which means that the most serious or difficult issues are not necessarily the first ones discussed. This order, it is hoped, unwraps the structure of the data in a clearer way and makes it easier to see how different issues interact.
The first few examples focus on negotiated rates for hospital admissions for selected MS-DRGs, representing a range of different conditions, at two hospitals in New York City: The Mount Sinai Hospital and New York-Presbyterian Weill Cornell Medical Center. The sample MS-DRGs are discussed in the methods. The two hospitals are important medical centers for two large health systems in the city and provide a good basis to compare rates. Additional examples involve more providers in the two health systems and in New York City more generally, and include rates for selected CPT codes as well as for the MS-DRGs.
The challenge of identifying rates by hospital
One of the first steps in analyzing rates at a hospital is being able to identify the rates reported for that hospital. Data users often will want to report and compare rates for an organization, such as a hospital, as well as to describe the number of organizations that are part of an analysis. In the TiC data, providers are identified by a national provider identifier (NPI) and a tax identification number (TIN) which generally are reported with each rate.[11] This is where the first complication occurs: hospitals and other institutional providers often have more than one NPI and TIN combination for the same institution at the same address for the same provider classification and specialization.
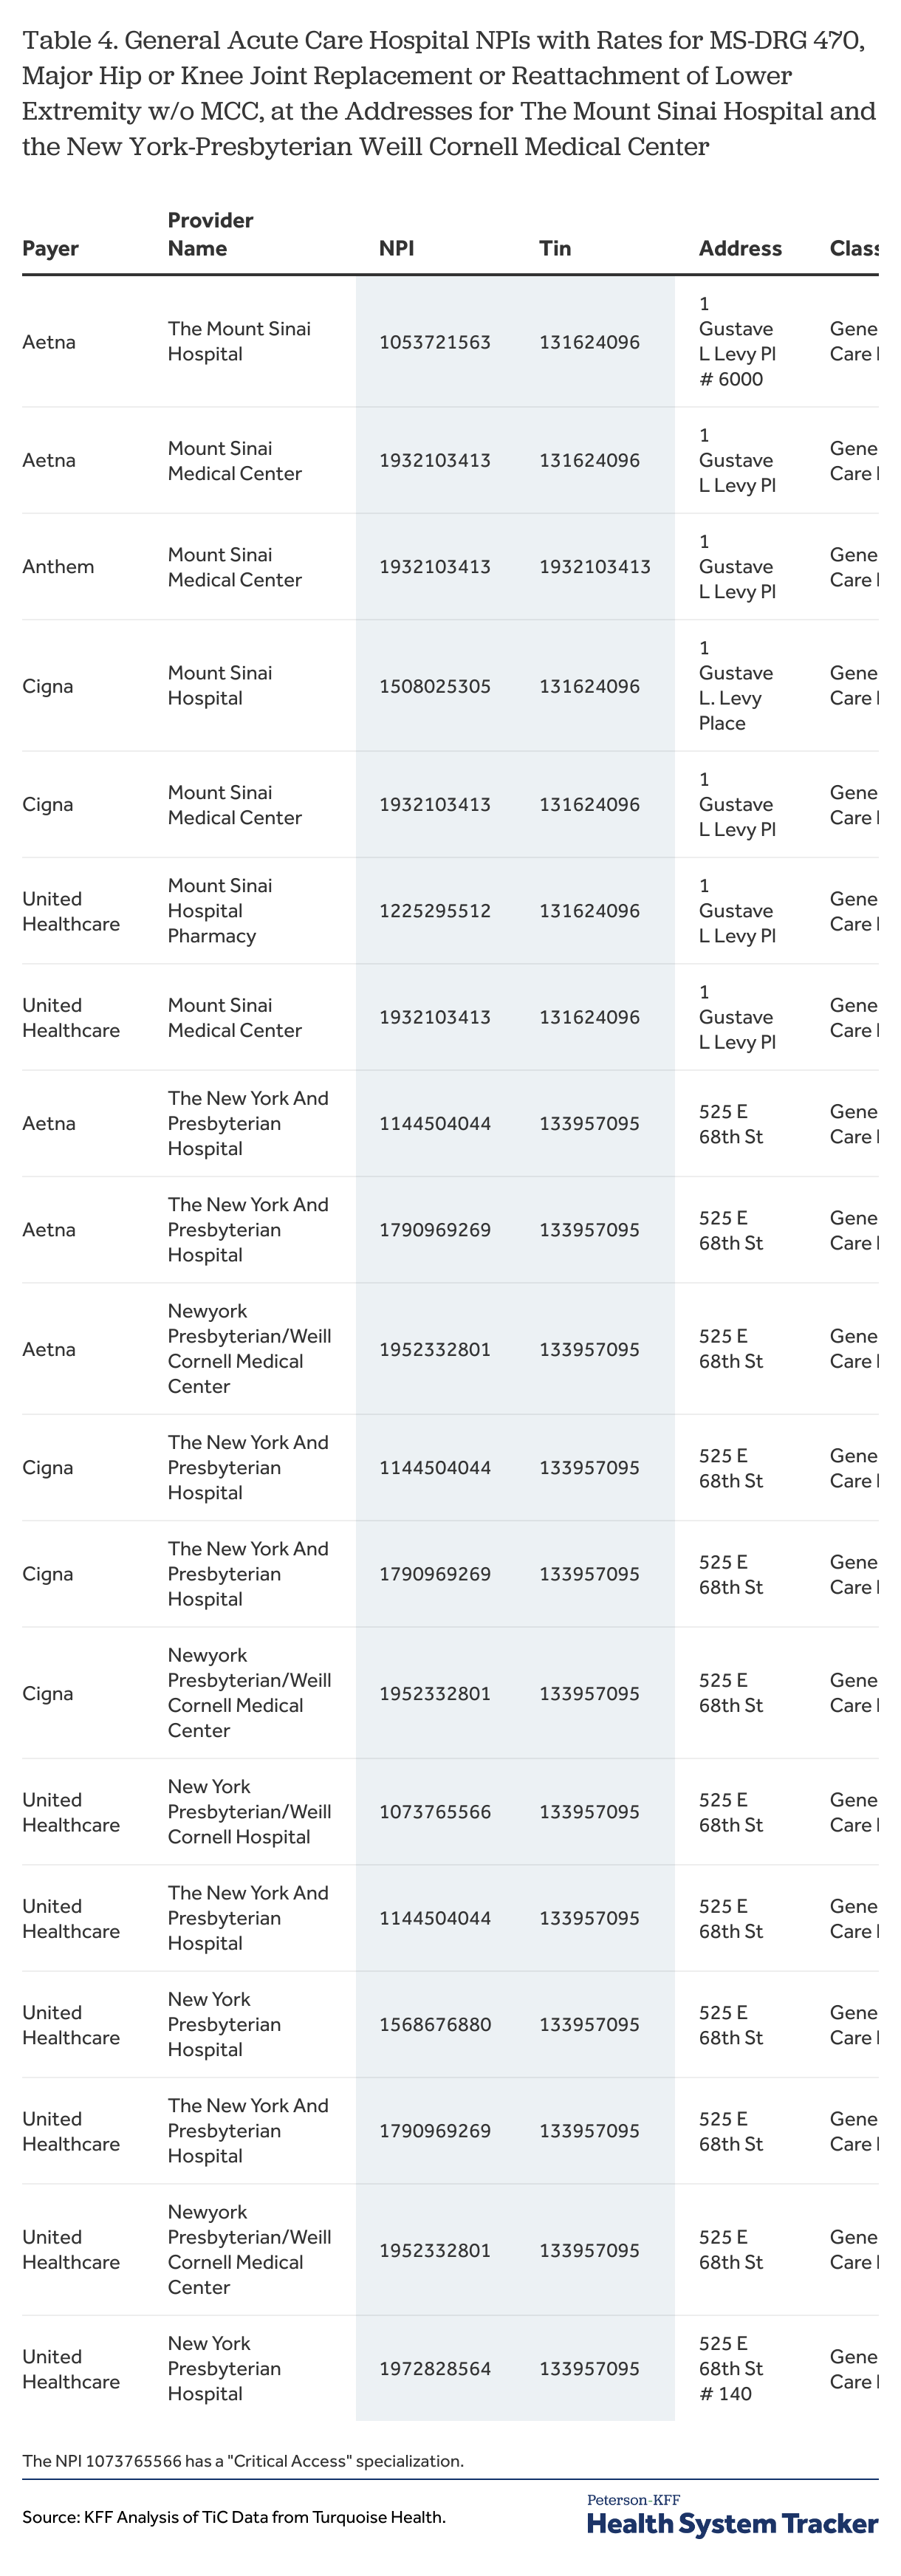
To illustrate this issue, Table 4 shows the different NPIs with rates reported by the four payers for one of the select MS-DRGs, MS-DRG 470, for New York-Presbyterian hospitals at 525 E. 68th Street, which is the address for the New York-Presbyterian Weill Cornell Medical Center, and for Mount Sinai hospitals at 1 Gustave L Levy Place, which is the address of the Mount Sinai Hospital. The organization name assigned by Turquoise Health, the TIN, the address, and the classification and specialization of the NPIs are also included in the table.
Table 4
Several challenges stand out from the table. First, the payers reported rates for this MS-DRG for four separate NPIs with a general acute care hospital classification for the Mount Sinai Hospital and six separate NPIs at the New York-Presbyterian Weill Cornell Medical Center. Second, three of the four payers reported rates for multiple NPIs at each hospital. Third, the three payers reported rates for different combinations of NPIs at each of the two hospitals (e.g., at the Mount Sinai Hospital, United Healthcare reported rates for NPIs 1225295512 and 1932103413 while Aetna reported rates for NPIs 1932103413 and 1053721563). This underlines the importance of identifying all of the NPIs for a hospital in order to ensure that all payers with rates at that hospital are included in an analysis. Fourth, the organization name in the data differs across the different NPIs at the same address, which means that the organization name field cannot be used to identify all of the rates reported for the same organization. Last, adding the TIN to the NPI does not change the situation at all; Anthem is the only payer that used a different TIN, and they only reported rates for one NPI.
An important question revolves around how to uniquely identify hospitals or other institutional providers given the multiple NPIs at the same location. The challenge is that there is no unique field or set of fields over which to aggregate information: neither the NPI alone, nor the NPI and TIN together, uniquely identifies the hospitals in Table 4. The street address is another candidate, but random additions like room numbers or differences in abbreviations (e.g., “PL” v “Place”) means that this field cannot be used as is to identify an institution. Nor is the name assigned by Turquoise Health to an NPI unique for a location. This problem may not appear difficult for analyses involving just a few institutions, where one can look at the results and fashion a rule to aggregate by hospital with string searches of the address field (which is what was done here), but this is quite a bit more complicated when dozens or even hundreds of institutions are part of the analysis.
The TiC rule, by using NPIs, inherits all of the issues that go along with using NPIs to identify providers. Providers enter information into the National Plan & Provider Enumeration System (NPPES) to conduct electronic payment transactions. They enter a name and contact information and choose an NPI type and a taxonomy (classification of provider and specialization). This information may or may not make sense to others (individual providers who are classified as hospitals) and may not be updated very often, if ever. The NPPES name may or may not reflect the name that the organization is currently doing business under, nor will all of the NPPES names at the same address necessarily be the same. In the example above, one of the NPIs at the Mount Sinai Hospital address is named Mount Sinai Hospital Pharmacy, although its classification is a general acute care hospital and the rates being reported for the sample MS-DRGs clearly not for pharmacy services. These issues are promulgated to the TiC data.
These observations raise several important sets of questions around reported rates and uniquely identifying providers which will be explored in the next few examples. First, do payers report the same rates for each of the NPIs at the same location, which raises the potential of counting the same rate multiple times; or do payers report different rates for the different NPIs at the same location, which raises the potential that rates can be missed unless all of the NPIS at a location are included. The considerations around how to count rates also can be complex, as a rate for a code might be reported for 10 or 20 networks at a hospital location, and if those networks are duplicated in several different NPIs, the number of times the same rate might be reported can become quite significant. This is discussed in a section below.
Rates vary by NPI at the same hospital for the same code and network
The previous illustration shows that payers sometimes report rates for the same code for multiple NPIs at the same hospital location. This raises the question as to whether these are always just duplicate reporting of the same rates, or whether the rates or rate patterns might vary across the different NPIs for a hospital.
Table 8 and Table 9 are examples of how the rates may vary for different NPIs reported for the same network by United Healthcare at the two hospital locations discussed above. The tables focus on one MS-DRG and one network, but the patterns generally hold across for other MS-DRGs and networks.
Table 8
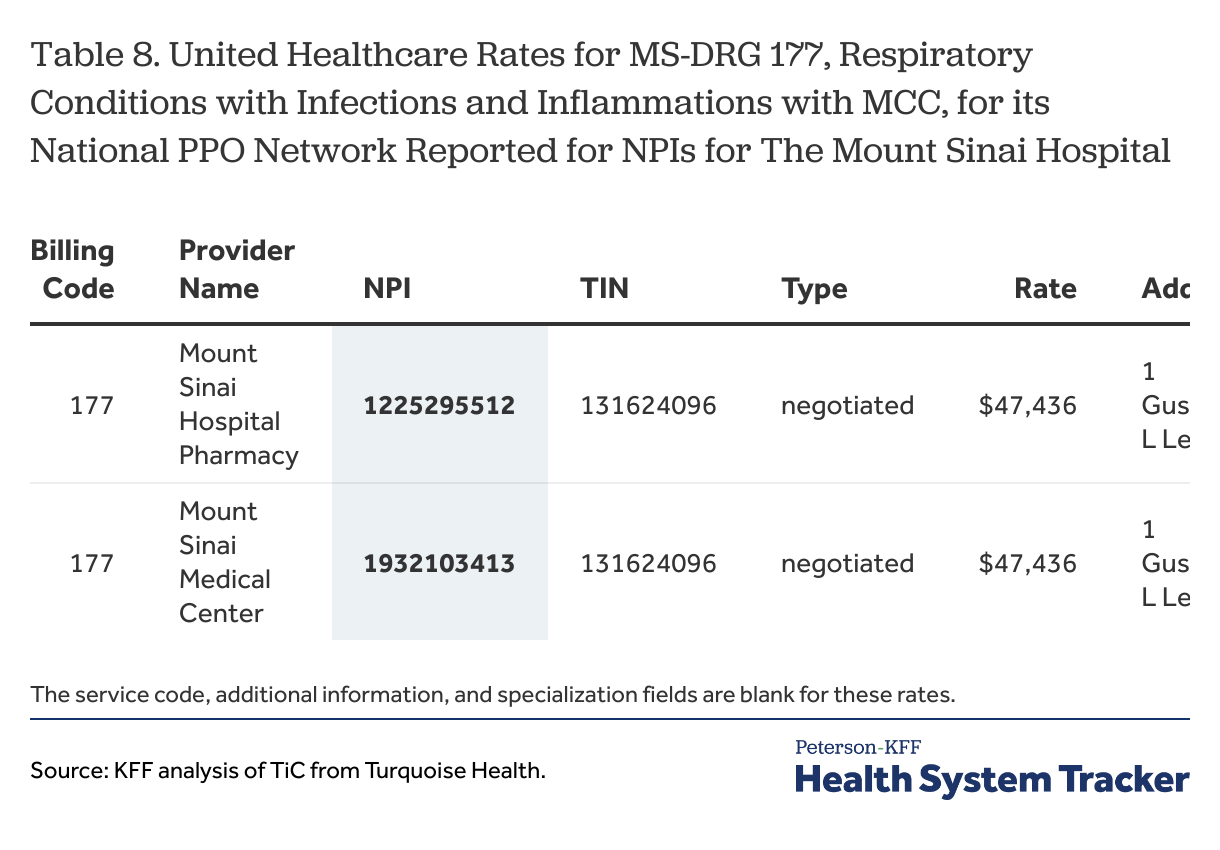
At the Mount Sinai Hospital, United Healthcare reported the same rates for its National PPO network for MS-DRG for each of the two NPIs (Table 8). The situation at the New York-Presbyterian Weill Cornell Medical Center address is quite different, however, because the pattern of reporting varied across the six NPIs. Although there were only three distinct rate values reported, they were arrayed in four distinct ways. Three of the NPIs had the same two rate values, one NPI had all three rate values, one NPI had only the one value, which as the highest rate value, and the last NPI had only one rate value, which was the second highest value.
Table 9
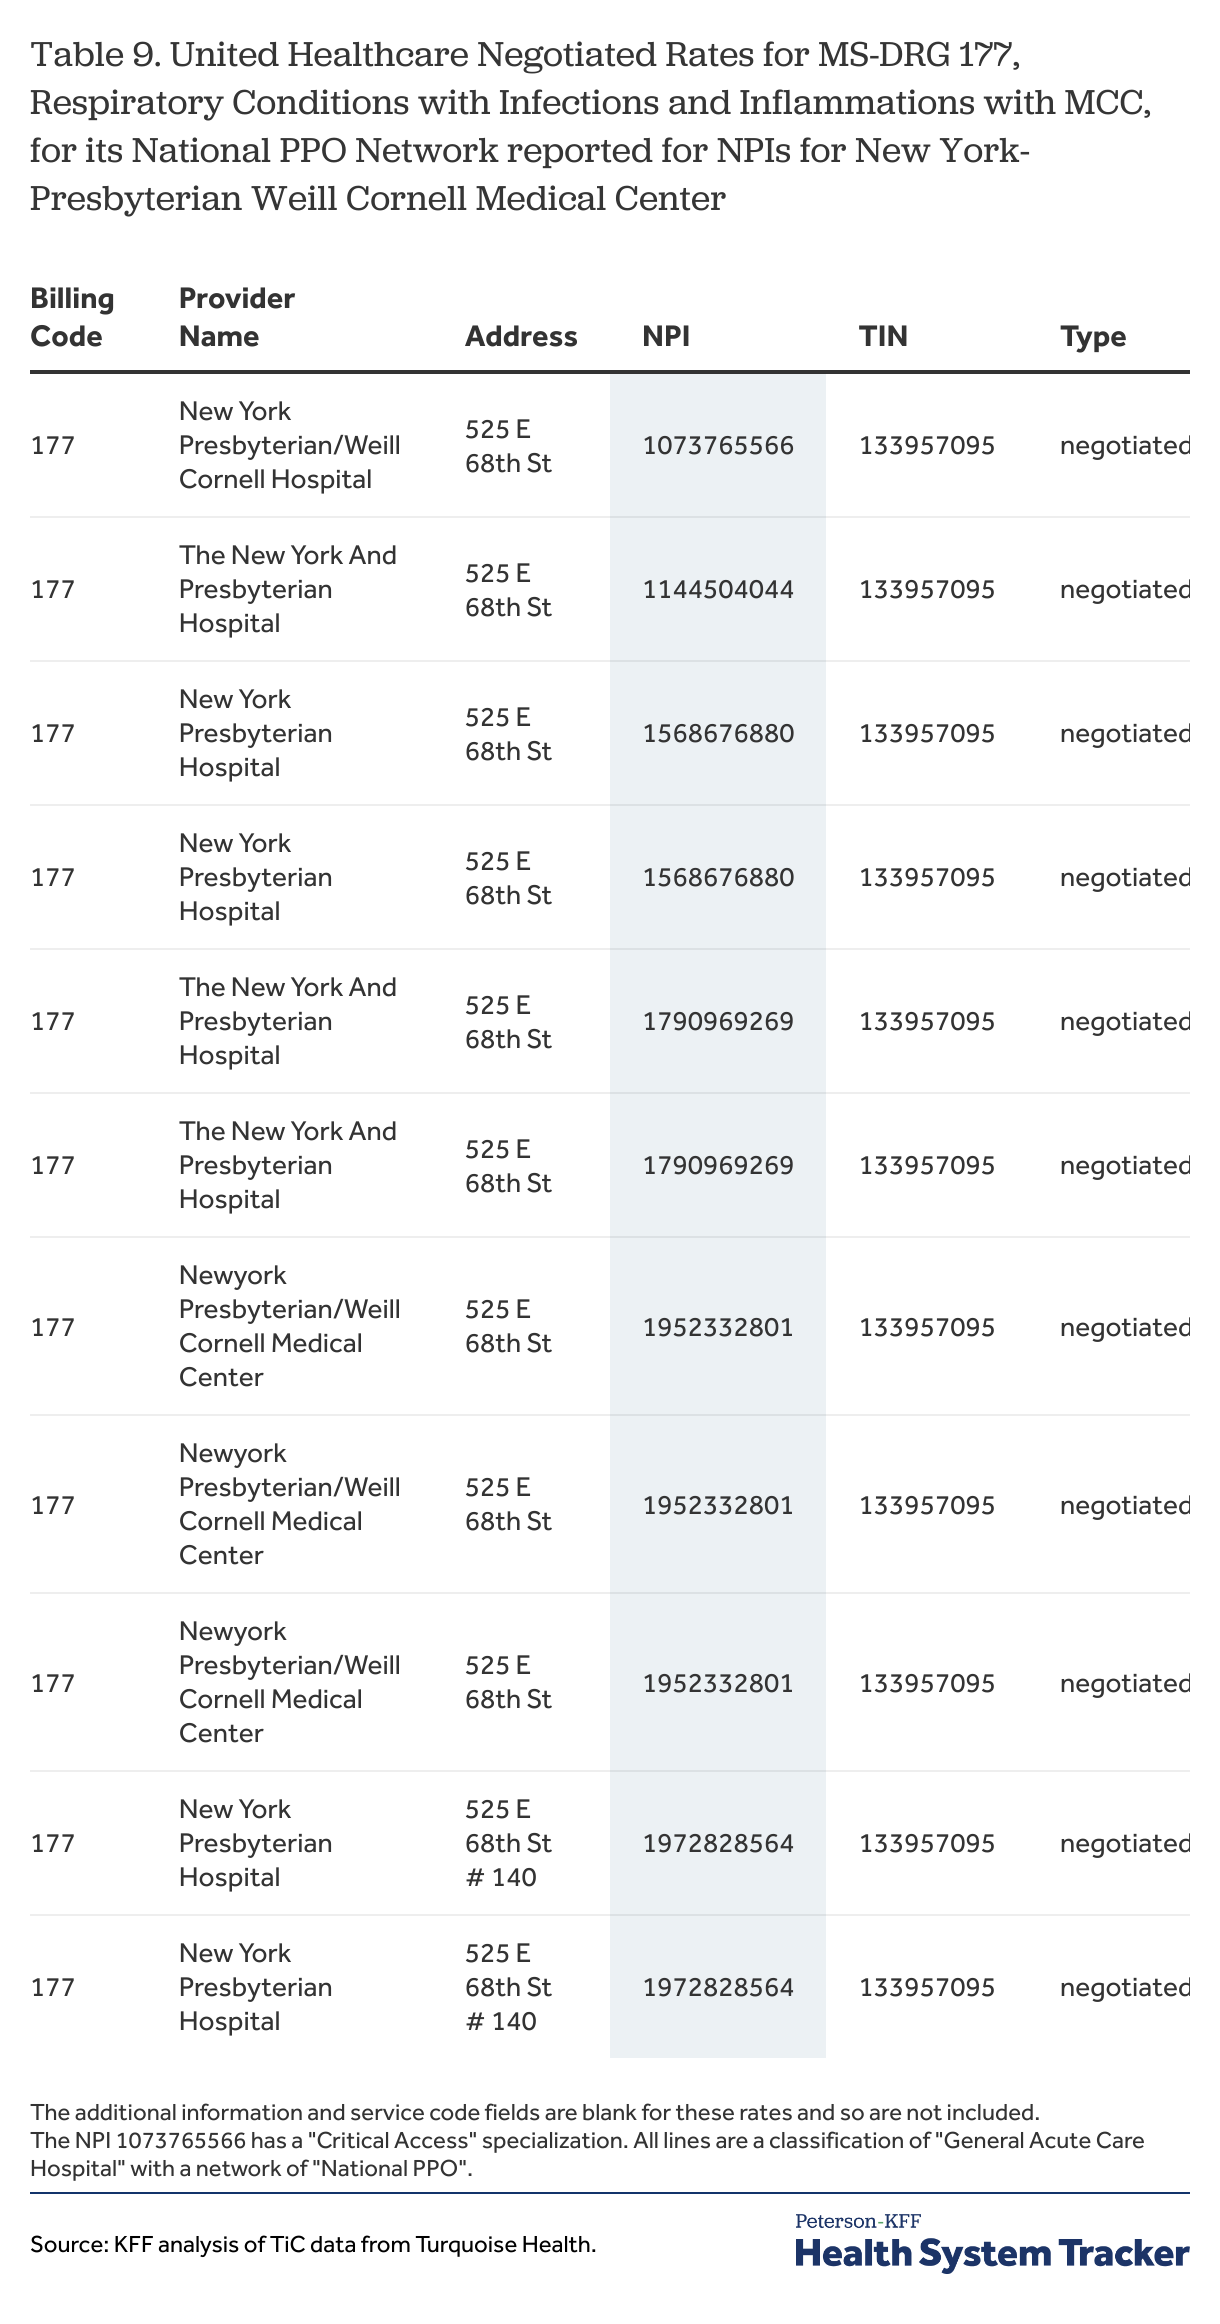
The differences in the patterns of rates reported by United Healthcare across the six NPIs at the New York-Presbyterian Weill Cornell Medical Center (Table 9) suggest that data users need to consider all of the NPIs with the correct classification when analyzing the rates for a hospital or other organization. While sometimes, and perhaps often, users could select one NPI per institution, doing so would likely mean missing rates.
Multiple negotiated rates for a code for the same network and provider
A second issue illustrated by Table 9 is that providers can report multiple rates of the same type for the same billing code for the same network. Seeing more than one rate reported by a payer for a network for a service at a hospital or other provider is a problem for data users because they often do not have any information to know when any of the rates applies. It also appears to be contrary to the TiC regulation. The preamble to the final rule indicates that payers should report only one rate for a plan (e.g. provider network) for a billing code for any unique combination of NPI, TIN and place of service code.[12] Different TINs for the same NPI may indicate a different office location or practice, while a different place of service code indicates a different practice setting or location within an institution where an item or service is delivered. As Table 9 above illustrates, however, this is not always how rates are being reported for MS-DRGs. There are several different ways that multiple negotiated rates get reported for the same billing code (and billing code modifier where applicable) for a combination of network, NPI, TIN and place of service code.[13]
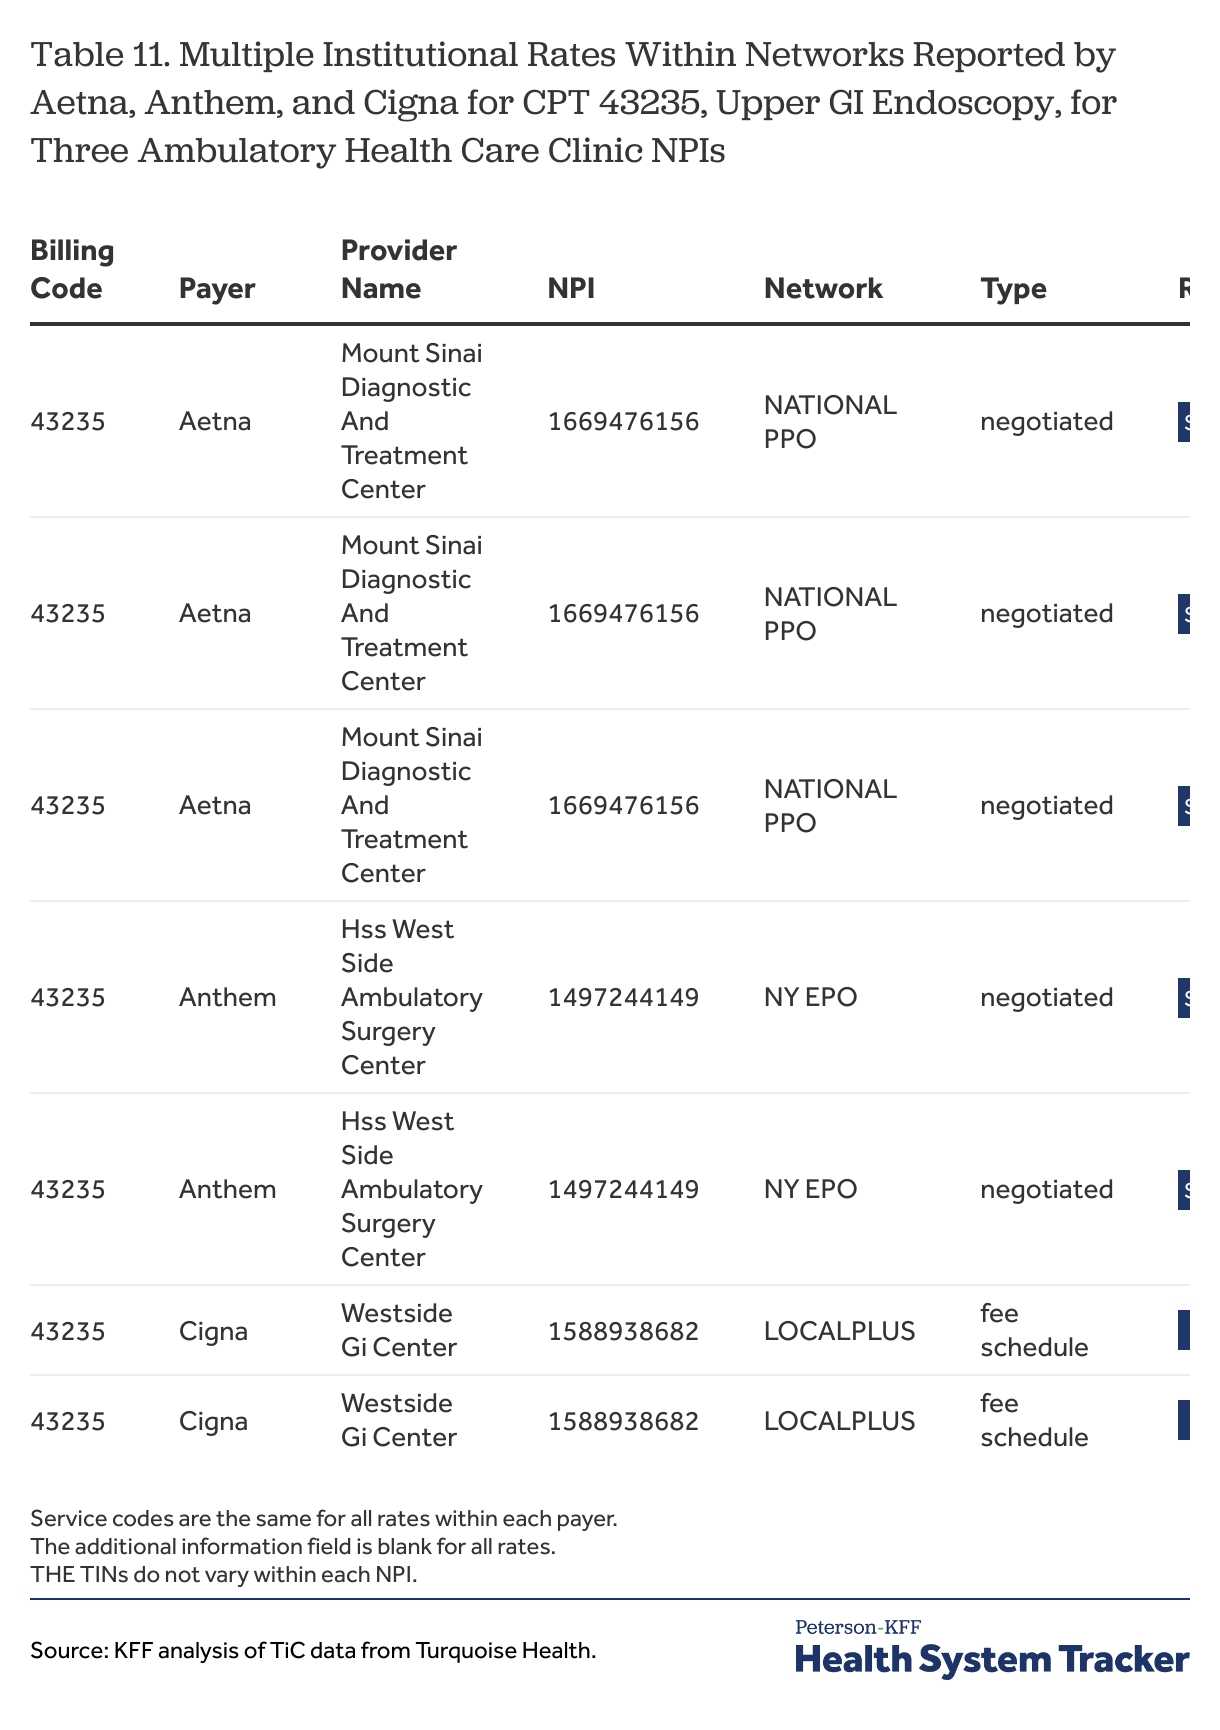
Another situation occurs when payers report more than one negotiated dollar amount (e.g., case rate) for the same code, network, NPI, TIN, when reporting rates by CPT codes. Table 10, below, shows examples where Aetna, Anthem and Cigna reported multiple negotiated institutional rates within a network for CPT 27447 for three acute care hospital MPIs. Similar examples are shown for CPT 43235 at three ambulatory health care facility NPIs. Particularly for the general acute care hospital NPIs, the alternative rate amounts are quite different, suggesting that there is an important factor or factors that would explain the differences. Unfortunately, there is no other reported information that would help data users determine which rate is the correct one for any particular circumstance. Table 28 further highlights the variety of unique rates and the spread of rates for CPT 27447 for a single NPI under several different specialties.
Table 10
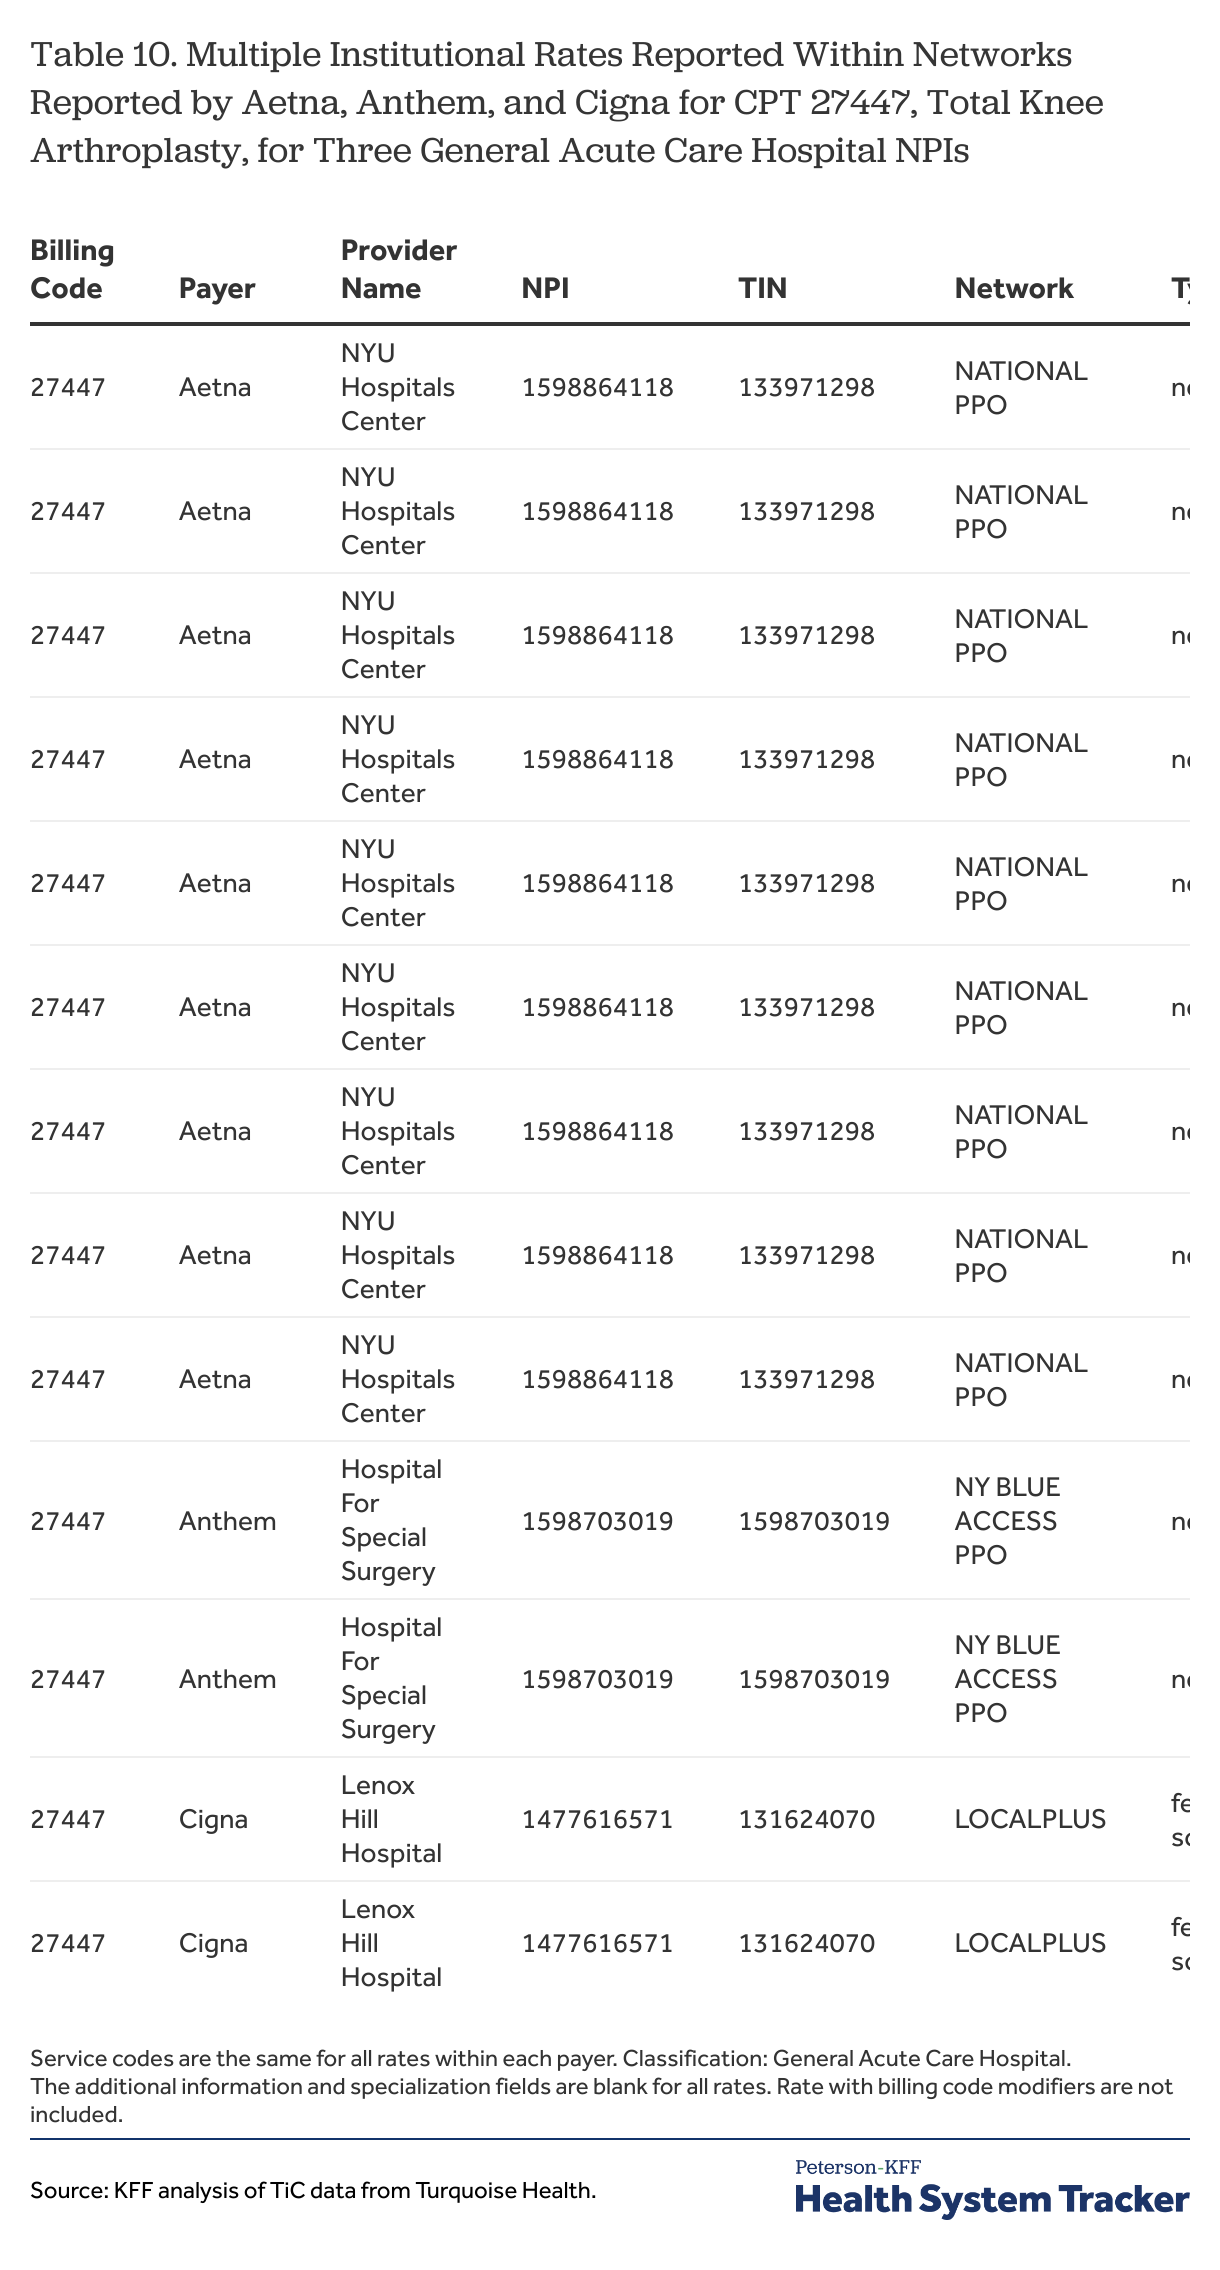
Table 11
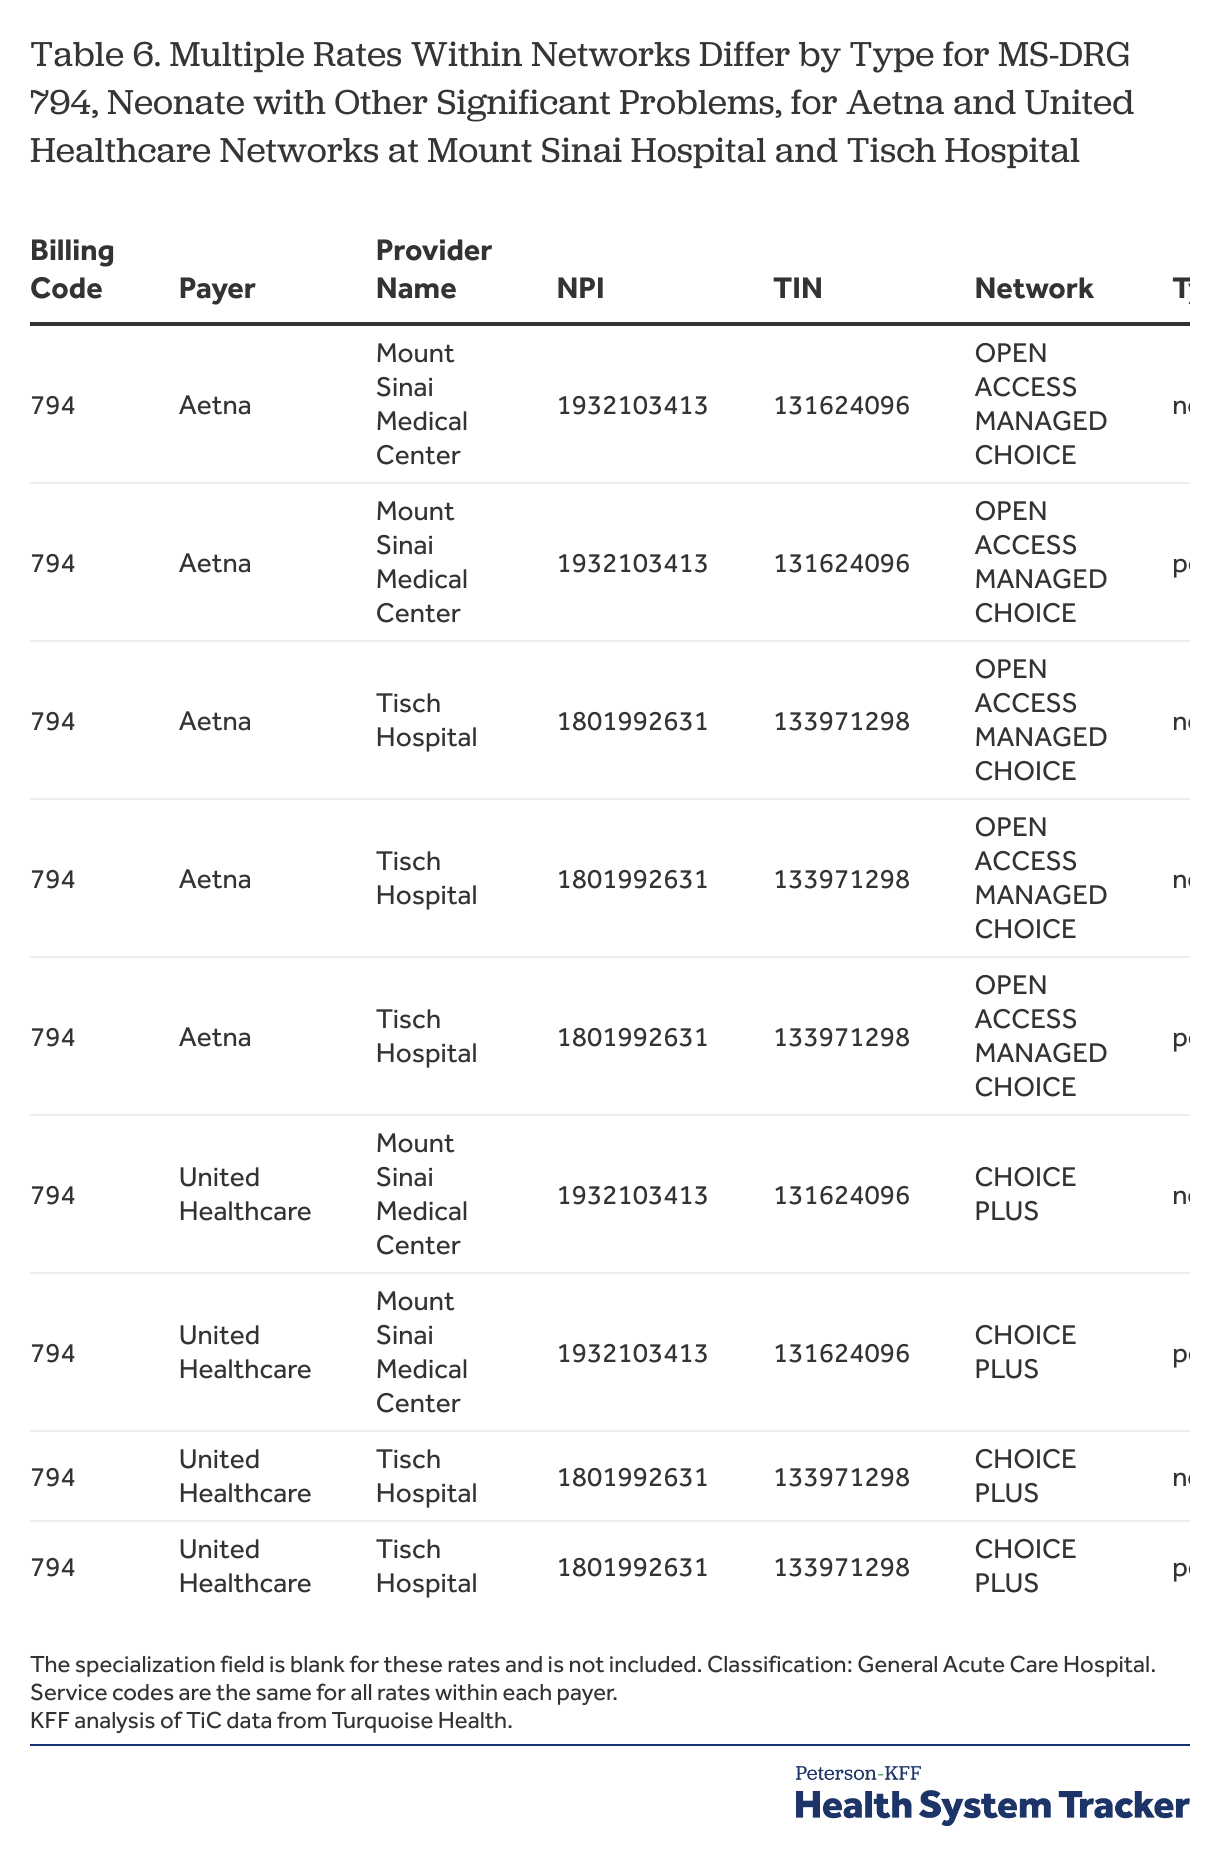
A second situation where multiple rates occur is when payers report rates of different types (e.g., case rates, per diem, or percentage rates) for the same billing code, network, provider. Examples of this are shown in Table 6.
Table 6
Both Aetna and United Healthcare each reported two different types of rates for MS-DRG 794, Neonate with Other Significant Problems, at The Mount Sinai Hospital and at Tisch Hospital, one a dollar case rate for the service and the other an amount per day of service. For the Aetna rates, there is no information to indicate when one or the other rate might apply. For the United Healthcare rates, however, there is a note in the additional information field indicating that the per diem amount applies when a revenue code between “0100” and “0219” is used. This pattern of reporting suggests that the per-diem rate or rates should be used for cases where the specified revenue codes could be used, which would include most inpatient occurrences, and that the case rate or rates should be used in other situations, although there is no way to know if this is a correct interpretation.
There are several points for data users here. One is that they may want to include the additional information field in their analyses as it might contain useful information about how a rate is used. A second is that the additional information field for one rate may indirectly say something about how another rate should be used: in this case, a user might infer that the case rates apply only in a minority of circumstances, which means that they might not be the best representation of the rates from United Healthcare for this service at these institutions. Data users that do not include all of the rate types in their analyses, at least in the initial steps of an analysis, may fail to capture this type of information.
While entries in the additional information field can help clarify how and when a rate should be used, data users unfortunately cannot rely on payers using this field with any consistency. Of the four payers looked at for this paper, only United Healthcare and Cigna appear to have entered any information into the additional information field for the sample rates in New York City. The United Healthcare entries, when they occur, qualify when rates apply by day and revenue code (e.g., days [1-7] RC[0100-0219]), which can be helpful, particularly when reported rates are quite different, but there certainly are examples where United Healthcare reports multiple rates for a code for a network and NPI without using this field. Cigna reported rates with entries in the additional information field for the sample MS-DRGs in earlier months of data (e.g., January 2024), and did so for rates reported as custom rates in the July data. These rates are all percentage rates, with the additional information entry being either “Inpatient services not otherwise priced” or “Outpatient services not otherwise priced”. Using this information would appear to be difficult because these are essentially residual categories; there is a fuller discussion of the rates reported by Cigna further below.
These multiple rate situations present analytic challenges for data users because there often is no reason to prefer one rate over another.[14] The reporting of multiple rates for what otherwise are identical situations suggests that other factors may be affecting results that are not being captured by the reporting schema. Whatever the data user does with these cases would seem to be a compromise; options include keeping all of them as valid observations, distilling the rates into an average, median or sum to represent the case, randomly selecting one of the rates, or perhaps throwing out all of rates because they do not appear to conform to the schema. These situations appear to be frequent enough that data users will need to determine how they want to address them.
Table 3
In this case, Aetna reported the $6,292 rate value for each of the five selected MS-DRGs. Overall, Aetna reported this rate for 14 of the 26 sample MS-DRGs for 28 networks for this general acute care hospital NPI at Mount Sinai Beth Israel Hospital. There are similar patterns of reporting by Aetna for many of these MS-DRGs for NPIs at other Mount Sinai hospitals.
These cases are not easy to recognize. Unless a data user is carefully reviewing the reported rates for multiple billing codes from a payer with an organization, there is little reason why they would notice it. In some instances, such as this one, where the repeating value is relatively low, it might stand out or it might even be discarded as an unreasonable value without the repeating pattern ever being noticed. But the values are not always this low: Aetna also reported the value of $12,728 as one of the rates for 12 different MS-DRGs at The Mount Sinai Hospital.
Why these repetitive rate cases occur is unclear. The repeating rate in this example almost certainly was not intended to fully pay for all of the services associated with each of the different MS-DRGs. A possible explanation is that the rate was for an ancillary service that was available to patients with the conditions described by the MS-DRG, but there is no way to know this for sure. Presumably it would be a service outside of those otherwise covered by the MS-DRG or just a portion of what would typically be provided. In this instance, Aetna also reported this rate, along with other rates, for all of the same networks for three other NPIs affiliated with the hospital: a rehabilitation unit, a psychiatric unit, and a rehabilitation, substance use disorder unit. Whether this rate value was somehow associated with one of these other units also is something that cannot be known.
These examples beg the larger question of how often payers may be reporting rates for billing codes that do not reflect the full cost of the item or service involved. Unless a payer entered some information in the description or additional information fields, there would be no way for a data user to know that a rate is not intended to reflect the full cost of the service described in the billing code. Without an understanding why this happens, it is another factor that casts doubts about the rates that are being filed.
The issue of seeing the same rates reported for multiple different units at a hospital is part of a broader issue discussed in the next section.
Providers have rates for services they do not provide
Perhaps the most common concern voiced about the TiC data is that many times rates are reported for providers for services that they do not provide. As examples, psychiatric hospitals have reported rates for heart surgeries and child-birth services, urologists have reported rates for knee arthroplasties, and audiologists and dietitians have reported rates associated with transvaginal ultrasounds. These types of rates have been referred to as “ghost” rates and they present serious challenges for data users. Turquoise Health has estimated that as much as 60 percent of the reported rates may be ghost rates.
These ghost rates manifest in several ways.
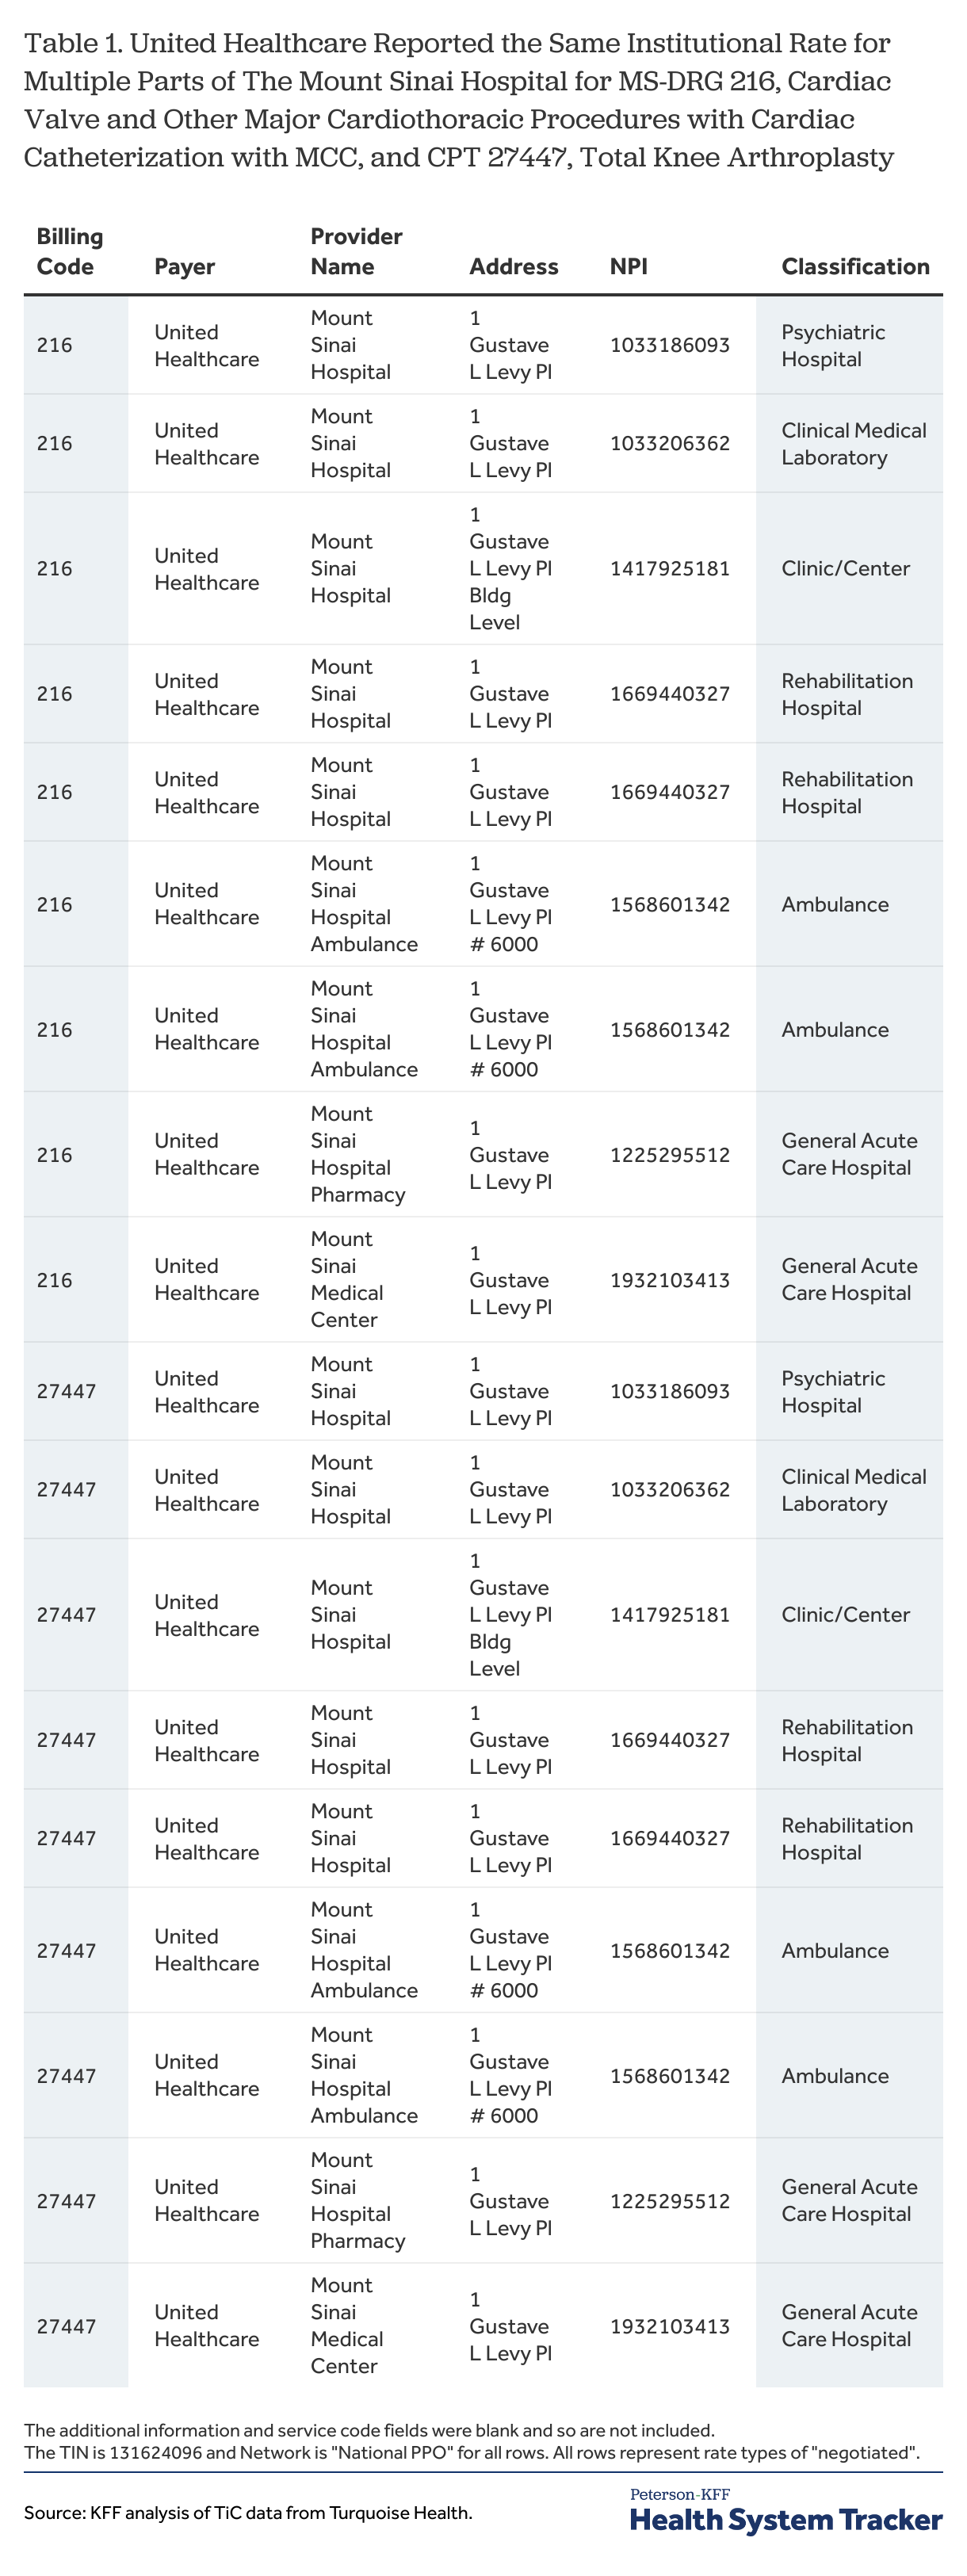
Payers report the same rate for multiple parts of an institution. One of the more apparent instances of rates being reported for providers that do not provide the service is when payers report the same rate for the same network for a code for multiple parts of the same institution. Table 1 illustrates this with rates reported by United Healthcare for MS-DRG 216 and CPT 27447 at the Mount Sinai Hospital. For MS-DRG 216, United Healthcare reported the same negotiated rate of $271,389.30 for two NPIs classified as general acute care hospitals, an NPI classified as a psychiatric hospital, an NPI classified as an end-stage renal disease clinic, an NPI classified as a rehabilitation hospital, and an NPI classified as an ambulance service at The Mount Sinai Hospital address. MS-DRG 216, which is a major cardiac procedure, would not be performed in any of those places other than the acute care hospital. And while ambulance, rehabilitation, and psychiatric services might be provided to a patient undergoing this procedure at some time during the hospitalization, the $271,389.30 rate would not be a plausible rate for those services. The rehabilitation hospital and ambulance NPIs each also had another reported rate for this code, although neither of the rates are themselves plausible as rates for these services.
The rates reported by United Healthcare for CPT 27447 follow the identical pattern, even to the extent that two rates were reported for the rehabilitation hospital and for the ambulance service. As in the MS-DRG example, a Total Knee Arthroplasty would not be performed in any of these places other than the hospital itself or in an Ambulatory Surgical Center (Table 27).
Table 1
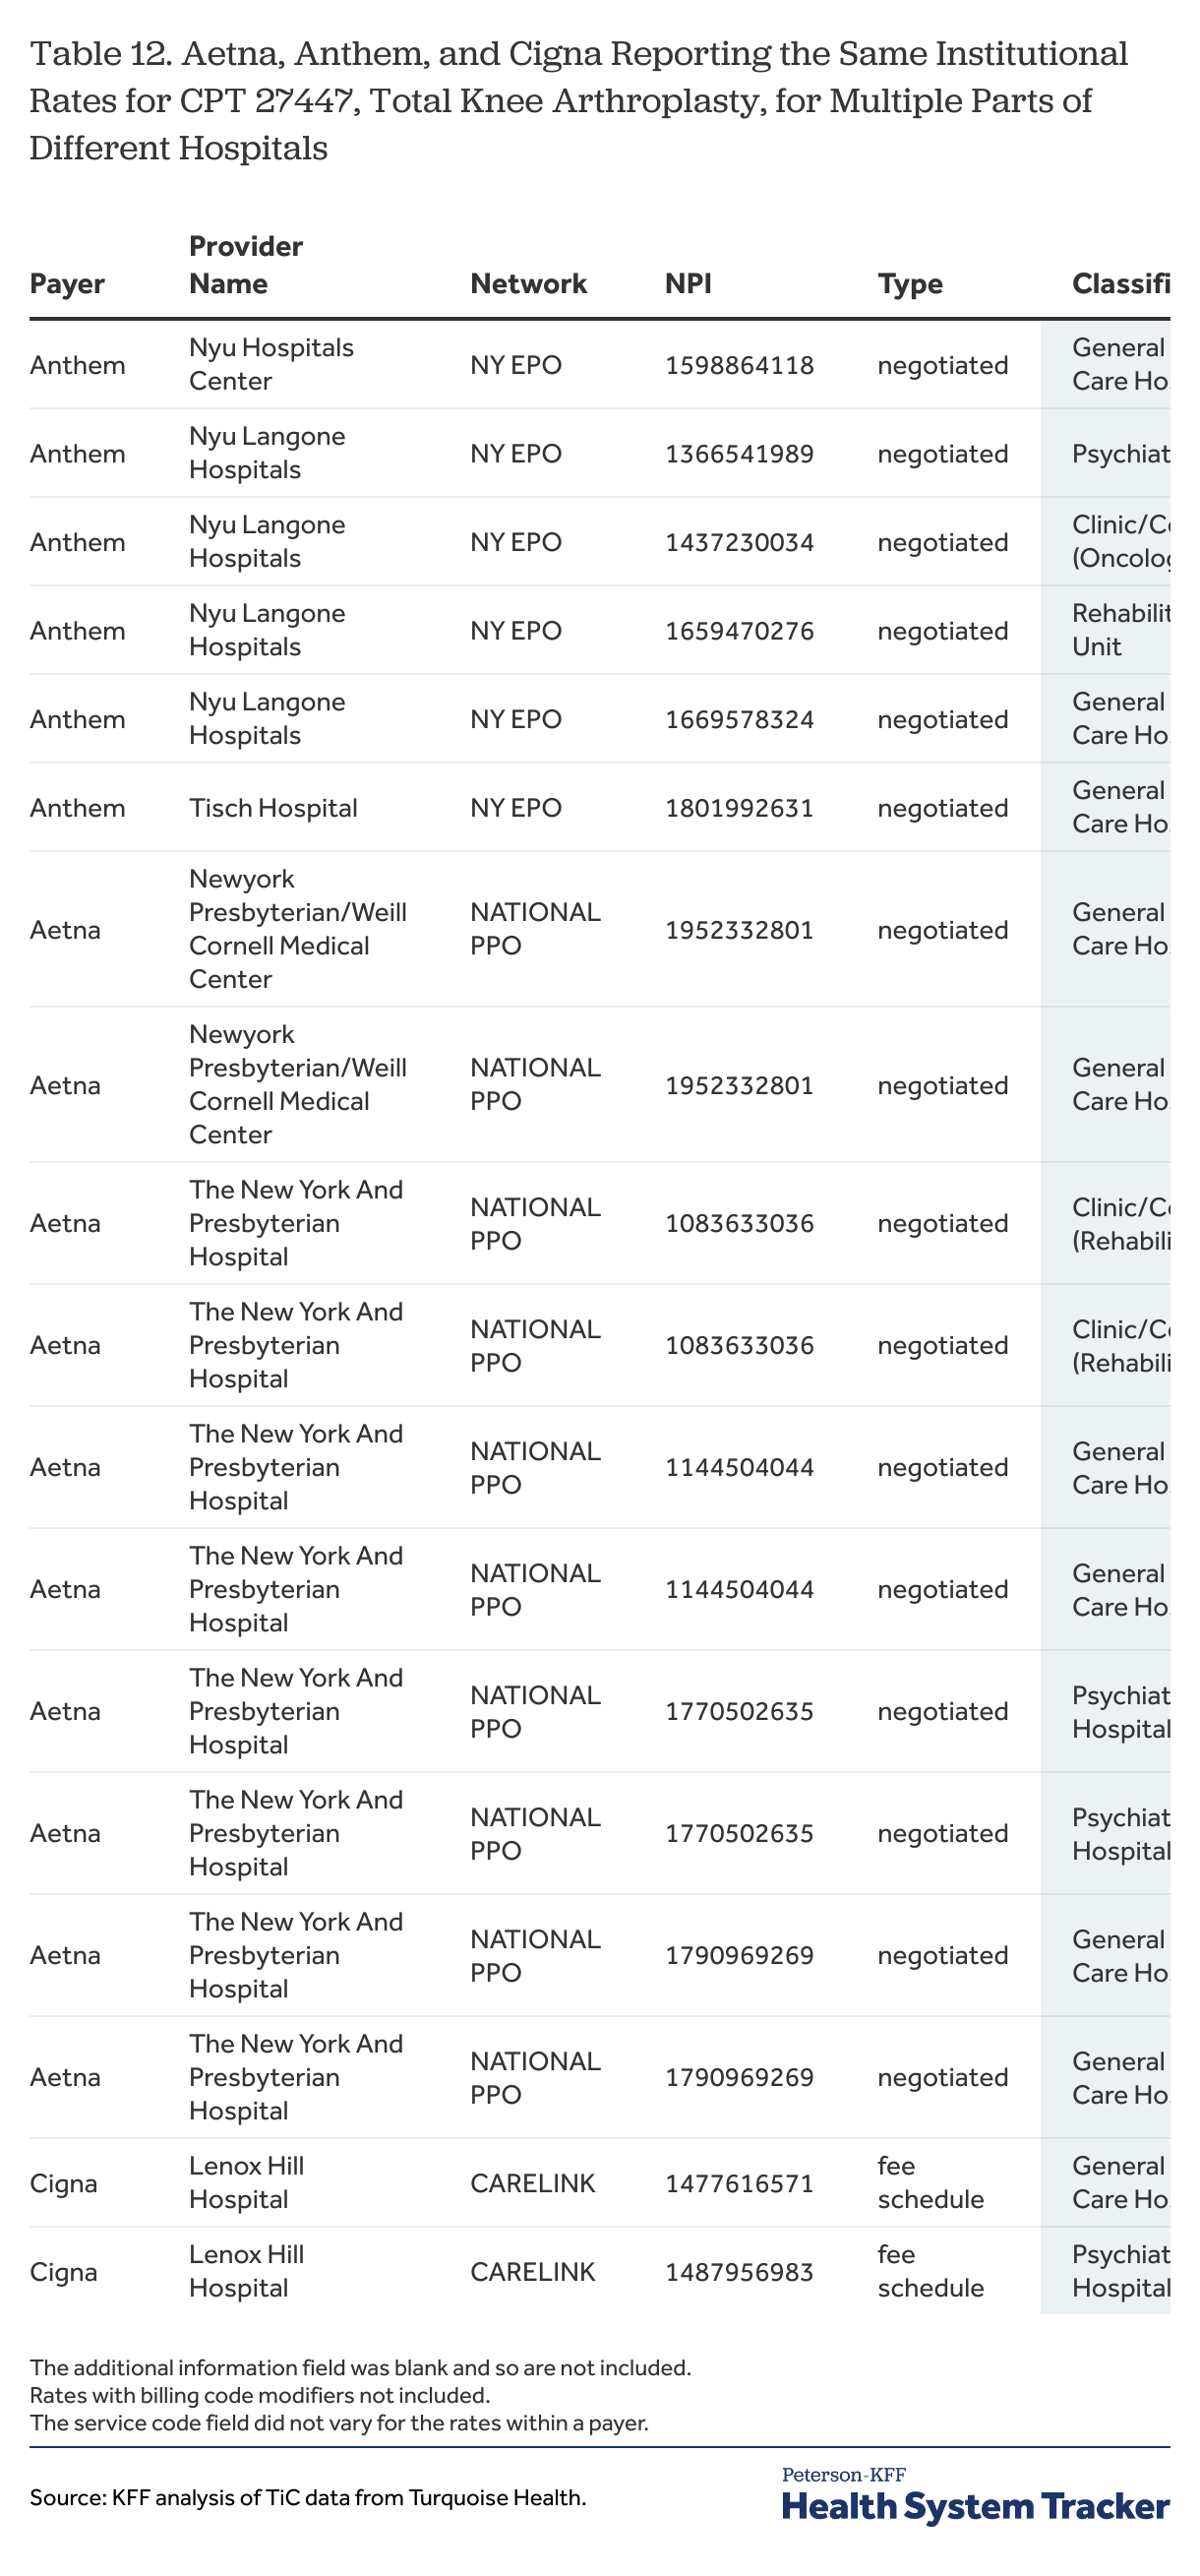
This type of result can be found for the other payers being used in these examples (Table 12). What seems to be happening is that institutional rates agreed between an institution and a payer are being reported for many of the NPIs at that institution, whether or not they are appropriate providers for the service. Both Aetna and United Healthcare, for example, reported at least one negotiated rate for each of the 26 sample MS-DRGs for the psychiatric hospital NPI at The Mount Sinai Hospital address, although only the MS-DRG for psychosis describes a service which might be treated there.
Table 12
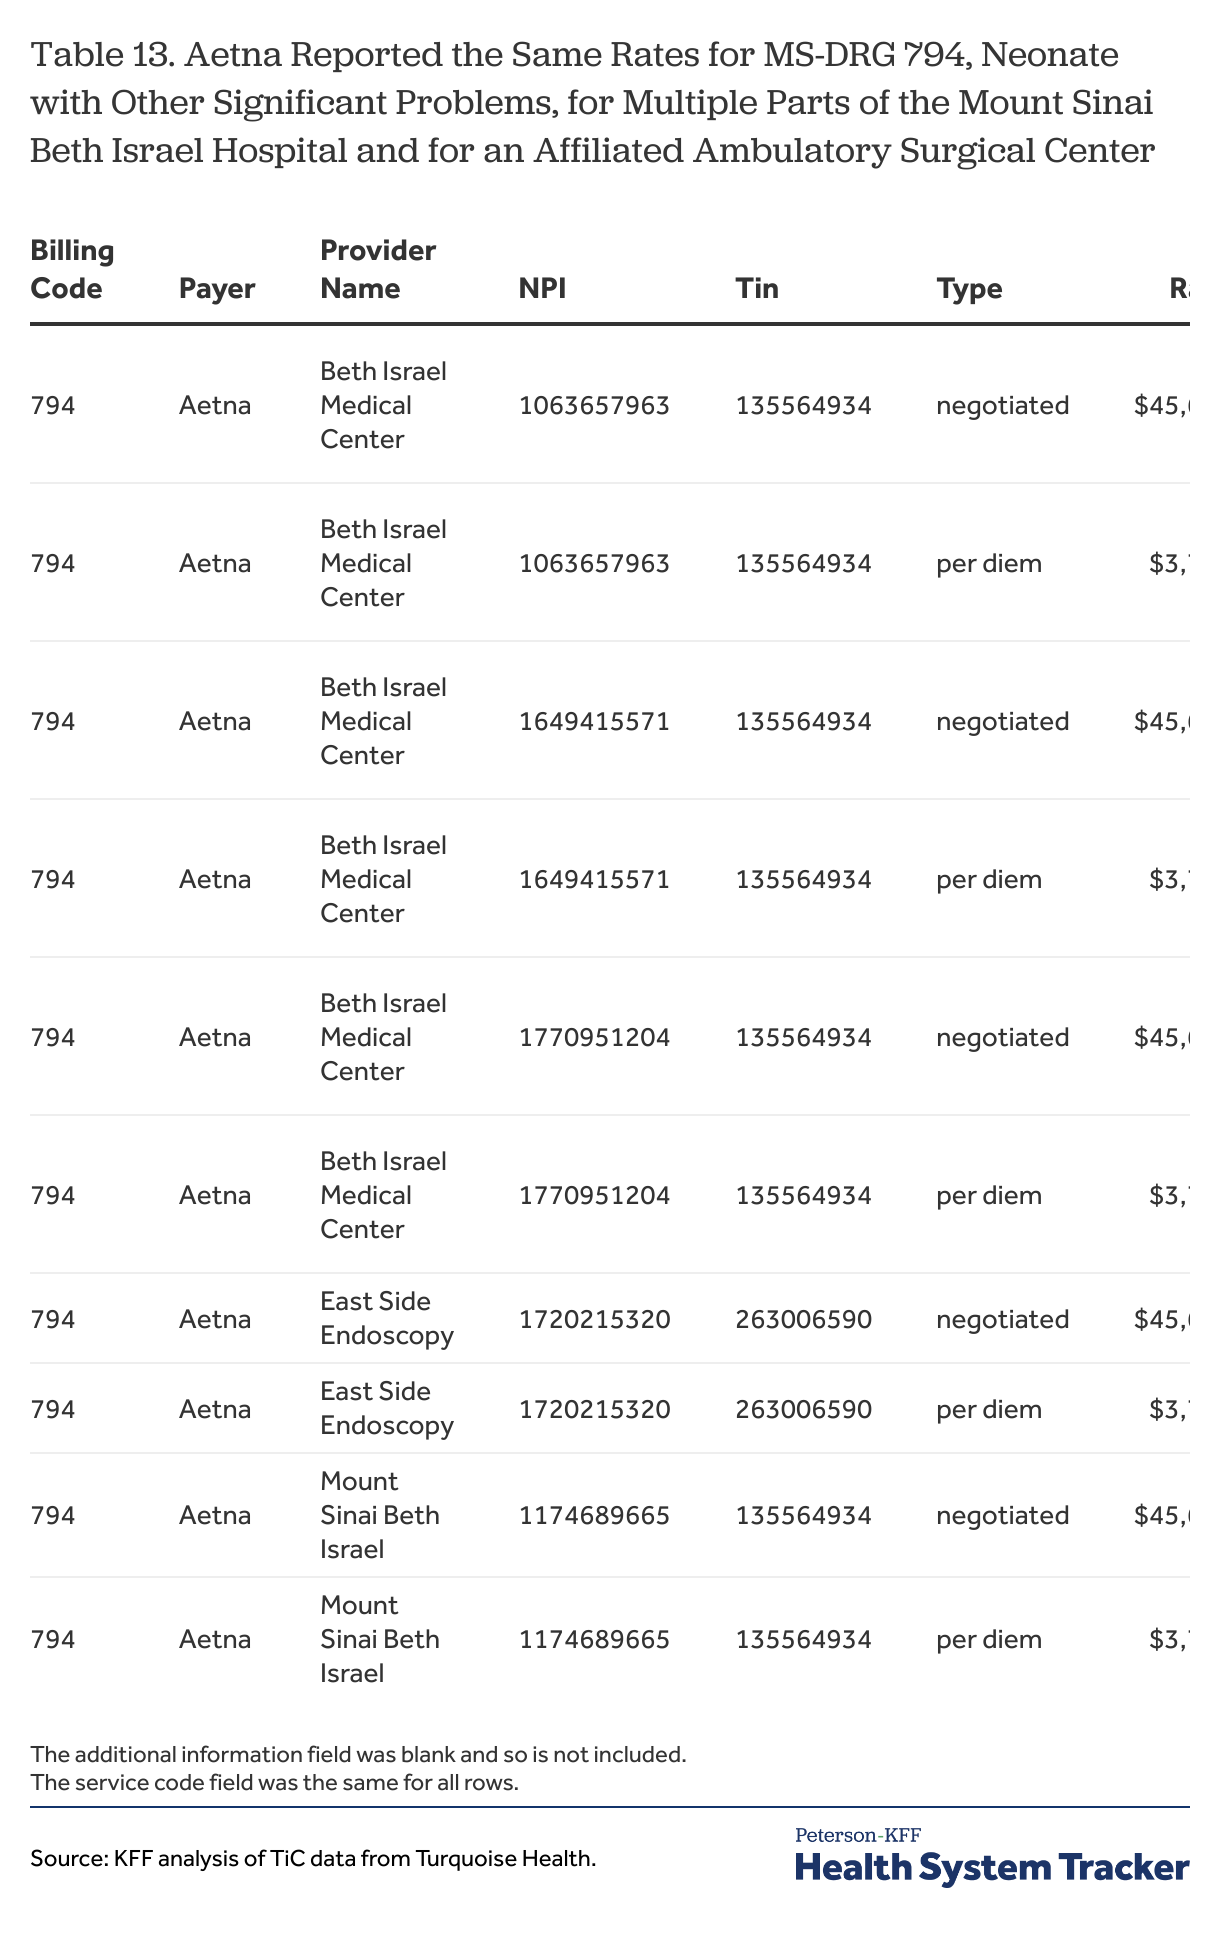
The same rates also may be reported for affiliated entities. In the example in Table 13, East Side Endoscopy, which is an ambulatory surgical center affiliated with the Mount Sinai Beth Israel Hospital, has the same rates reported by Aetna for MS-DRG 794 as the rates Aetna reports for the hospital and several of its units. MS-DRG 794 is the code for treating neonates with other significant problems; a condition that would not be treated in any of these places other than the hospital itself. Aetna reported the same negotiated rates for East Side Endoscopy and Mount Sinai Beth Israel Hospital for each of the sample MS-DRGs.
Table 13
These examples suggest several points to take away. First, at least for institutions with several parts, a negotiated institutional rate might be best thought of as a rate for the institution rather than as a rate for any particular unit or part of the institution. This idea itself poses challenges for data users as it is not clear how to identify all of the NPIs for the affiliated parts of an institution. There are variables that attempt to define health systems, but that concept can be quite broad (.e.g., all of the Mount Sinai providers) and would overreach in this case.[15] Second, accepting that the same rate is reported for a billing code across some or all of the NPIs affiliated with an institution means that a data user cannot actually associate that rate with a specific subpart of an institution, as it may not be possible to know whether that rate is specifically intended for that part of the institution or some other part.[16]
Unfortunately, even when there is more than one rate reported for a subpart of an institution, such as the second rates for the rehabilitation hospital and ambulance service in Table 13, there are no guarantees that either of the reported rates for a subpart are intentional for that subpart. In the example for MS-DRG 216, neither the $164 thousand rate for the rehabilitation hospital nor the almost $264 thousand rate for the ambulance service make any sense, and it is unclear where they come from.
Not being able to locate rates within institutions, or perhaps even across affiliated entities, is a real limitation for data users in some circumstances. For example, in the examples above, the negotiated rate for a general acute care hospital and an affiliated ambulatory surgical center was the same, which at the very least would complicate potential analyses trying to compare the relative costs of services in these two venues: questions such as whether the rate reported at the surgery center is intended for that center, or even whether the center provides all of the services it has rates for (e.g., major heart procedure at an endoscopy center) underline the problem here. The way that rates are reported for institutions seems to raise serious questions, or at least healthy skepticism, about how and when rates for hospital units or affiliated entities can actually be used in analyses specific to those units or entities.
Rates reported for numerous unlikely practitioners
Perhaps the most confusing issue encountered by data users is the wide array of practitioners with reported rates for services that they could never provide (e.g., a dentist or acupuncturist with a rate for a surgical procedure), and the confusion is compounded by the fact that the rates for such a procedure differ among those providers for reasons that are not at all clear. Table 14 shows an example. Acupuncturists and dermatologists are two of 79 classifications for practitioners (i.e., type 1 NPIs) for which United Healthcare reports rates for professional services for this procedure. The list is shown in Table 27. Similar lists can be shown for each of the four sample payers, although there are some differences in how they report these rates which will be discussed later in this section.
Table 14
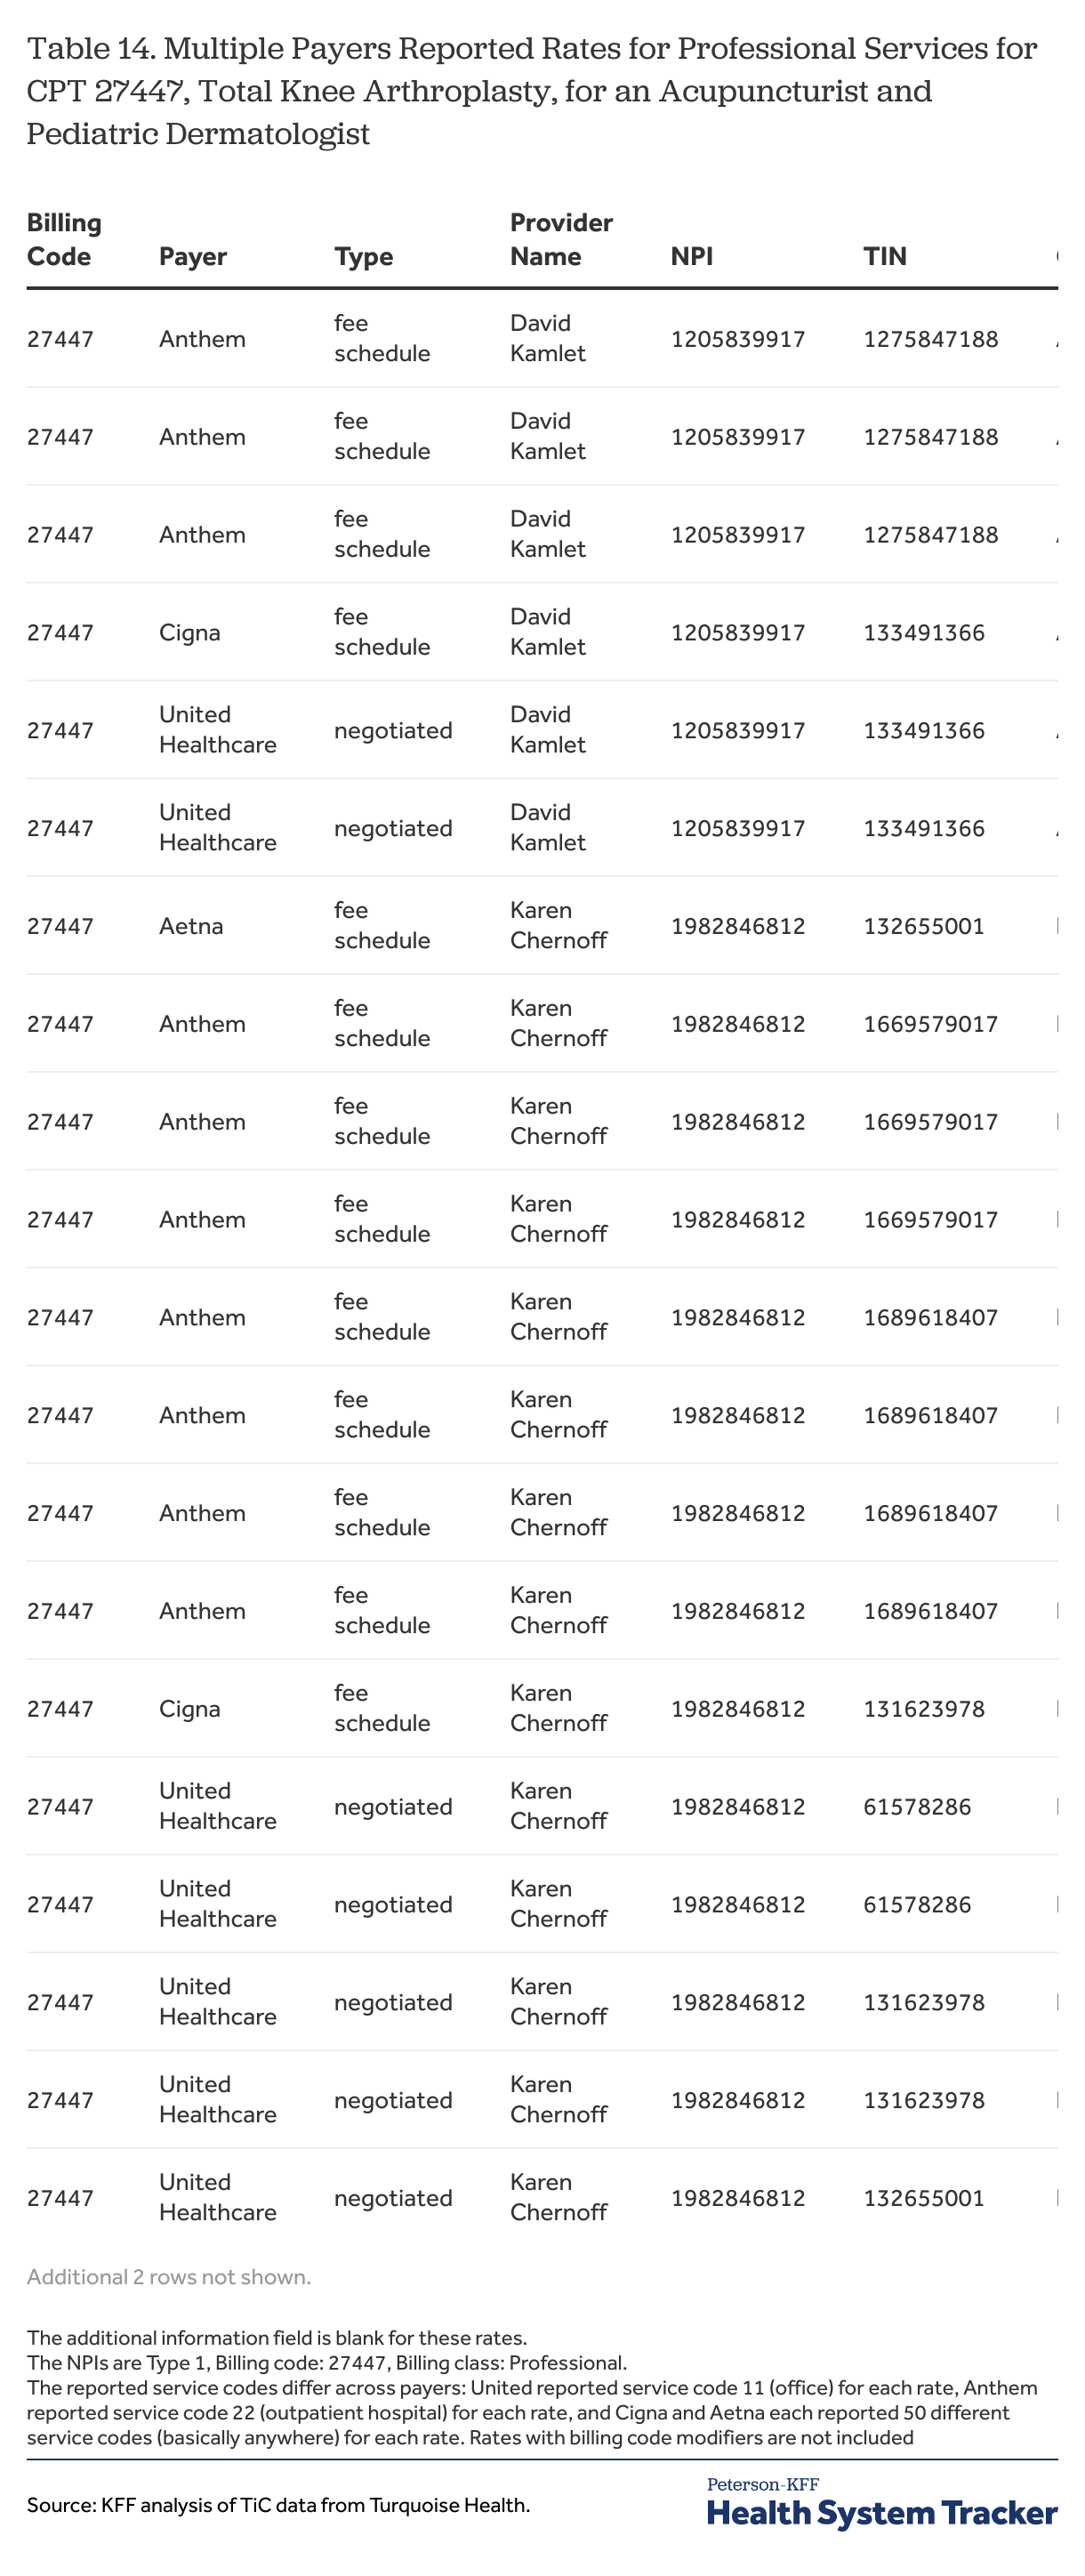
This type of reporting is not entirely different than the institutional rates just discussed; in fact, many of the practitioners with unlikely rates work for institutions or are part of practice groups that are affiliated with one. What seems different is that it is hard to see any pattern in the reporting and any reason why a particular value may be reported. In the previous section, it is fairly easy to see that the same rate is reported for an MS-DRG for a general acute care hospital NPI and for a psychiatric hospital at the same address. For the unlikely rates such as those shown in Table 14, however, there are just too many different rate values to be able to try to understand why they are there and whether they have any genesis in a rate that might be valid in another setting. It is possible that many of these rates are formulaic and reflect combinations of factors that would never in fact occur because these providers would never file a claim for the service, which would make a large share of them just nonsense.
An option for data users confronted with this sea of rates, many of which are unlikely, is to try to limit their analyses to rates reported for the types of providers that most likely might have provided the services in question – e.g., if the service of interest is an MRI, use professional rates reported for diagnostic radiologists. While this approach does not ensure that the rates that are included are ones that actually are paid, it seems more credible than including rates that can be easily mocked as being impossible. Further, given the large number of reported rates and the variety of provider types for which they can be reported, it is difficult to think of other ways to fruitfully use the rate information. Unfortunately, sifting through the large number of rates to find the more likely ones can be cumbersome and there are some considerations that can add complexity to the task.
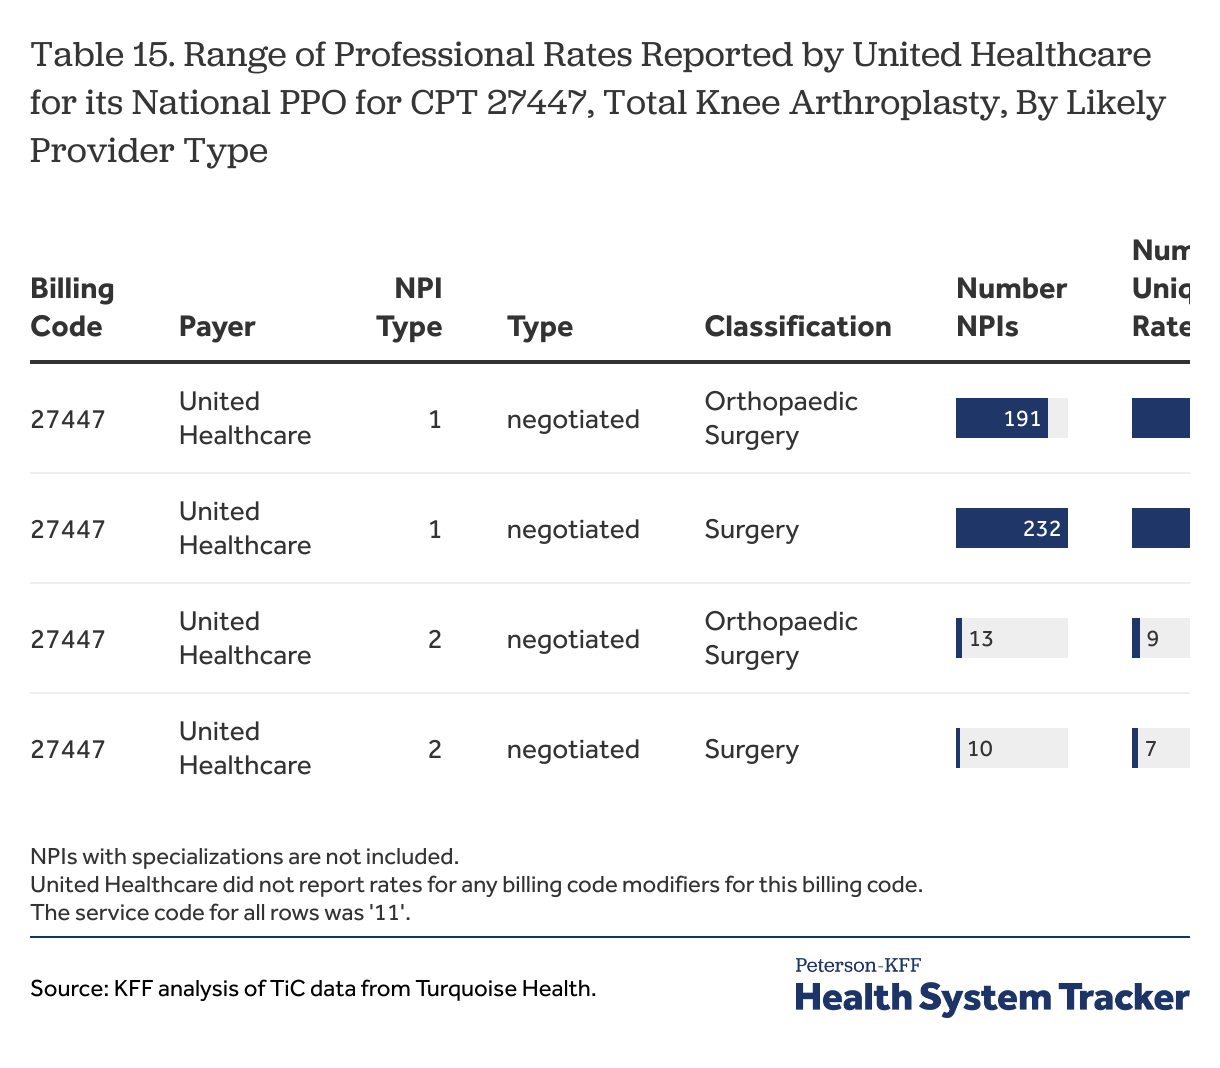
One is how finely to focus the targeting. For MS-DRGs, for example, focusing on NPIs for general acute care hospitals would seem to be pretty easy choice, although there may be times when it is appropriate to exclude certain acute care hospitals with certain specialization, such as children’s hospitals. For a billing code such as CPT 27447 (a Total Knee Arthroplasty), however, the targeting decisions seem more complex. To look at professional rates, a data user could target the rates reported for NPIs with an “orthopedic surgeon” classification, or the user could further focus on rates reported for NPIs for with an “orthopedic surgeon” classification that do not have a specialization focused on a different part of the body, such as a surgeon specializing in orthopedic surgery of the spine. Another option might be to add NPIs with a “surgeon” classification (again without specializations that do not fit), although broadening the focus to surgery more generally almost certainly dilutes the share of providers included in the analysis that actually provide the service: there are likely a greater share of general surgeons that do not perform knee replacements when compared to the share of orthopedic surgeons that do not perform this service. An example showing the rough distribution of rates reported by United Healthcare for CPT 27447 for NPIs in these two classifications (all NPIs with specializations removed) is shown in Table 15. A similar table without removing the NPIs with specializations is shown in Table 28.
Table 15
Still focusing on professional rates, data users also may want to consider whether and how to use professional rates that are reported for NPIs classified as institutional settings, such as hospitals and clinics. For example, each of the four payers reported professional rates for CPT 27447 for both Type 1 (individual practitioners) and Type 2 (organizations) NPIs classified as general acute care hospitals or as ambulatory centers or clinics. These rates may reflect amounts reported for practitioners employed by an organization or a physician practice at an organization.
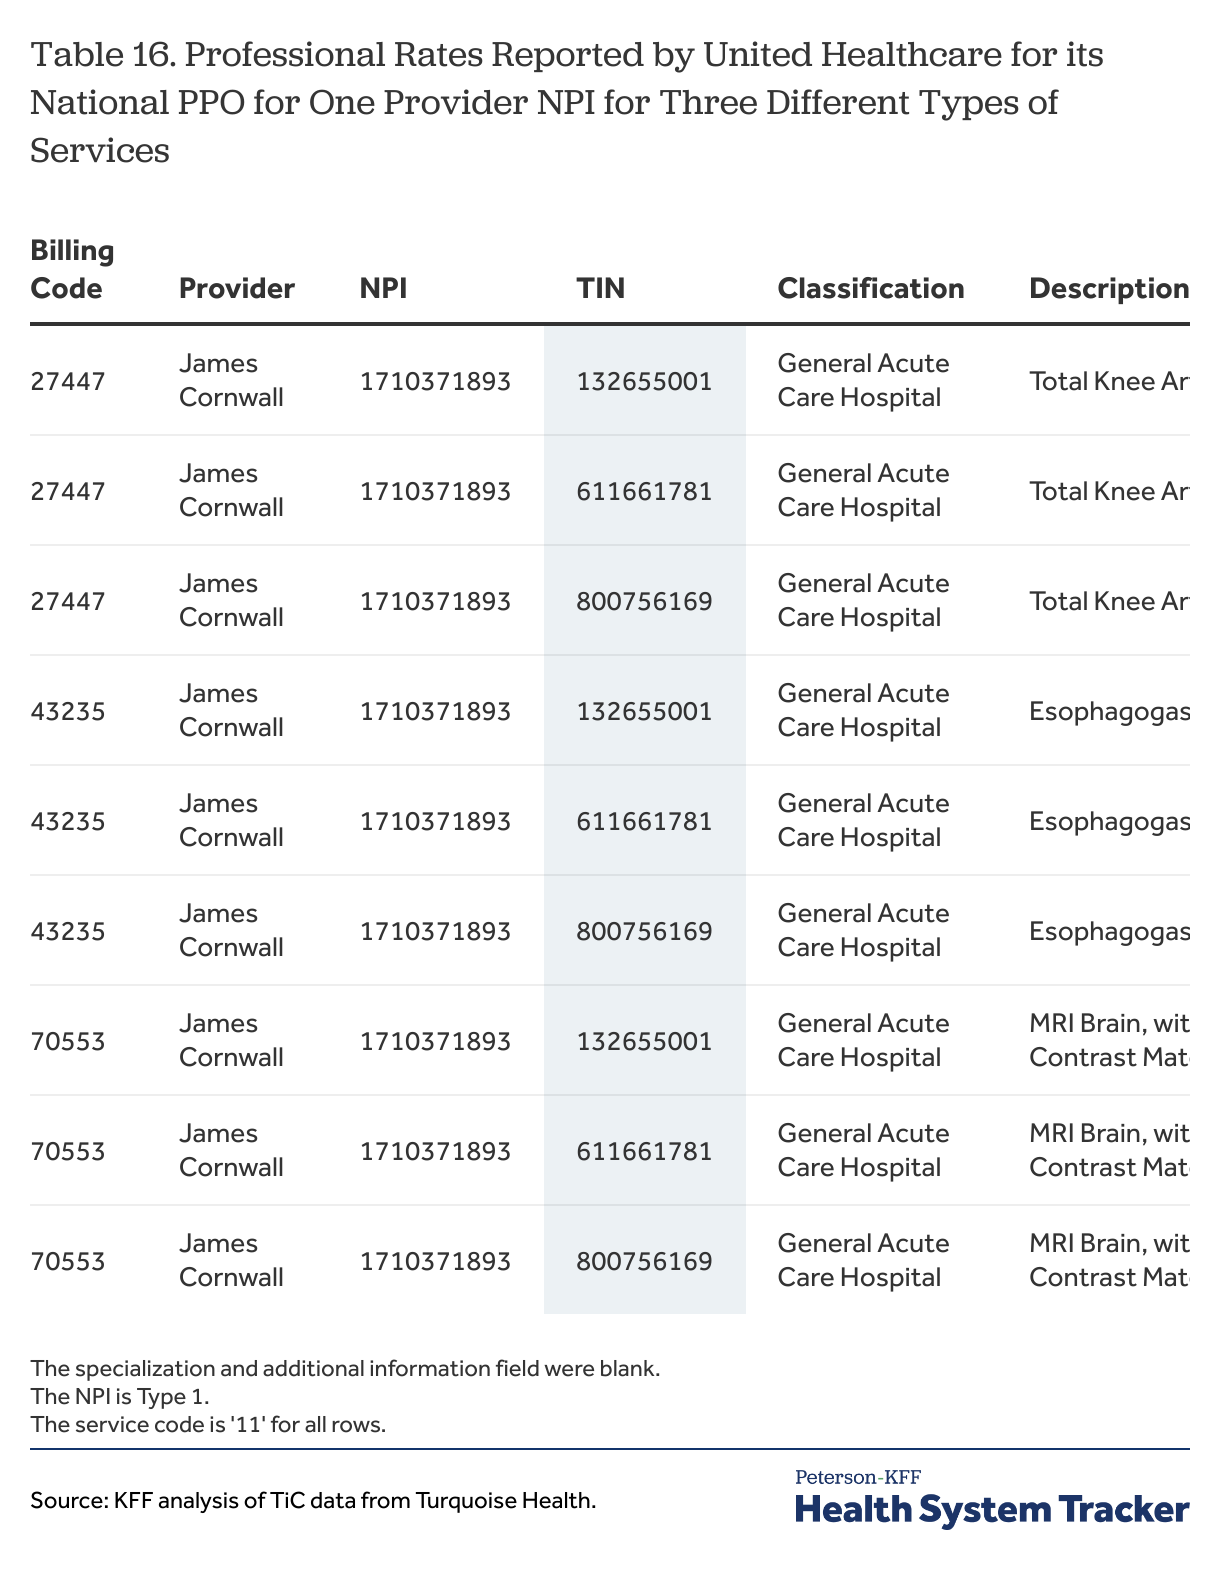
Trying to pick out the more likely rates from among these, however, can be somewhat tricky, particularly for those reported for type 1 NPIs. One of the implications of relying on NPIs is that providers choose how to classify their areas of practice and specialization, and some individual practitioners say that they are an acute care hospital or an ambulatory health care facility. It is quite possible that these individual practitioners work at an institution, and that the institution negotiates rates on their behalf, but unfortunately, because their NPIs are classified as hospitals or clinics, it is not really possible to know what their actual area of practice is. Table 16 shows an example of the issue: United Healthcare reports professional rates for three different types of services for a type 1 NPI registered to James Cornwall, MD, and classified as a general acute care hospital. The primary address for the NPI is the address of the Mount Sinai Hospital. Unfortunately, there is no additional information to suggest whether this practitioner is a likely provider of any of these three quite different types of services.
Table 16
Professional rates reported for Type 2 NPIs have less uncertainty as it is quite likely that someone at a hospital or clinic performs most common services that are available, so a professional rate reported for a service of interest for a hospital NPI would seem to be a rate that data users might want to include in an analysis. These rates may have some of the issues previously mentioned for rates reported at hospitals (e.g., rates reported for multiple hospital NPIs at the same location); the challenges with counting these rates are discussed more below.
The process for identifying likely institutional rates for a billing code like CPT 27447 is a little different in that it involves identifying the providers that are most likely to support or host the provision of the service. While payers report institutional rates for CPT 27447 for quite a few different provider types, the most likely places for this procedure to be performed would be a general acute care hospital, an ambulatory surgical center, or a specialty hospital, such as the NYU Hospital for Joint Diseases. If the focus is on institutional rates, it also would seem to make sense to focus on rates reported for Type 2 NPIs, although for this CPT code Cigna also reports institutional rates for providers with type 1 NPIs, and Aetna has done so in the past (changes in reporting over time are discussed below). Data users may want to consider whether any of the rates reported for providers with Type 1 NPIs could be valid – for example, they may be practitioners working for an institution where the procedure is performed – however sifting through these rates would add additional complexity to any analysis.
Table 17
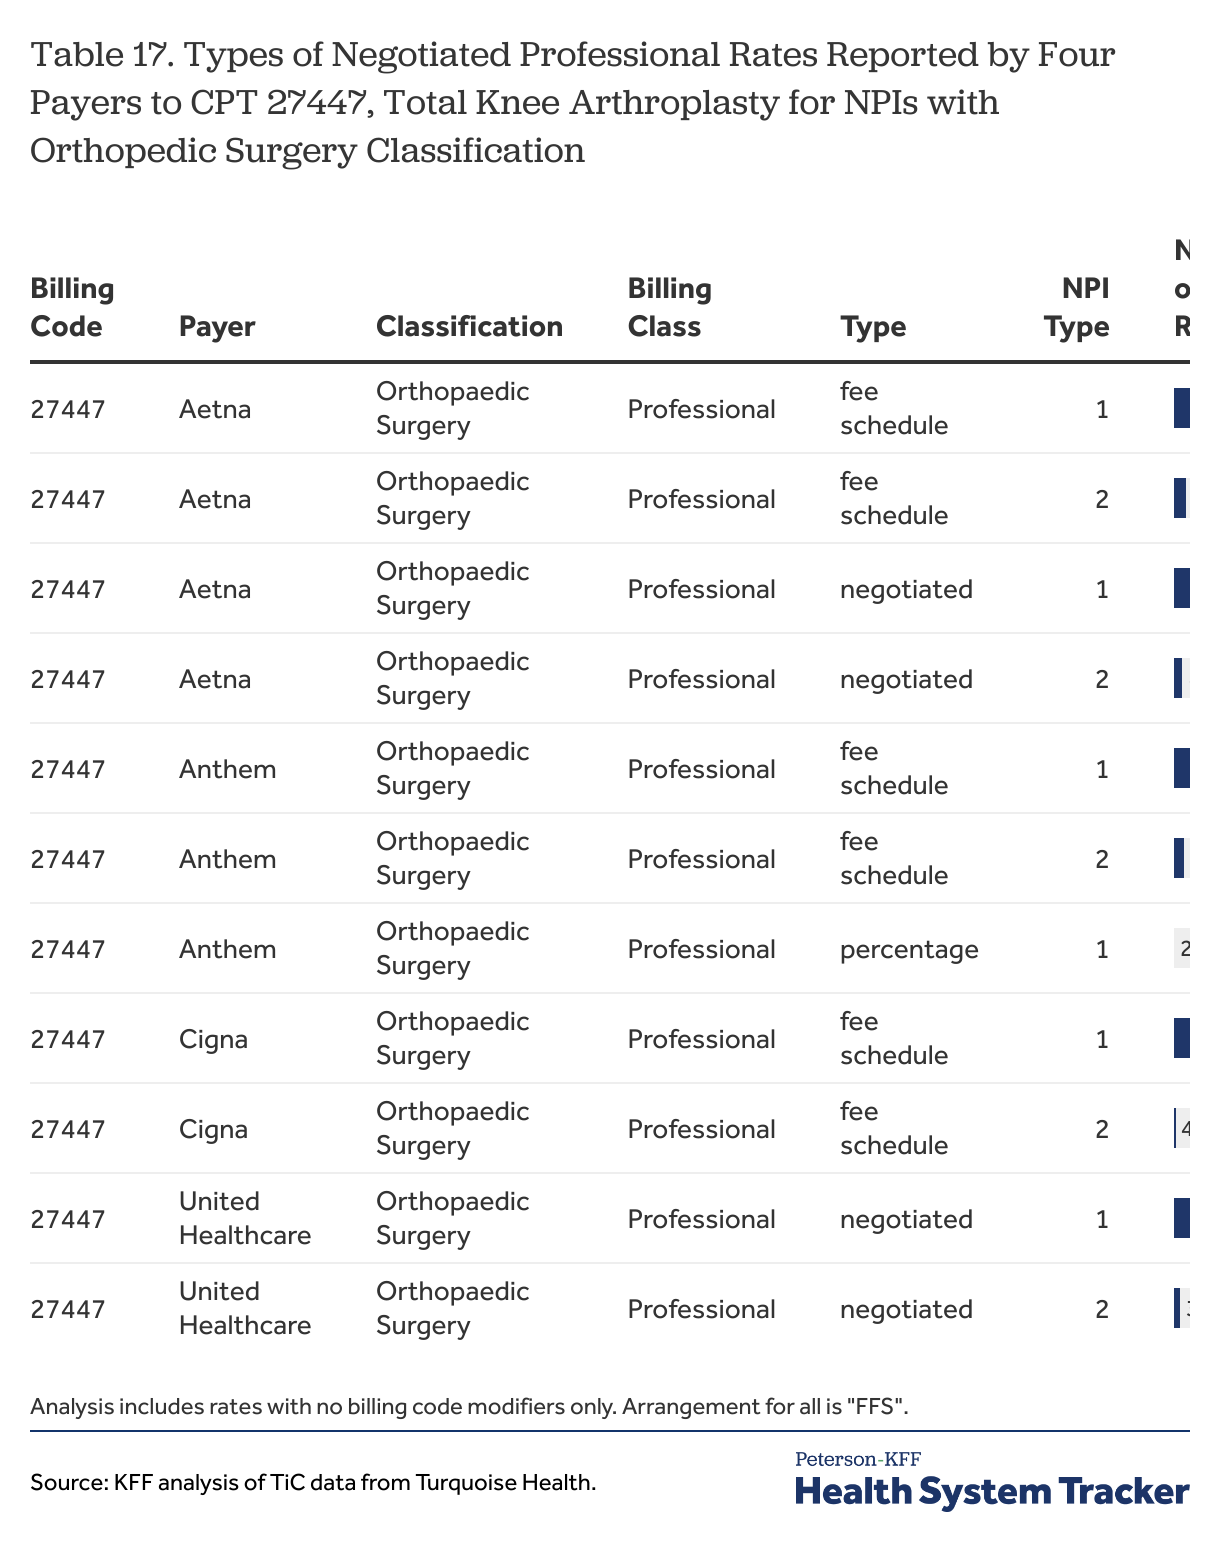
The take away point is that there can be complexity when trying to match provider types with different billing codes, and that data users that want to focus their analyses on rates for likely provider types will need to think through the different types of rates, provider classifications and specializations, as well as the differences between NPIs for individual practitioners and those for organizations. For a rather focused procedure like the CPT 27447, this may not be overly complicated, although it takes looking at the data to understand how payers are reporting rates for each procedure. For procedures that can be performed in multiple settings, this could become much more cumbersome because more provider classes and specializations might need to be considered, and doing any analysis that involves looking at multiple procedures at the same time could increase the potential complexity quite a bit.
Using the TiC data requires data users to sift through many different types of rates and providers to identify the most likely ones, but why are the unlikely rates reported in the first place? A potential answer may be found in the preamble to the final rule, which discusses negotiated rates that apply to all providers in the same network tier:
“For instance, some plans and issuers have a negotiated rate that applies to every provider in a certain network tier. In such a case, the Departments proposed to require the plan or issuer to provide the negotiated rate for a covered item or service separately for every provider that participates in that tier of the network.”
— Transparency in Coverage, Federal Register / Vol. 85, No. 219 / Thursday, November 12, 2020 / Rules and Regulations p. 72225
This might explain why so many rates are reported for providers for services that they do not provide: the rates are the potential rates for any provider in the network tier if they were to provide the service, even if they do not or even could not. Why a dentist and an ophthalmologist would have a different rate for a service they do not provide may be less clear: a possible explanation is that rates across the network are calculated in part based on factors related to the specific provider or type of provider, which might mean that some base rate for a procedure is transformed for each provider in the network tier based at least in part on provider-related factors. This is in essence how Medicare pays physicians, and many commercial payers use similar methods to reimburse physicians and other practitioners. Practically what this would mean is that the transformed rates for providers that do not provide the service are utterly meaningless, making efforts to identify likely providers necessary in order to obtain any reasonable sense of the actual prices in the market.
One concern about this explanation is that, as noted above, different payers seem to be reporting rates in different ways. For the examples here, each of the payers reports rates for many unlikely providers, but not necessarily in the same way or to the same extent. This might be due to differences in the ways that payers structure their networks and network tiers, or it may reflect differences in interpretation as to how to follow the schema. Unfortunately, payers are not required to lay out an explanation of the decisions that they made when constructing their in-network rate files, leaving data users to guess about the differences they see across payer reporting.
An important final point here is that, even with diligent efforts to focus analyses on likely providers, data users will not be able to limit analyses to providers that actually provide the service under consideration: not all orthopedic surgeons perform knee replacements, and not all ambulatory surgical centers host this type of service. On a conceptual level, this means that most analyses will be somewhat over broad in terms of rates that are included, but there are more practical implications as well. For example, those using the data for themselves or to convey results to others may want to estimate how many providers were part of a study, or may want to create summary statistics, such as average or median rates or the share of providers with rates for a service above or below a certain level. These types of estimates require defining a population of affected providers and/or payers. The closer that data users can come to identifying actual providers of a service, the better these estimates are likely to be. There is more discussion below on the topic of counting and summarizing rates and describing the providers subject to those rates.
Additional differences across payers that complicate comparisons
One of the motivations for the TiC data is to allow people to compare rates across different payers and providers for the same services. For this to occur, rates need to be reported in ways where they can be compared. There are reasons why this may not always happen, as examples: payers may use different rating approaches for some services (e.g., using per-diem rates v. case rates), payers may use formulaic approaches that use patient or provider-specific factors to create or adjust rates, payers may create unique bundles of services with combined rates, payers may create unique billing codes or arrangements, or payers may fully or partially capitate providers for some services. The reporting schema recognizes these possibilities and has provisions for payers to report rates which, while not necessarily producing rates that are comparable to rates reported by others, at least allow data users to recognize that different approaches are being used.
Other, less conspicuous, differences across payers may also complicate rate comparisons; one relates to the type of rates reported and a second relates to the types of billing codes used. There also are inconsistencies across payers in their reporting for other fields, such as billing code modifiers and service codes, which data users may need to consider.
Types of negotiated rates
The schema allows five different types of negotiated rates to be reported:
Negotiated rates are negotiated dollar amounts for items and services. If a negotiated amount is a percentage of known amount, such as a percentage of Medicare rates, then the amount must be converted to a dollar amount.
Derived rates are dollar amounts that the payer uses for internal accounting, reconciliation with providers, or submitting data for risk adjustment under the ACA.
Fee-schedule rates are dollar amounts that the payer uses to determine a participant’s cost sharing for an item or service, when that rate is different from the negotiated rate.
Percentage rates are percentage amounts representing the percentage of billed charges.
Per-diem rates are dollar amounts that are paid on a daily, per diem basis.
Under the rule and schema, payers are required to report rates negotiated with providers and, if different, the amount used to determine patient cost sharing. In arrangements where there is no rate negotiated for a service, such as in an alternative reimbursement arrangement (e.g., capitation), the payer must report a derived rate amount to the extent the it generates one through its normal course of business.[17] If the negotiated rate amount, or the derived amount when there is no negotiated rate, is different than the amount used to determine enrollee cost sharing, both amounts are required to be reported.
Table 18
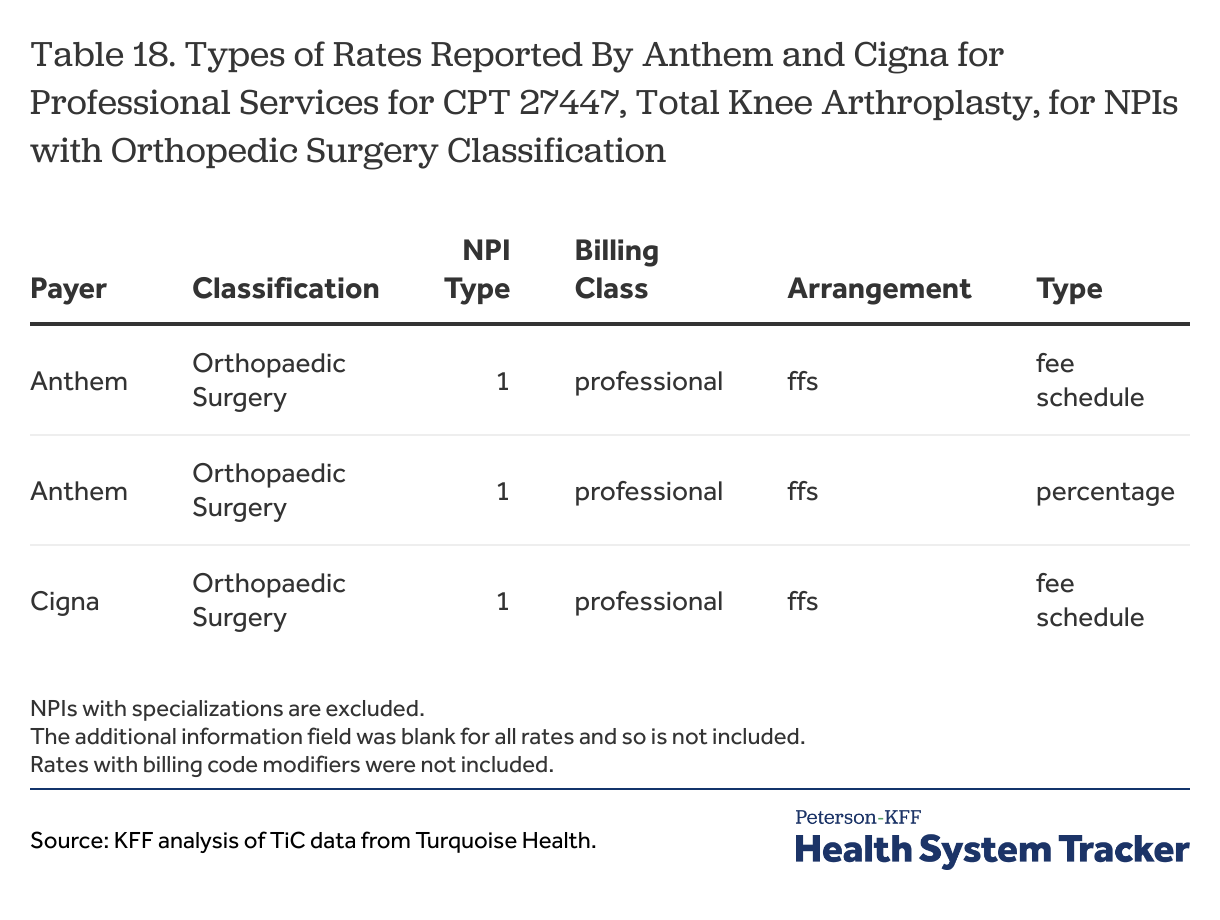
Reporting only fee schedule rates for billing codes. An issue for data users is that some payers report primarily or only fee schedule type rates for certain billing codes for certain situations. Cigna is a large payer that reports a large share of rates as fee schedule type rates: for example, all of rates reported by Cigna for all of the sample MS-DRGs in New York City were fee schedule type rates, as were virtually all of the institutional rates it reported for the sample CPT codes with organizational providers (e.g., those with a type 2 NPI).[18] Looking at an example with professional rates, all of the professional rates reported by Cigna, and virtually all of the professional rates reported by Anthem, for NPIs with an orthopedic surgery classification for CPT 27447 were reported as fee schedule type rates (Table 18). Aetna also reports only fee schedule type rates as professional rates for some NPIs for some services.
The question here for data users is why there are so many instances of payers reporting only fee schedule type rates for a service for a provider when the schema and rule suggests that there should be another rate type also reported in most situations. It seems odd that important payers such as these would not have negotiated rates, or would not create derived rates, for so many important billing codes. This essentially means that they cannot tell a provider, or their own customers, an estimated amount that they would be paid under these common billing codes. An alternative explanation is that these payers use an underlying fee schedule in their agreements with providers for these codes and, seemingly contrary to the schema, use the fee schedule type for the rates that they report. Gaining some clarification in this area would be of great benefit for those trying to use this information to compare payments rates across payers.[19]
Absent clarification, data users will need to decide whether they believe fee schedule type rates can be compared to other negotiated types, such as negotiated and derived rate types, in analyses. Not using fee schedule type rates in analyses might meaningfully limit their scope; for New York City, excluding this rate type would essentially exclude Cigna from many types of analyses and also severely limit comparisons across payers for some professional rates.
There is one additional consideration to note relating to Cigna. The following section discusses the potentially broad custom billing code arrangements reported by Cigna, and it is possible that the percentage rates reported under those custom arrangements might supply at least some of the actual rates with providers that go along with the fee schedule type rates Cigna otherwise reports. Cigna reported percentage rates for the custom billing code for all of the Orthopedic Surgery NPIs for which it reported fee schedule type rates in Table 18. There are other examples, however, where this explanation would fall short: for example, Cigna reported fee schedule type rates for the sample MS-DRGs for the general acute care NPIs at The Mount Sinai Hospital, but the percentage rates reported for the custom billing code seem to apply only to outpatient services not otherwise priced. The uncertainty here underscores the need for greater clarification as to how payers are using fee schedule type rates.
Custom billing codes. The schema has two provisions relating to custom billing codes. A custom billing code is a billing code type and indicates that the arrangement between the payer and the provider does not use one of the other billing code types (e.g., MS-DRG, CPT, HCPCS). According to the schema, the billing code type “CSTM-ALL” is used to represent all of the possible coding types under the arrangement between the payer and the provider. The billing code “CSTM-00” represents all of the possible billing codes under a billing code type. The fact that these are custom arrangements means that may not be comparable to the rates reported by other payers because the codes being used are not the same.
Of the four payers reviewed here for New York City, only United Healthcare and Cigna reported rates with custom billing codes, and the two payers used them differently. United Healthcare reported many institutional rates with the billing code type of CSTM-ALL and with unique names (e.g., Sleep Studies 1, Urgent Care, Emergency, Alternative Therapies 9) with corresponding unique billing codes (e.g., SLS, URC, EMR, ALT9). These codes appear to be alternatives for some common CPT codes; for example, United Healthcare did not report institutional rates for CPT 99281 through 99285, which are the emergency evaluation and management service codes, but it did report institutional rates for billing codes EMR, EMR1, EMR2, EMR2, EMR4, EMR5 with descriptions such as “Emergency” and “Emergency Room Level – 1”. As previously noted, United reported institutional rates for only 11 of the of the 40 sample CPT codes, compared to 38 for Aetna and 40 for Cigna and Anthem.[20]
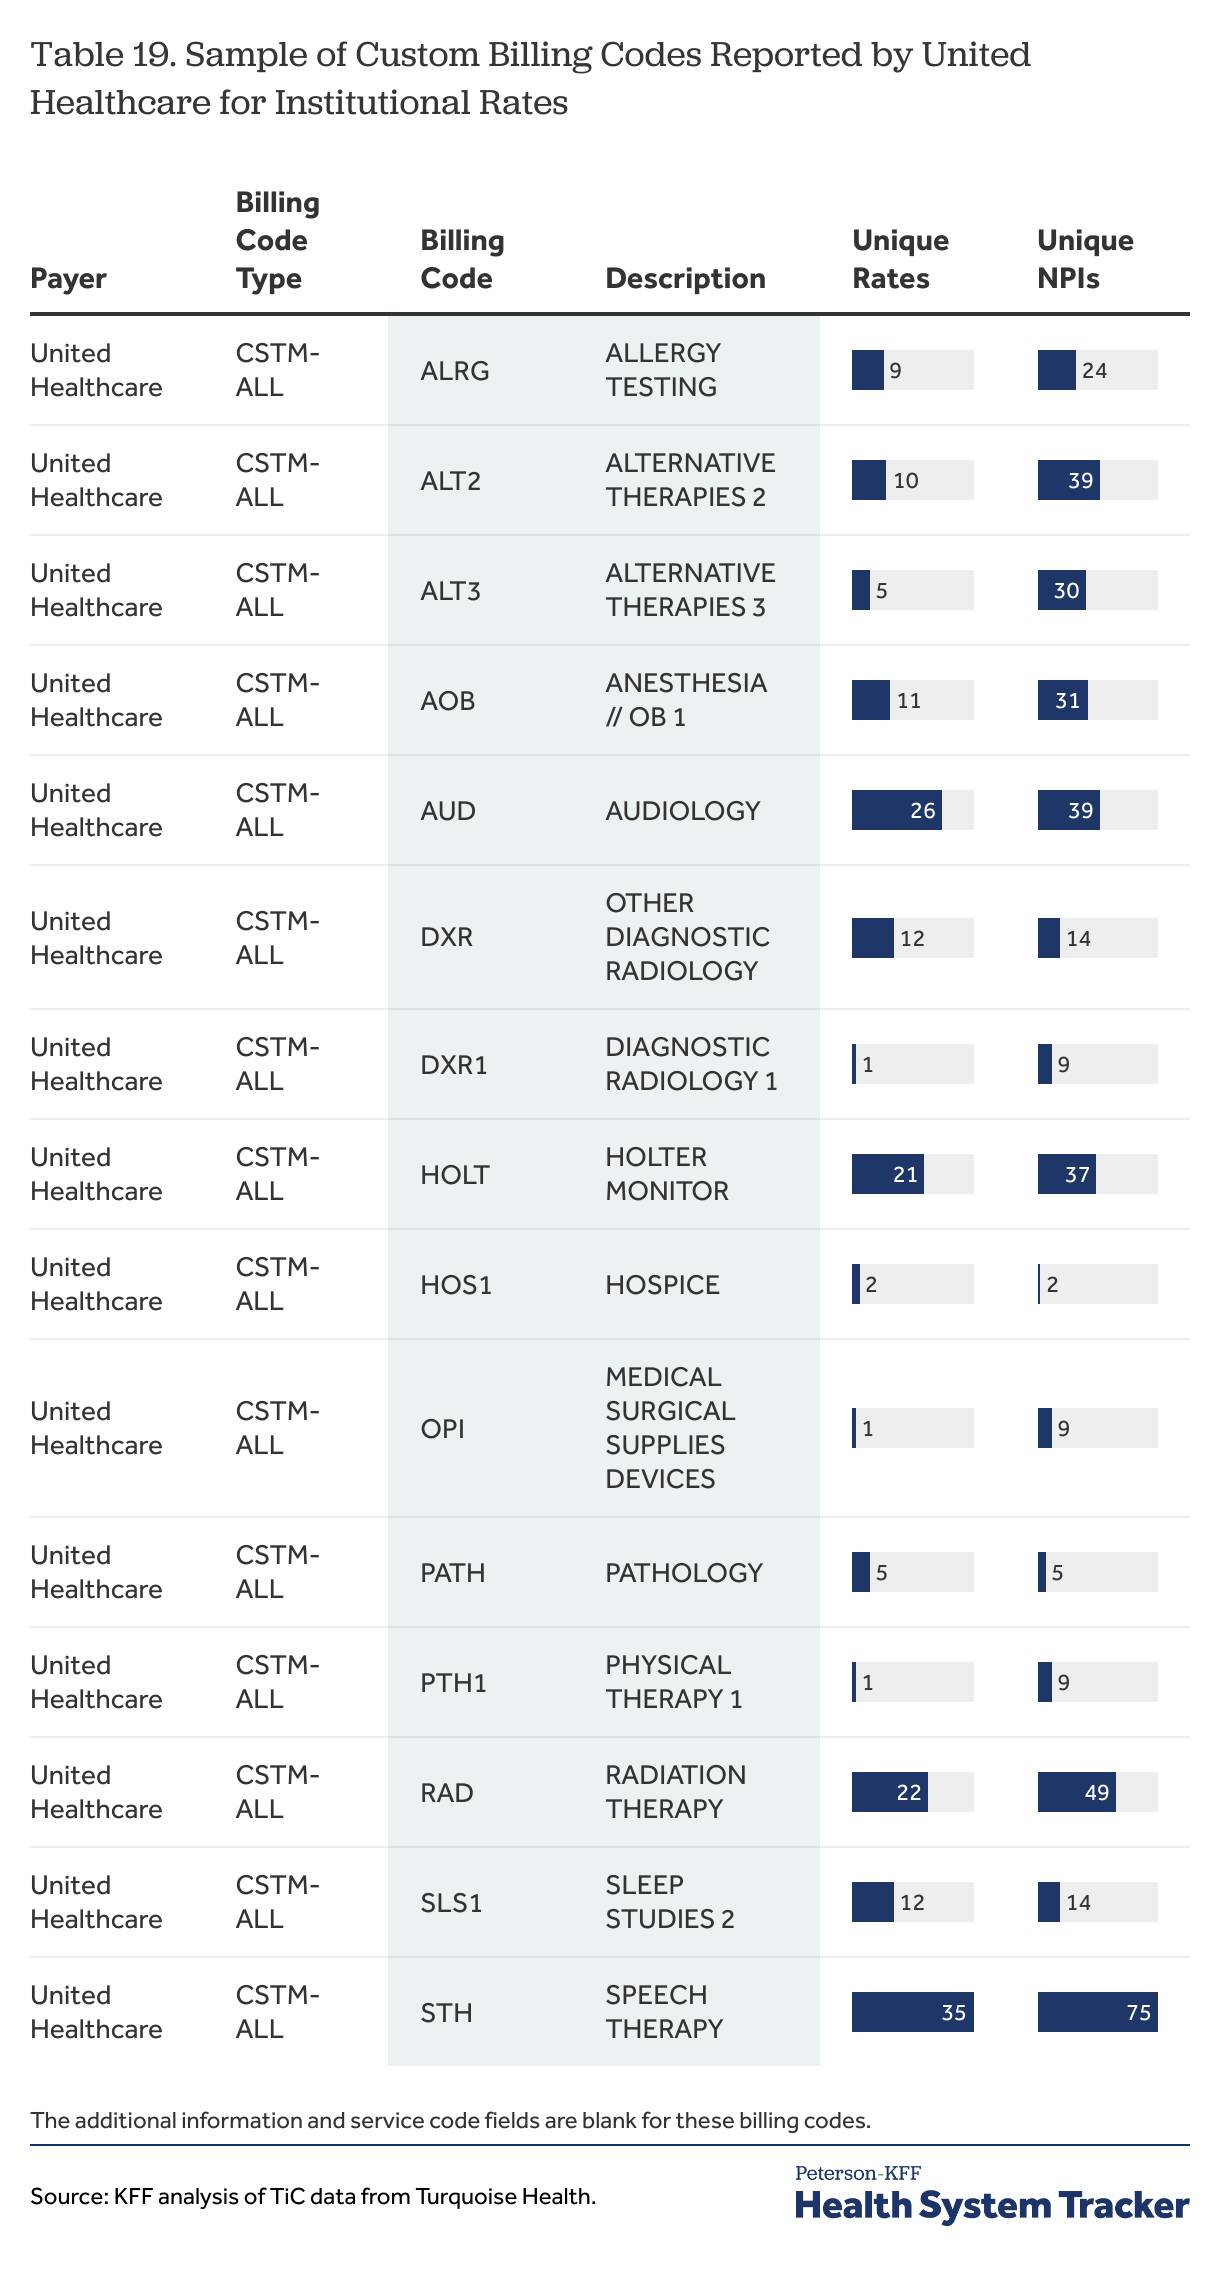
The EMR billing codes are part of a set of just over 100 custom billing codes that United Healthcare reported for institutional services in New York City. Unfortunately for data users, many of the descriptions for these codes are quite vague, which would make them quite difficult to match up with the CPT codes used by other payers; a sample of these codes with their descriptions is shown in Table 19.
Table 19
United Healthcare has created custom billing codes for some very common services that data users may want to use when comparing the prices for institutional services across payers and providers. Whether these rates could be compared to more common codes used by other payers will be a question for each data user to consider. For example, the levels for the EMR1 through EMR5 codes look similar to the five CPT emergency room evaluation and management codes, but this begs the question as to why United Healthcare would create custom codes to do the job of standard codes that are in common use. Further, United Healthcare reported professional rates using CPT 99281 through 99285, so these are codes that it is willing to use for part of emergency room claims.
United Healthcare is the nation’s largest payer, and its relatively extensive use of custom rates may limit the ability of data users to include it in comparisons of institutional rates for some fairly common services. This is not just an issue in New York City: United Healthcare also reported over 90 institutional rates for varying custom codes in other cities, including Atlanta and Dallas, so this is a practice that data users may need to consider when fashioning analyses.[21]
Cigna reports both professional and institutional rates through a custom billing code arrangement that differs quite a bit from the reporting discussed for United Healthcare. The custom rates reported by Cigna are all percentage type rates and all have a billing code type of CSTM-ALL, a billing code of CSTM-00, a description of “All other codes” and one of two phrases in the additional information field: “Inpatient services not otherwise priced” or “Outpatient services not otherwise priced.” The rates for this custom billing code reported by Cigna for The Mount Sinai Hospital are shown in Table 20.
Table 20
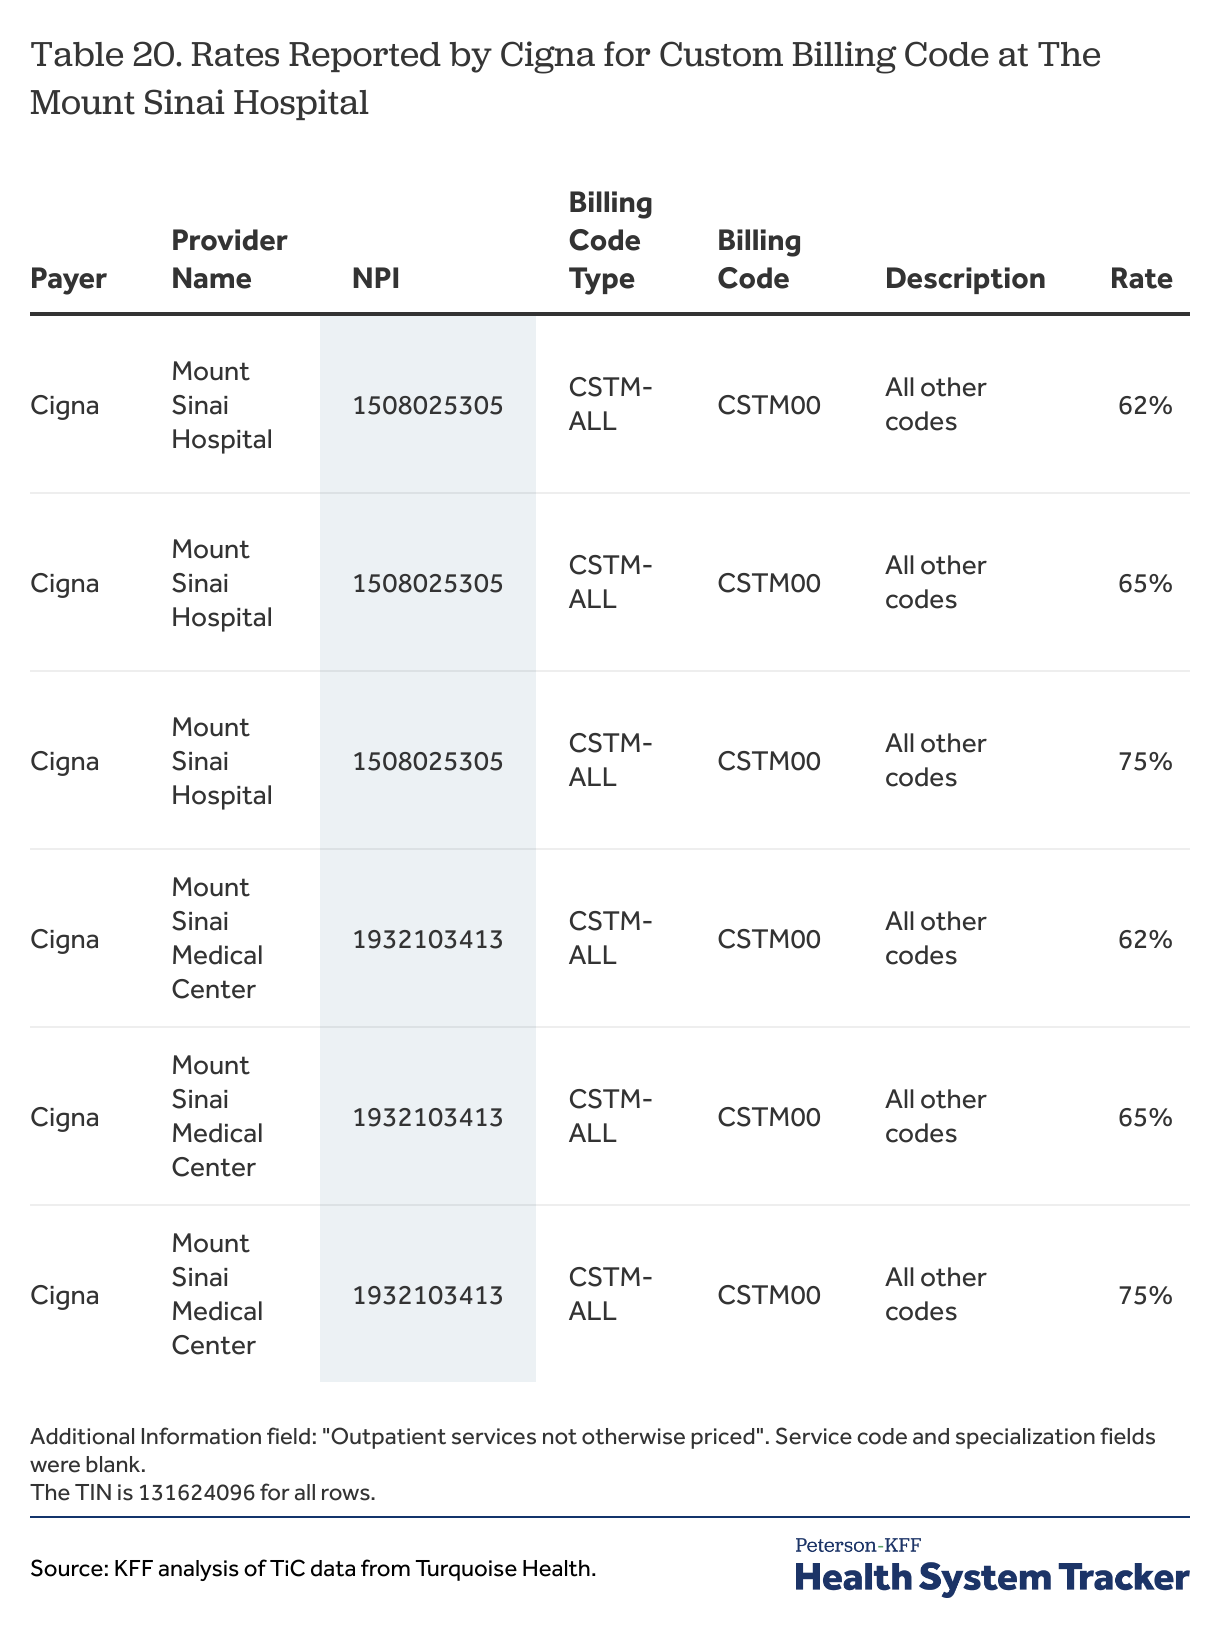
These rates present several challenges for data users. The first is that they are only valid when other rates are not present, which requires data users to look for other options before falling back on these rates. Doing this would add at least one additional step to any analyses that wanted to include these rates as options. The second is that there are multiple percentages reported which are quite different from one another, with no information available that would distinguish them. In some sense this example is similar to other situations where multiple rates are reported by a payer for provider for a service; its difference is that these percentages potentially apply a large number of different services and could define a substantial share of the arrangement between Cigna and this hospital. A third reason relates to the other rates that Cigna files in New York City: very large shares of the rates that Cigna reports are fee schedule rates, which under the schema are used to determine cost sharing responsibility and are not the amounts paid to providers. Whether these fee schedule rates reported for services would be considered services that are “otherwise priced” in applying these custom rates is a question that data users would need to consider.
Other factors. There are a few other differences across payers that data users may want to pay attention to as they may affect which rates may be compared to one another. One relates to services codes (e.g., the place where services are delivered), which are required under the schema for rates classified as “professional” or “both” and optional for institutional rates. As noted above, the preamble to the rule emphasizes the importance of the service code in identifying unique rates reported by a payer. For professional rates reported for NPIs with an “Orthopedic Surgery” classification for CPT 27447, Anthem reported service code of “22” (i.e., on-campus outpatient hospital) for most reported rates, United Healthcare reported service code “11” (i.e., office) for all of its rates, and Cigna and Aetna reported all or almost all of the 50 service codes (e.g., virtually anyplace) for all of their rates (Table 21). Whether these differences are intentional or have any practical meaning is difficult to know; data users will need to make their own judgement about this. Another difference across payers is when and how they report billing code modifiers. Both Aetna and Anthem reported professional rates both with and without billing code modifiers CPT 27447, while Cigna and United Healthcare did not report any professional rates with modifiers (Table 22).
Table 21
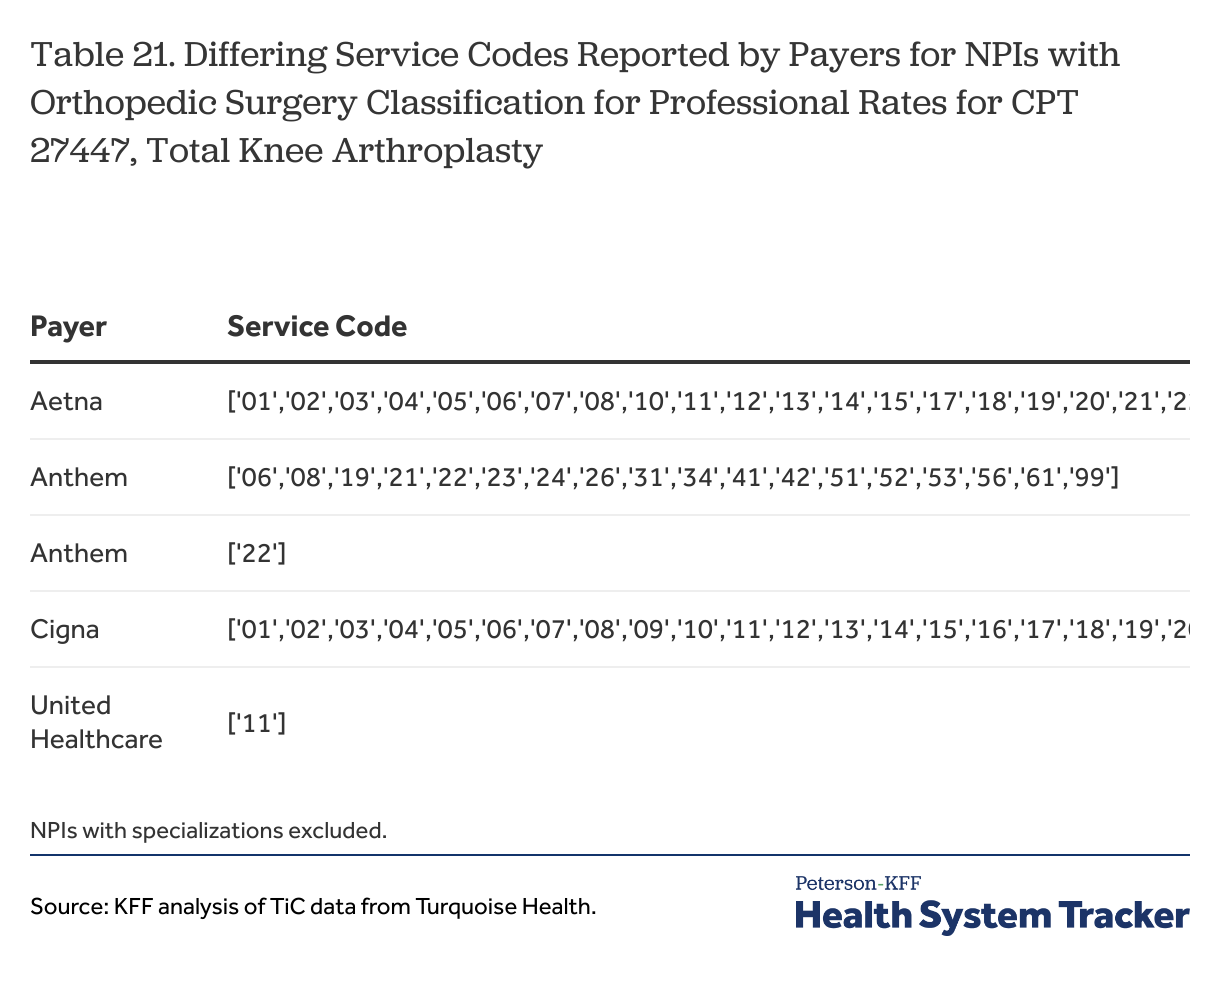
Table 22
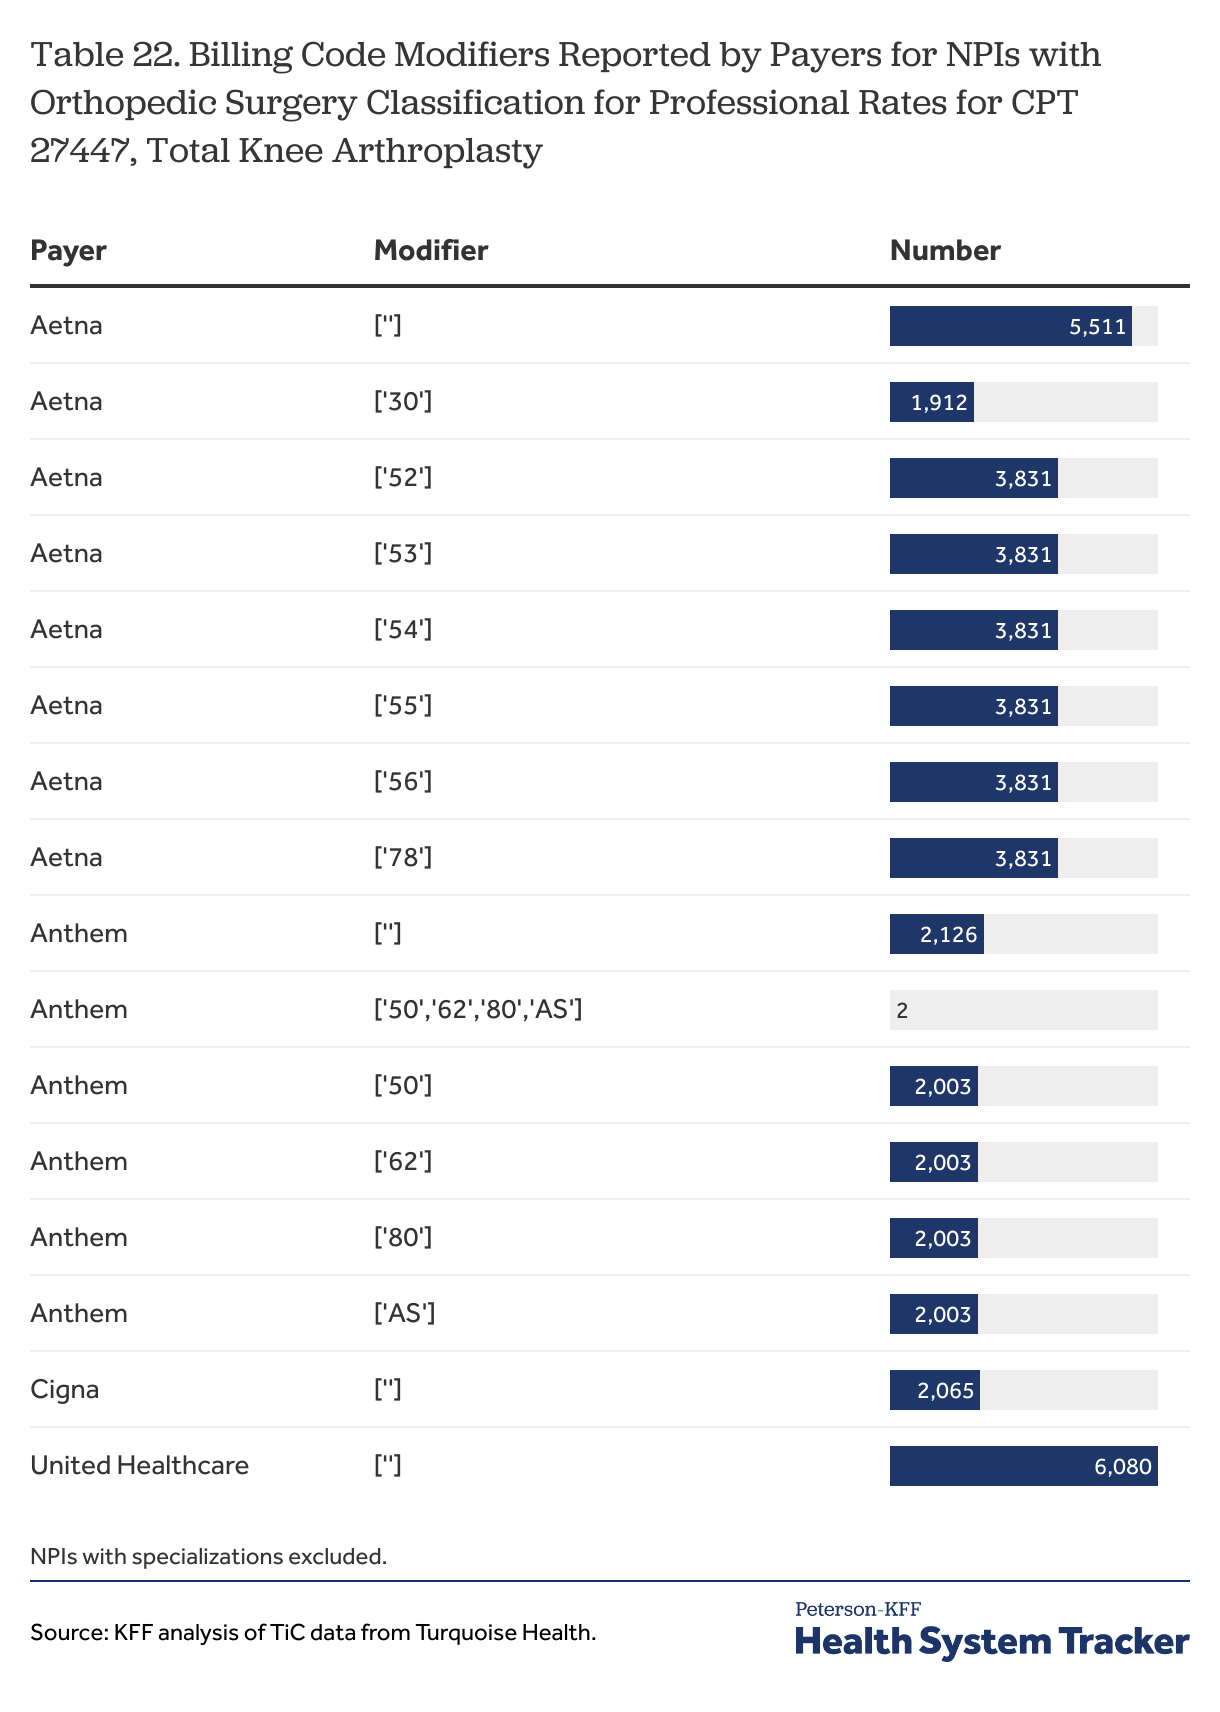
Describing findings: Issues with counting and summarizing reported rates
The TiC data allows users to see the rates negotiated between payers and providers for medical care items and services, identified in most instances by billing codes. The sections above identified several challenges data users may encounter when trying to select the rates applicable to a question of interest. Additional challenges arise once a data user is able to identify and select the likely rates — i.e., rates reported by a payer (for selected or all networks) for an NPI (or an NPI and TIN combination) with appropriate classifications and specializations (which may be no specialization) with the appropriate NPI type or types for the billing codes of interest (including modifiers where appropriate) with the appropriate billing class, negotiation arrangement (i.e., fee-for-service, capitated) and negotiated type or types, potentially titrated by information in the additional information or place of service code fields. These challenges relate to counting the number of providers contributing rates to the query and then to counting and summarizing the reported rates to produce results.
This discussion assumes that data users often want to summarize the rates for a billing code for a particular provider, either overall or by payer, and also that they will want to talk about the number of providers represented in an analysis. These steps may not be necessary if the goal is just to list all of the rates or compile a range of rates for a service for a market or market sector, but many data users will want to say more than that. Doing so entails finding effective ways to summarize the rates along the different dimensions across which rates can vary; these include: a payer reporting different rates for different networks for a service with a provider, a payer reporting more than one rate for one or more networks for a service for a provider, or a payer reporting rates for more than one NPI for a service at a provider’s location.
Counting providers. Data users often will want to know the number of discreet providers that contribute rates to a query, perhaps just for descriptive purposes, or in order to calculate summary statistics such as means or percentiles. The choices and issues encountered here can differ depending on several factors, such as the type of provider (practitioner or institution) and the type of rate (professional or institutional). Several examples can help demonstrate the issues.
Professional rates for practitioners
Professional fees generally are amounts paid to or for the services of individual practitioners, such as physicians, for delivering medical services. Rates for services negotiated with these practitioners might be reported for a practitioner’s NPI or for an organization, such as a group practice or institution with which the practitioner is affiliated.
Once a data user has sorted through all of the rates for a billing code and selected the likely ones, they are left with several choices about how to count the number of providers associated with those rates. The most straightforward way, at least for rates reported for individual practitioners, would be to simply count the number of NPIs as this is the number of likely providers with rates for the service. Many of these providers, however, will have more than one location (e.g., multiple offices) where they provide services, and these locations generally are identified with a separate TIN and sometimes are reported with a different negotiated rate or even rate type. Counting the number of NPI and TIN combinations also could be a reasonable way to characterize the universe of providers – perhaps better thought of as a universe of locations. These two approaches, however, can produce quite different numbers. For example, Table 23 shows that United Healthcare reported 11 unique negotiated rates for one diagnostic radiologist (a single type 1 NPI) across 22 TINs at 21 different addresses for CPT 70553, which is a brain MRI.
Table 23
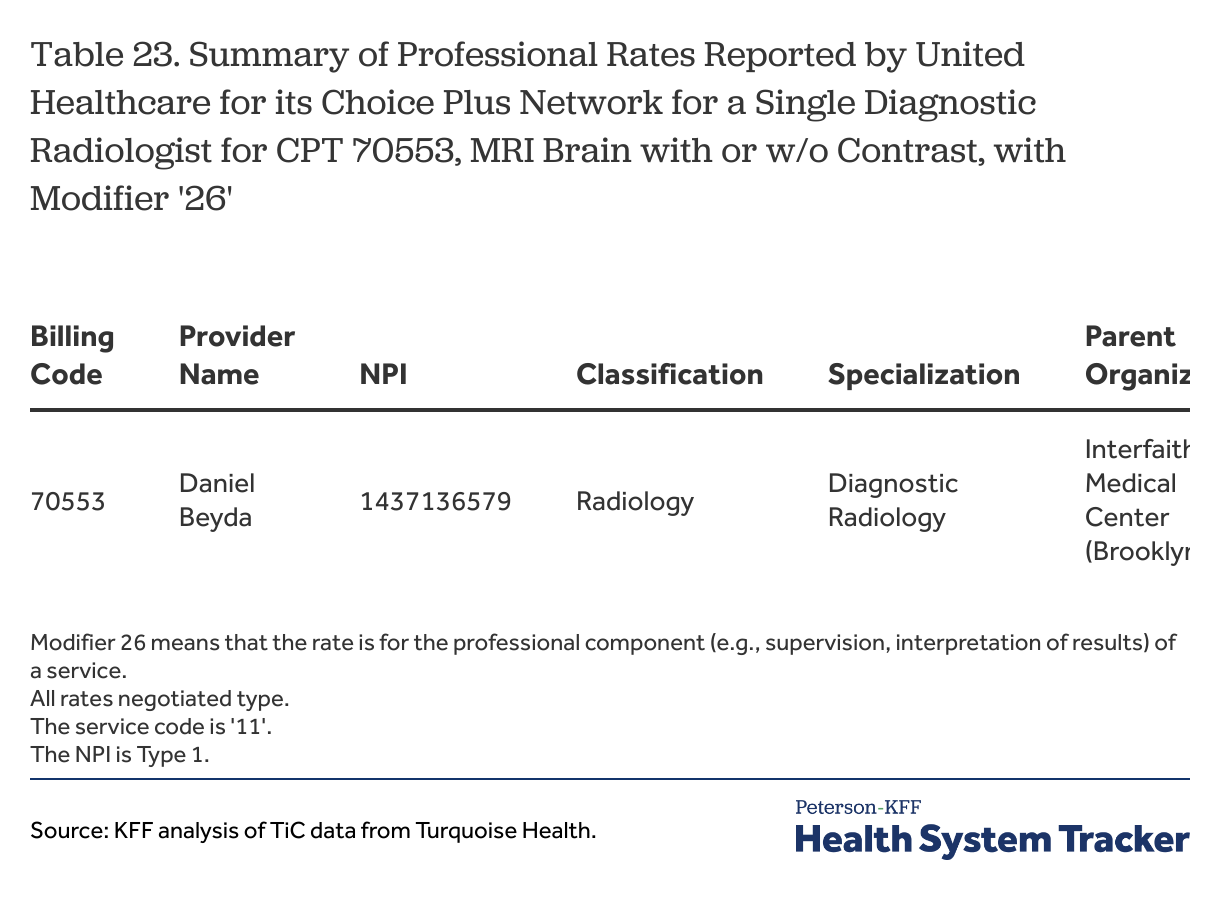
Rates for hospitals
One of the significant challenges associated with the TiC data and using Turquoise Health to analyze it involves trying to count the number of hospitals contributing rates to an analysis. The issue was illustrated in the first example above (Table 4), which showed several payers reporting rates for multiple general acute care hospital NPIs at both the Mount Sinai Hospital and the New York-Presbyterian Weill Cornell Medical Center. As already discussed, these situations can be difficult to recognize in the Turquoise Health data because there is not a unique identifying field that can be easily used to identify the situations or aggregate data at a hospital location: differences across NPIs for the hospital’s name, address, and geocodes (longitude and latitude) complicate attempts to match NPIs by name or location. The difficulty data users may encounter here is proportional to the size and complexity of the analysis they are conducting. Figuring out the correct NPIs for hospitals in a limited area such as a city is not that difficult through some trial and error, but this method becomes less practical when larger geographies come into play. Additionally, different payers use different combinations of NPIs for the same hospital, which means that more rates may need to be investigated to spot all of the NPIs being used as well as the duplicative reporting.
There is not an obvious way to make this task easier because most of these problems stem from differences in the NPPES registry and other metadata sources. Absent some rules that standardize and make current the NPIs for hospitals and other organizations, or some separately curated database that attempts to search through and match duplicate NPIs at different institutions, identifying specific hospitals and other organizations in an analysis, and matching or aggregating reported rates by those specific organizations, will remain a significant challenge to users of this data.
Counting and summarizing reported rates. Data users, once they have identified the likely rates for the service or services of interest, generally will want to summarize them in some way that describes the costs of those services. Most summary measures – means, medians, modes – involve counting the number of rates that are being considered, which entails, among other things, making decisions about how to handle some of the different ways that duplicative rates are reported.
Rates reported in multiple networks
Payers often report the same rate for a billing code for a provider (with everything else equal) for multiple provider networks. This can result in essentially the same rate being reported with a provider 20 or more times if the payer has a large number of networks. Data users have some choices about how to count rates that are reported in multiple networks, particularly because different payers will likely have different numbers of network arrangements with any particular provider.
One of the weaknesses of price data as compared to claims data is that there is no way to know whether or how often a particular price is used. This uncertainty is extended when a price is reported multiple times for different networks because, absent some external information on the relative enrollment in different networks, there is no way to know whether one network is somehow more important than another; in general, most people would be more interested in knowing the price for a service in a network that has 10,000 enrollees as compared to a network with ten enrollees. Aetna, for example, reported rates for 28 networks for MS-DRG 177 at the New York Presbyterian Weill Cornell Medical Center, and of those, 24 were labeled with a state name and plan-type designation, such as “AK Group HMO”, “DE Group POS” or “MD Group HMO/POS”, suggesting that these networks might be for people covered by plans issued in other states. The large majority of these states are not adjacent to New York, which at least raises some question about how relevant the rates in these networks are to prices in New York City. In this case, each of the networks has the same rates for the service, so the number of networks would matter only if a user chooses to use the number of networks somehow in how they summarize rates for a provider.
Table 5
Some of the choices data users need to make are illustrated in Table 5, which shows the distinct negotiated and derived rate values reported by Anthem, Aetna and United Healthcare for MS-DRG 216 for one of the NPIs at The Mount Sinai Hospital. For the purposes of this illustration, it is assumed that negotiated rates and derived rates are reasonably comparable. Aetna reported one distinct rate for this billing code for this NPI, reporting that one rate for each of twenty-eight different networks; Anthem reported four distinct rates, reporting a different rate at each of four different networks, while United Healthcare reported two distinct rates, reporting one of the rates for each of 16 different networks and reporting the other rate for one network.
As noted, one important set of choices for data users revolves around whether, and if so how, to give credence to the number of different networks for which a payer reports rates. One way to do this would be to count each network and rate as a separate observation (for the present assuming just one rate per network). Using this approach for this example, the rates reported by Aetna would receive more weight (e.g., importance) than the rates filed by the other payers because Aetna has more reported rates for more networks. Another approach, which would not give greater weight to the rates of a payer simply because it has more networks, would be to use the network-rate combinations to calculate a summary measure for each payer, and then to use those payer summary measures in any further calculations. Using this approach, the higher rate reported by United Healthcare in 16 networks would receive more weight in calculating a summary measure for its rates with the hospital than the lower rate reported for one network. A third approach, which would not give any weight to the number of networks for which a rate is reported, might be to use just the distinct rates for each payer; under this approach, Aetna would have one value, Anthem would have four distinct values, and United Healthcare two distinct values, which then could be used for any further calculations.
The differences in just these three approaches can be meaningful; for an example using averages, the average rate for this billing code for this NPI would be $275,642 under the first approach and under the second approach; under the third approach, the simple average of the seven values would be $264,507 while the average of the average payer values (i.e., average first by payer) would be $247,640. For the two United Healthcare distinct rates, the average reported rate for United Healthcare would be $268,595 if the rates were weighted by the number of networks (the second approach) and $247,640 if the two values are simply averaged (the third approach).
There are of course many other ways to try to summarize these values; using medians rather than means, for instance, may be preferred for summarizing different values across a payer’s different networks. Data users will want to consider different options depending on the data they select and their analytic goals. A key take away, however, is that under almost any approach, the choices data users make about whether and how to deal with the large number of networks are likely to have important effects on results. This emphasizes how important it is for data users to be clear about how they are counting the rate values that they are using and how they are summarizing them by and across payers and providers.
Multiple rates reported for the same network for the same provider
Among the more confounding issues with the TiC data are cases where payers report more than one rate for a billing code for a network for a provider NPI where all differentiating factors are the same. This pattern is illustrated in several examples above (Table 10, Table 11). As previously discussed, this outcome is not supposed to occur under the schema; that it does suggests that there may be other information, not available in the data, that could distinguish the rates somehow. Without this additional information, data users face the question of whether or not to use any or all of the reported rates, and if so, how.
A conservative approach might be to drop cases where multiple rates are reported in this way, on the basis that they are at odds with the schema and do not produce a definitive result. Doing this would limit analyses to cases where the rates and the differences among rates are more certain. Unfortunately, dropping these cases could affect observations for many of the important payers and providers in a market. For the sample MS-DRGs considered here, Aetna, Cigna and United Healthcare each reported rates at multiple major hospitals in New York City. Excluding these observations has the potential to skew results for certain types of analyses at least as much as including the somewhat ambiguous multiple rates that were reported.
Data users that choose to use the reported rates need to then figure out how to do so. Using them as separate rates gives added influence to the arrangement because it is counted two, three or more times. Summarizing the values by taking the mean or median may be the only option to achieve one rate value, although using means or medians for a small number of values has the potential to produce a skewed amount that is not really representative of any of the reported rates.
The trickiest question for data users may be whether the rates fit well enough together so that all of the values should be included. Determining whether two or more rates fit together – that they reasonably might be describing a rate from the same payer for the same service – has both an absolute component (e.g., is the rate reasonable compared to the market overall) and a relative component (e.g., is the rate reasonable compared to the other rates reported by the payer). These points are illustrated in the next two tables. Table 2 shows multiple rates reported by United Healthcare for MS-DRG 280 for one of several general acute care hospital NPIs at New York-Presbyterian Weill Cornell Medical Center. Table 24 similarly shows multiple rates reported by Aetna for MS-DRG 280 for one of two general acute care hospital NPIs at The Mount Sinai Hospital.
Table 2
Of the three rates shown in Table 2 that United Healthcare reported for each of its networks for this service for this NPI at the New York-Presbyterian hospital, the lowest one ($47,073.04) stands out as it is separated from the other two rates by a considerable margin (it is 27% less than the second lowest rate), with the two higher rates being relatively close together. Whether this places this rate out of place in the context of the other rates reported by the payer would be an issue for a data user to consider. On an objective level, however, the $47,073.04 value is well in line with rates reported for this service at other hospitals, and it would not seem out of place if it were reported as the only rate for a network by a payer.
Table 24
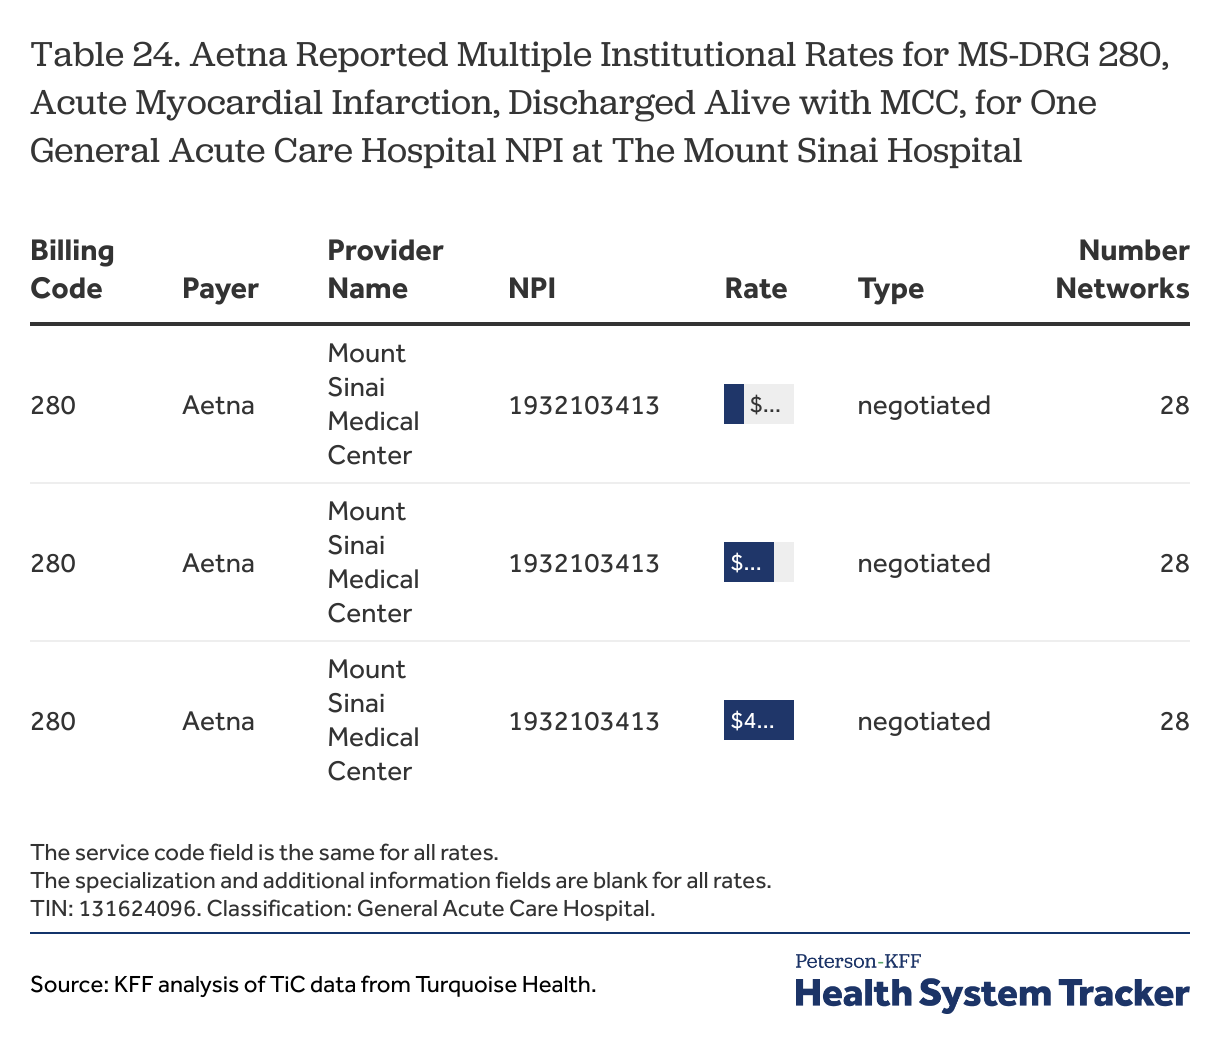
As a contrast, the three rates shown in Table 24 that Aetna reported for each of its networks for the same service for this NPI at The Mount Sinai Hospital are fairly well dispersed, and lowest one ($12,728) is low both in absolute and relative terms. In fact, this same rate value is reported by Aetna for multiple MS-DRGs at this hospital, strongly suggesting that it is not intended at a price for this particular service and should be excluded for that reason at least. As discussed above, however, this pattern is a very difficult thing to uncover unless one is looking for it. In any case, this rate is low enough that it does not seem to be a rate that most data users would want to include in an analysis of the reported rates for this billing code.
There are practical issues with this type of analysis. Reviewing the reasonableness of each of the rates in these situations would need to be done before the rates are summarized at the network level, where any outliers would be blended with other rates and lost to review. This realistically means that all of the multiple rates would need to be recognized and preserved so that they at least could be considered for reasonableness in an overall market sense. Fashioning a way to consider the reasonableness of a rate relative to the other rates reported by a payer for the same code and provider is a fairly complicated exercise, particularly if more than a few providers are part of the analysis; it is far easier to visually review the rates for a case and spot issues than it is to devise a statistical screen or algorithm to try and accomplish this task.
Multiple NPIs of the same classification for the same provider at the same location
As previously discussed, payers sometimes report rates for more than one NPI with the same classification, specialization and other identifying information (e.g., TIN, service code) at the same location, such as a hospital. Summarizing all the rates reported for a such a provider requires identifying these situations and incorporating the rates from the different NPIs into the analysis.
In many ways, the questions around how to summarize rates across multiple reported NPIs for a hospital or other organization are similar to those involved in summarizing rates reported for multiple networks: each situation may present different rate values for the same set of parameters, and there is no basis in the data to suggest that a payer considers one the NPIs for a hospital or organization to be primary or more important than the other NPIs at the same address. Fortunately, in some of these cases payers report the same pattern of rates for each network for each NPI, allowing data users to ignore the duplicative values. In cases where the pattern of rate values differ among the NPIs, data users may need to consider which types of estimates best reflect the differences across the multiple networks at each NPI as well as the differences across the NPIs themselves.
One way in which these multiple NPI cases might be a little different relates to identifying the reasonableness of rates. In the example shown in Table 24, the lower rate is fairly far away from the other two rates, but not necessarily unreasonable in terms of market levels. United Healthcare, however, reported rates for this billing code for six general acute care hospital NPIs for this hospital, and the lower rate value was reported for only one of those NPIs while the higher rate values were reported in five of the NPIs. The lower value looks less reasonable in this context; and a data user may want to give more weight to rate values that appear in more of the NPIs. This is operationally quite complex however.
Data can materially change from month to month
The TiC data is reported on a monthly basis, which provides data users with an opportunity to see and measure changes in rates and arrangements over time. At the same time, this schedule presents a monthly challenge for organizations such as Turquoise Health and other TiC data users as they work to ingest and organize the enormous amount of information that is being released. Data users should be aware that the data changes from month to month in sometimes unexpected ways.
There are several reasons why the TiC data might change from month to month. The most obvious reason is that the metrics that are being reported actually changed, such as updated rates or changes in contractual relationships. A second reason is that payers may be changing how they report information, which may reflect an evolution in the way they interpret the schema or changes in their reporting capacity or approach. A third reason is that data users that act as intermediaries, such as Turquoise Health, are ingesting and presenting the data differently from month to month or over time; this could occur because it is difficult to interpret and reflect changes in the reported data from month to month or because their own approaches and methods are evolving over time. One of the reasons that these later two explanations matter is that using the TiC data often involves sorting through many unlikely rates in order to identify the more likely rates to analyze, and doing this involves trying to understand the reporting schema and how payers respond to it. Changes in the organization or structure of the reported rates can affect how data users understand the reported rates, both at a point in time and if they are trying to track changes over time.
Table 7
An example of a change in reporting is shown in Table 7, which shows changes in the pattern of reporting of institutional rates for CPT 27447 by Aetna for one of its networks over four different months in 2024. In January and in March, rates were reported for 70 or more NPI classifications, before shrinking to seven in May and then 13 in July. Similar patterns exist for other CPT codes. This suggests a fairly significant change in the approach to reporting (or the processing) of institutional rates by Aetna over the period.
Because so many of the rates reported for this code are reported for types of providers that would never provide the service, this type of change might not affect analyses materially as the rates for many of the 70 plus classifications would likely be discarded in any analysis of likely rates. The change actually might seem to be a benefit to data users as it reduces the amount of noise that they need to sift through. The scope of the change, however, may be hard to predict for users that are trying to look for trends or repeat a prior analysis. For example, Aetna reported institutional rates for Orthopedic Surgery practices in January and March, a classification that a data user might find reasonable for this billing code, but did not do so in May and July, when no institutional rates were reported for any type of physician practice. Perhaps more surprisingly, while Aetna reported institutional rates for CPT 27447 for a number of ambulatory surgical centers in January and March, it reported no institutional rates for this billing code for any ambulatory surgical centers in May and July. This change also occurred for many other billing codes, such as CPT 42235 (Upper Gastrointestinal Endoscopy). Aetna did report professional rates for these billing codes for ambulatory surgical centers in July.
Table 25
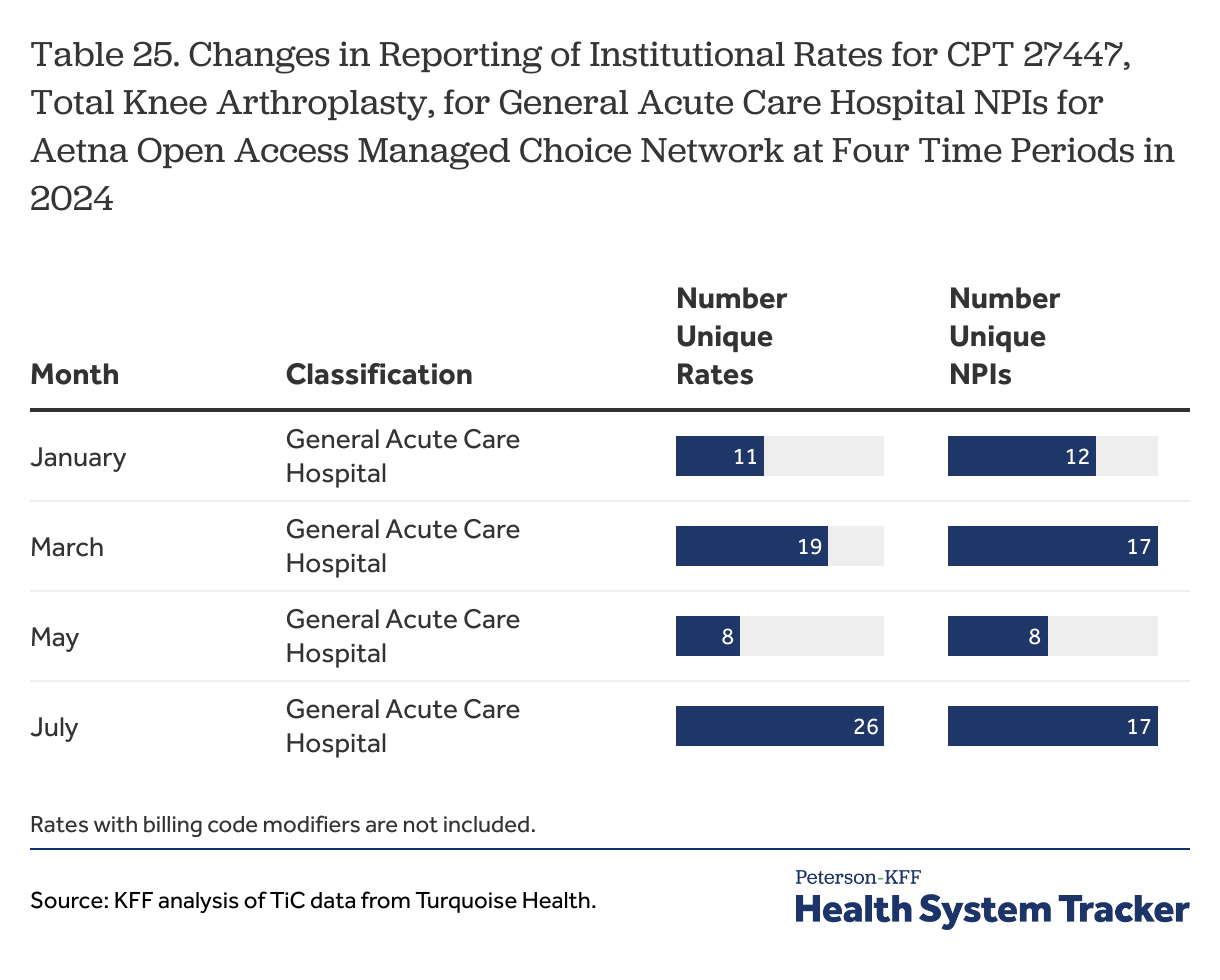
In addition to this dramatic change in the number of classifications for which Aetna reported institutional rates for this billing code, some unexpected reporting changes within provider classifications occurred as well. Aetna reported institutional rates for this billing code for its Open Access Managed Choice Network for 12 general acute care hospital NPIs in January, 17 in March, eight in May, and 17 in July (Table 25). Among the hospitals with reported rates in July but not in May are the three Mount Sinai hospitals, the New York-Presbyterian/Columbia University Irving Medical Center, and the New York University hospitals.
Another example of change is the network names reported for Anthem over the first six months of 2024. The first two months have a network label of “NY UNLABELED”, which is a label that Turquoise Health used for reported information from Anthem where the product network could not be reliably identified. This practice stopped in early 2024.[22] Even with this change, however, the number of networks for which Anthem reported rates for the sample MS-DRGs changed several times between January and July, with some networks appearing and then disappearing during the period (Table 26). This pattern may reflect difficulties with ingesting the interpreting rate files released by Anthem.
Table 26
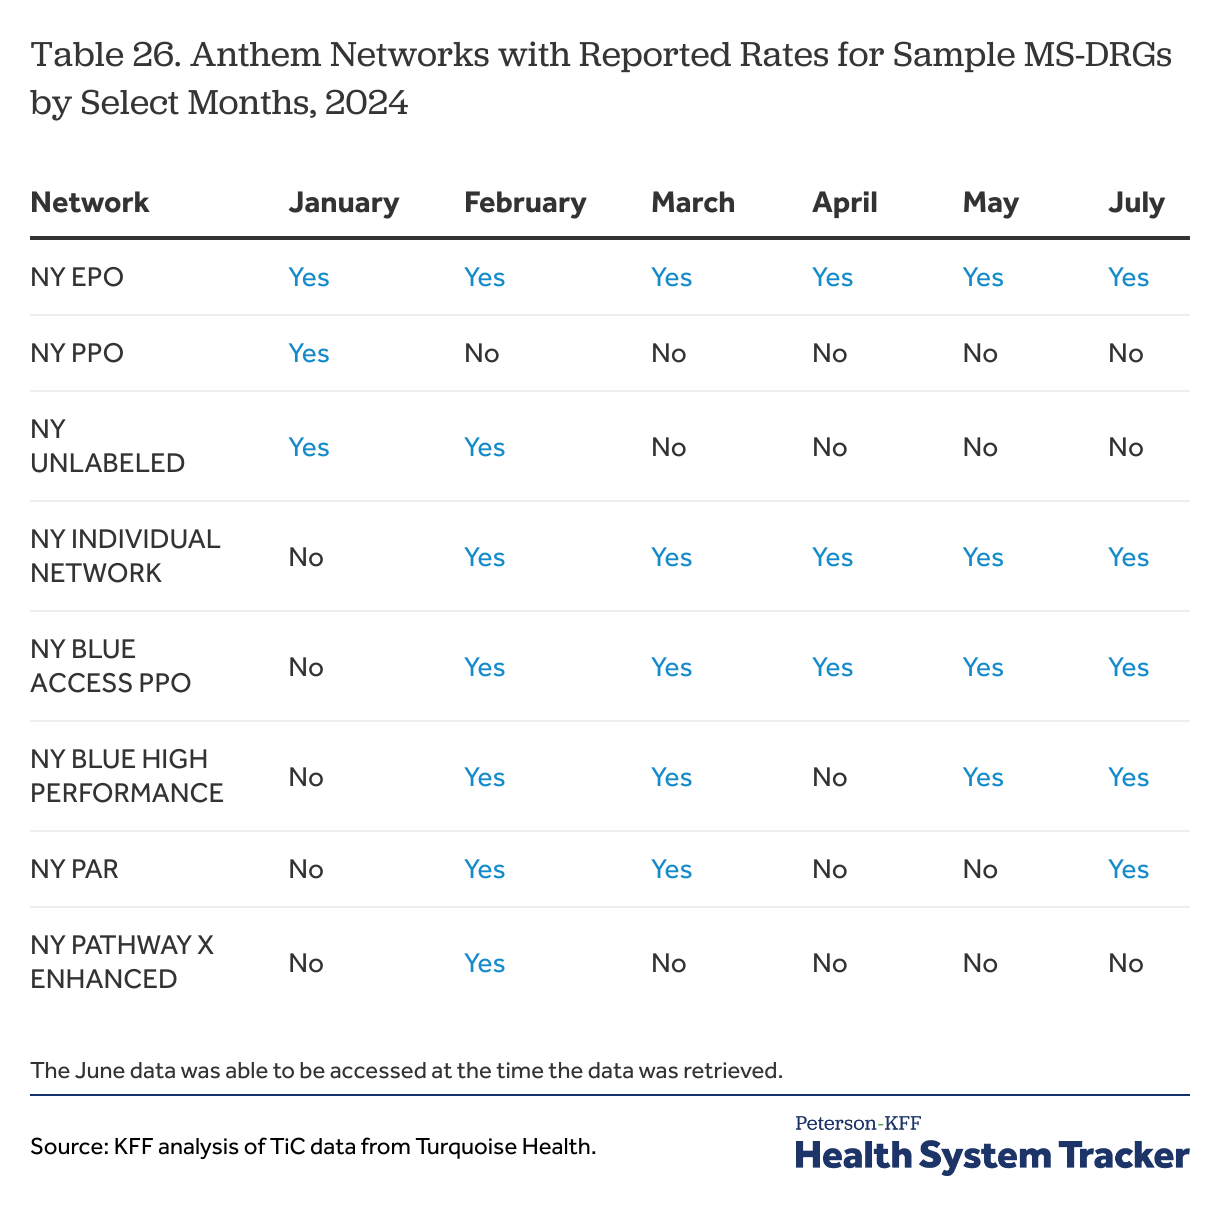
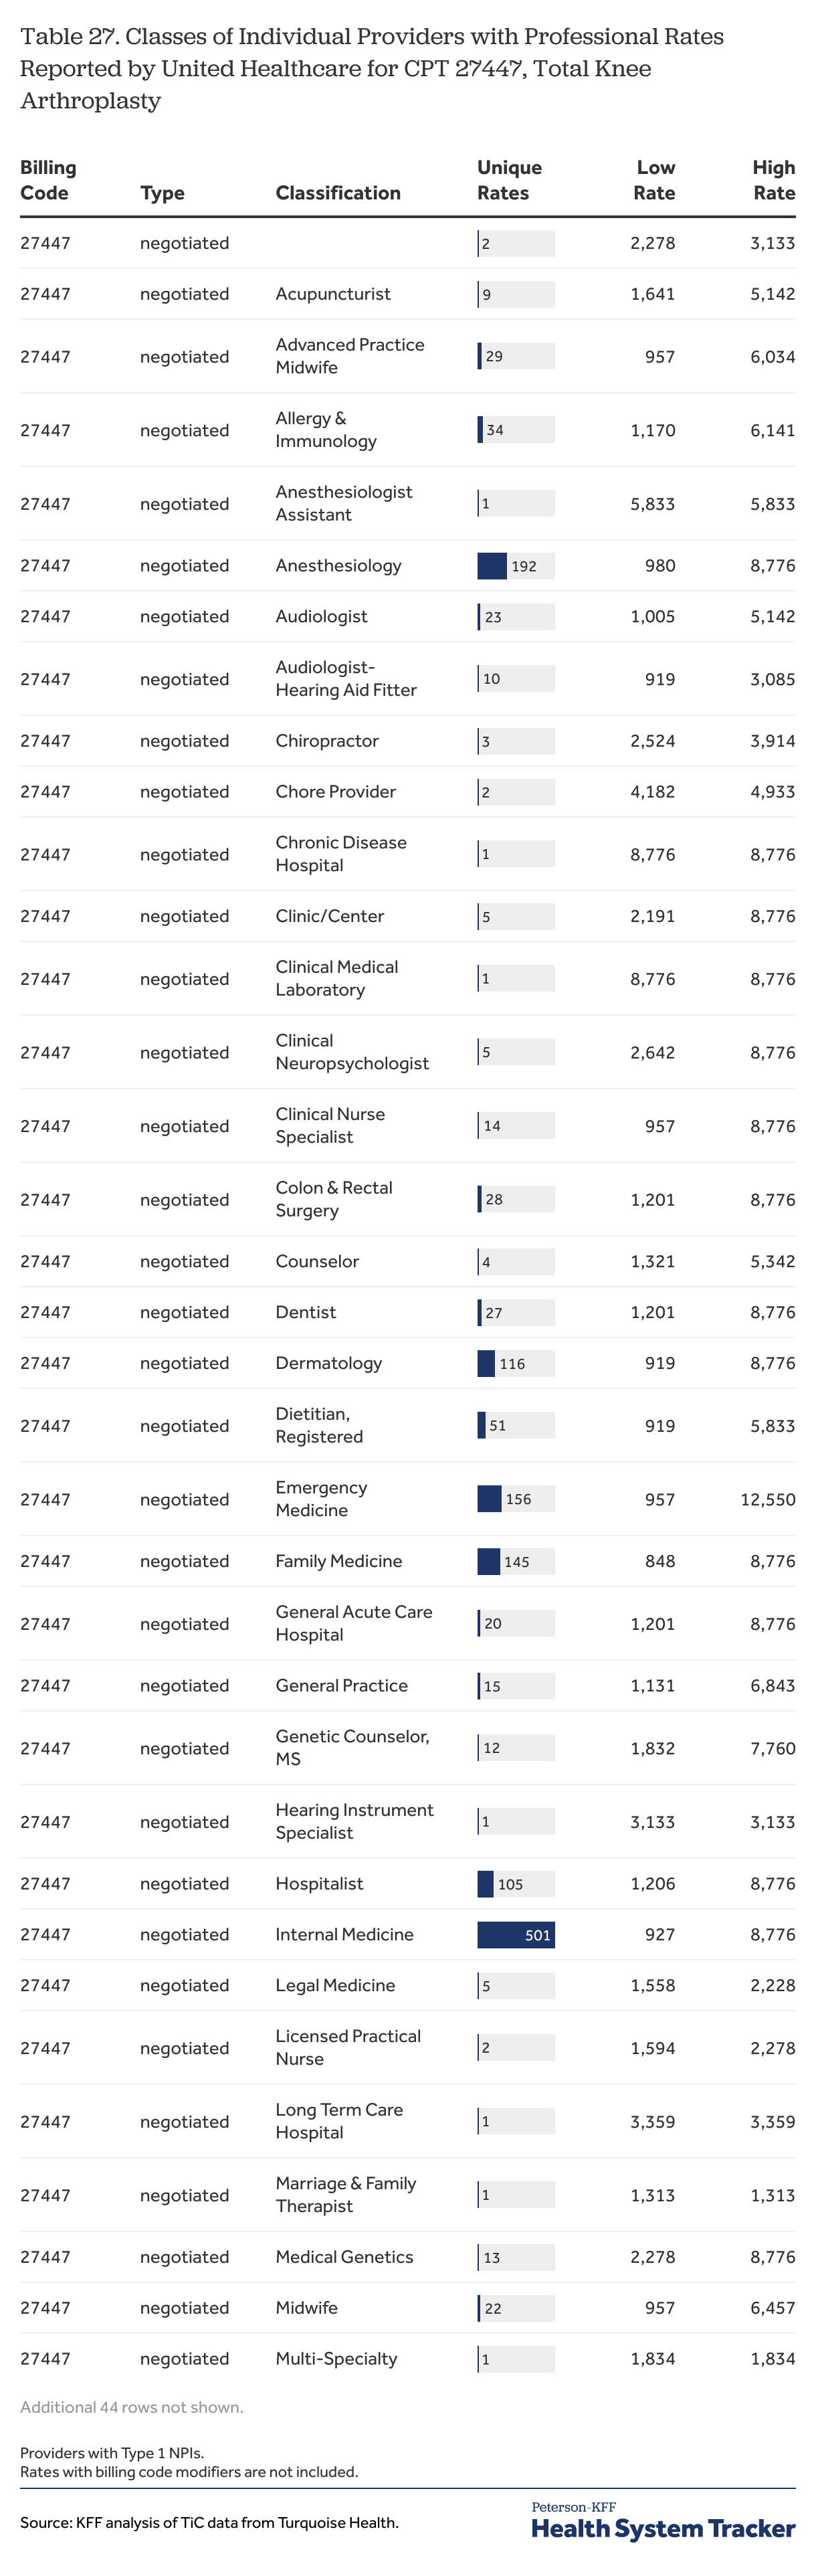
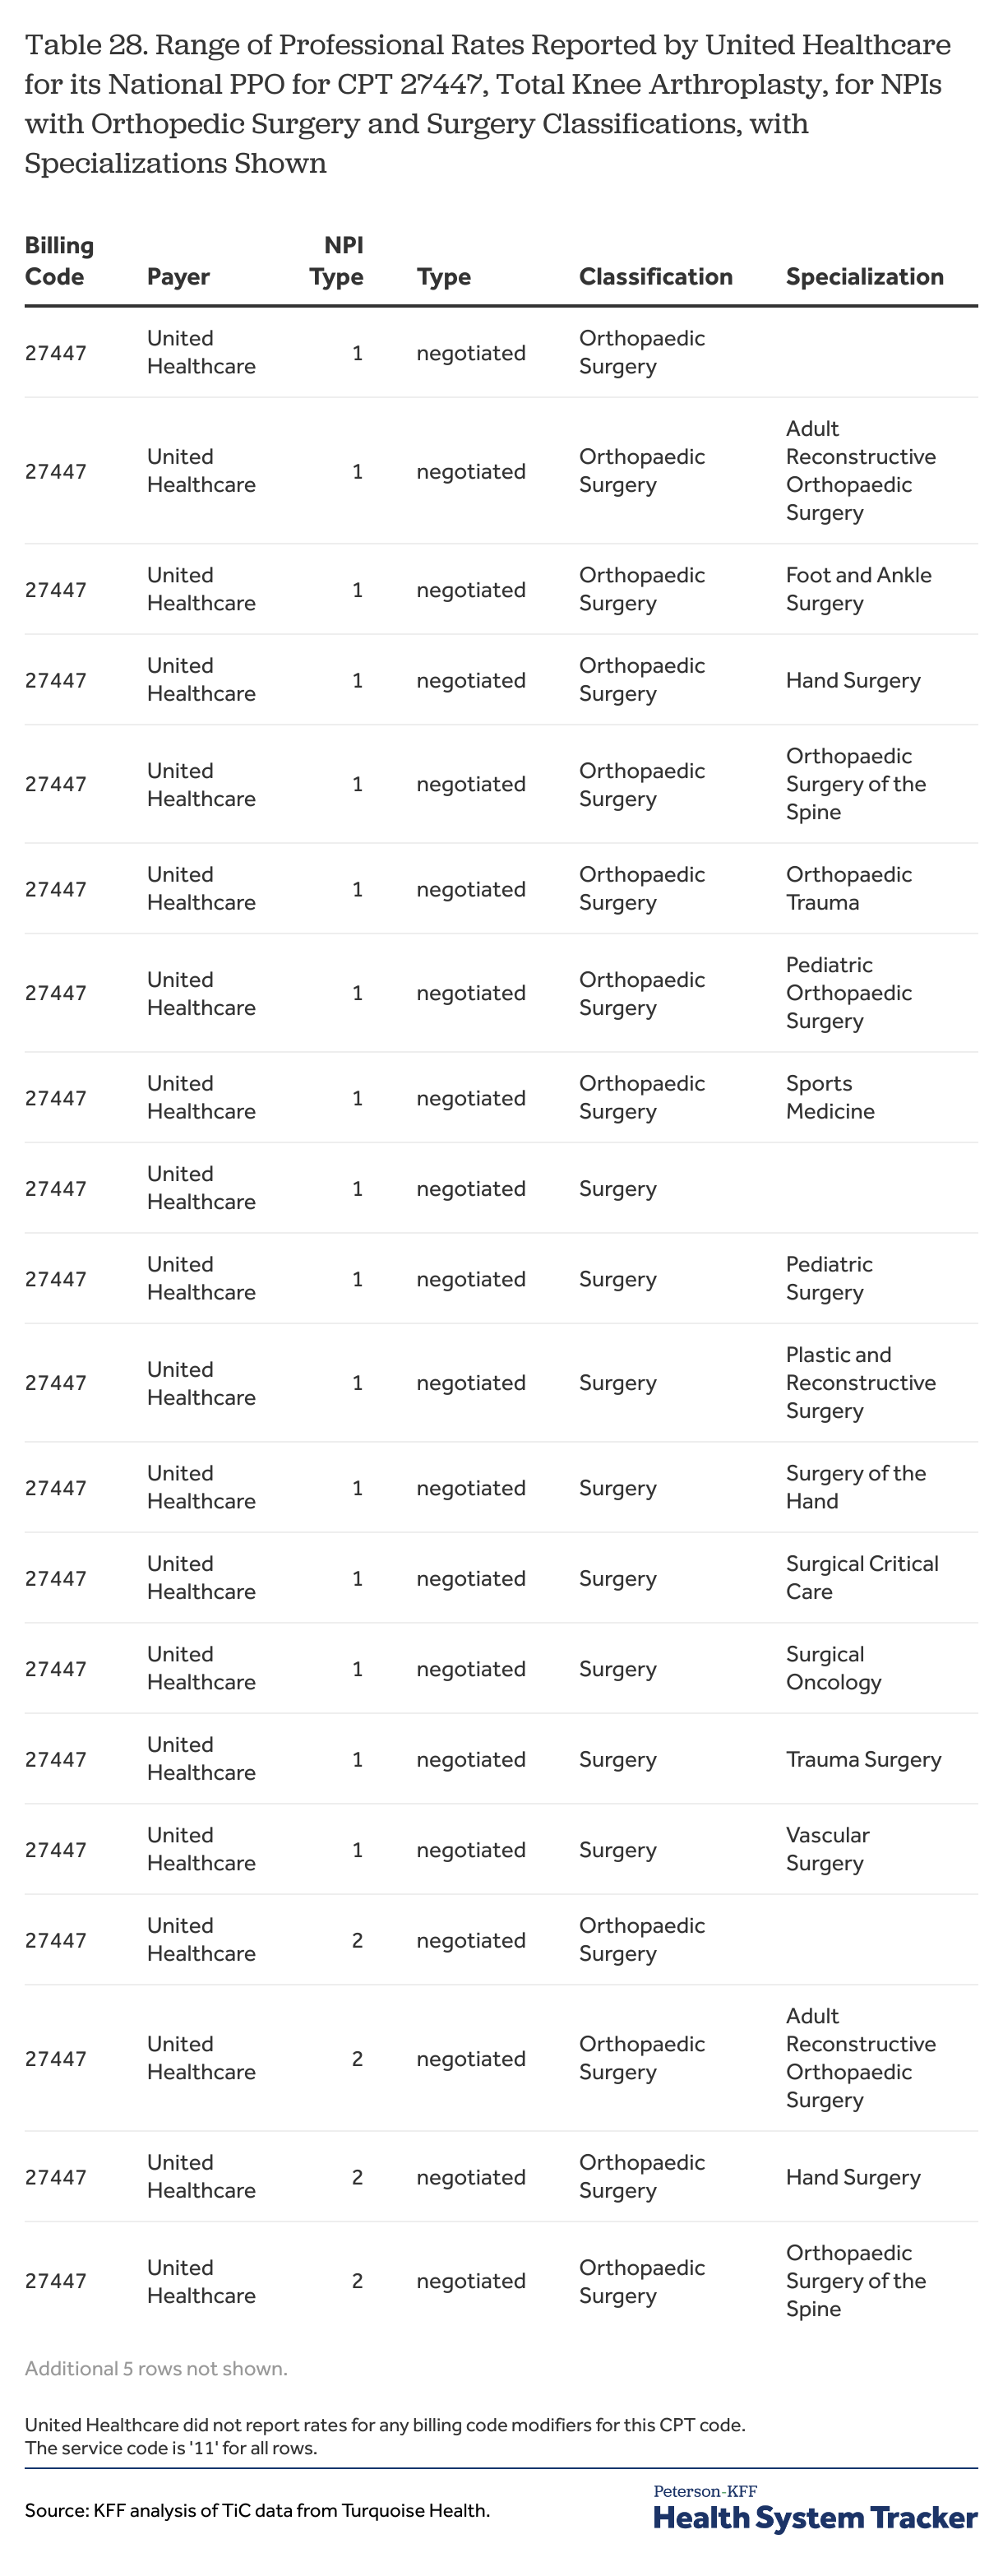
Methods
This paper draws examples from the Transparency in Coverage (TiC) data, accessed through the payer research dataset created and maintained by Turquoise Health. Unless otherwise specified, the discussion and examples are based on information from the July 2024 Compressed Rates file and several reference files in that dataset. Sample SQL code developed by Turquoise Health served as a starting point for the data queries.
The massive amount of TiC data reported each month by payers makes it essentially impossible to explore any significant portion of the data. The approach taken here is to select and work with rates reported by a few payers for a few select billing codes reported in one market. The examples here are based on rates reported by Aetna, Anthem, Cigna and United Healthcare for providers in New York City. Three initial rate files were created, one with rates reported for 26 MS-DRGs, one with institutional rates for 40 CPT codes, and one with professional rates for three CPT codes. The codes are listed in tables below and are referred to as the sampled codes in the discussion. Additional rate files with rates for custom billing codes reported by United Healthcare and Cigna was also created.
For the most part the examples are designed to highlight issues or challenges associated with the reporting requirements and the resulting structure of the data, and are not intended to explore whether the rate values themselves are accurate or within reasonable bounds. There was no attempt to identify and exclude outlier values. In a few cases, unreasonably low rates or unreasonably large rate ranges were noted in the context of structural issues with the data.
Providers are identified in the TiC data primarily by their National Provider Identification (NPI) number and their Tax Identification Number (TIN). Turquoise Health uses this information to add descriptive information to the dataset that can be associated with the reported NPI and TIN numbers. This includes taxonomy information from the NPPES data base and other data sources. This information, which includes the provider’s name, address, areas of practice and specialization, are important for data users to be able to associate the rates with particular providers and types of providers. Many of the examples here look at hospitals, which have a classification of “Acute Care General Hospital”. Hospitals with specializations other than “Critical Access”, such and those specializing in treating children and women, are not included in the examples unless specifically identified as such.
The names applied to organizations are taken from the “clean_org_name” created by Turquoise Health. It is sometimes but not always the same as the name in the NPPES database. As discussed in the text, hospitals or other providers may have more than on NPI registered at the same address and they may have different names both in the Turquoise Health “clean_org_name” field and in the NPPES database.
The examples are constructed to highlight certain aspects of the data, and to do that it is often necessary to account for the sometimes many reasons that rates may differ. The choice here is often to show the classifying variables in the examples so that readers can see for themselves how the data varies or does not vary along the data aspect that is being discussed. This hopefully leaves readers with fewer questions about whether some other factors might be affecting the matter being discussed.
Many of the examples use rates with a negotiated type of “negotiated”, which means that they are expressed as a dollar amount for the service (I.e., a case rate). This type of rate is more common than per diem, percentage or derived rates. Some examples have both negotiated and derived rate types with the view that it would be reasonable for a data user to consider these types to be comparable. Fee-schedule rates are included less often in the examples because, under the schema, they are meant to reflect patient cost sharing when that amount is different than the negotiated rate. Cigna reports many rates as fee-schedule rates and so appears less often in the examples.
Some users of the TiC data though Turquoise Health will see variables used in these examples that they do not see in the files that they are using. Some of these users may be using the core rates file for Turquoise Health as their primary file for reported rates. This file appears to be more heavily curated than the compressed rates file used here, and also includes fields created by Turquoise Health to help users assess the plausibility that a rate is an accurate one. No attempt was made in this paper to assess any aspects of, or outcomes associated with, the core rates file or to compare its use to the use of the compressed rates file information. This is an issue for data users to explore for themselves.
Important variables for understanding rates
Payer. The name of the plan sponsor of health insurer. Rates reported for four payers, Aetna, Anthem, Cigna, and United Healthcare are used in this paper.
Network. This is the plan for which the in-network rates are negotiated.
Negotiation arrangement. This is the type of payment arrangement applicable to a rate (i.e., fee-for-service, bundle, capitation). Except for the specific discussion of bundled rates, all of the examples in this paper are based on rates for fee-for-service arrangements.
Billing class. This distinguishes between “professional” rates (reimbursing individual health care providers delivering services) and “institutional” rates (reimbursing institutions for services provided by the institution). The schema also permits rates to be classified as “both” but no rates with that billing class are included in these examples.
Negotiated type. This is the manner in which a rate is paid and is important for determining how the provider is reimbursed and whether two or more rates can be compared. The schema has five types of negotiated rates: “negotiated” is a dollar amount for a service, “percentage” is a percentage of billed charges, “per diem” is a dollar amount paid each day for a service, “derived” is an amount that a payer assigns to an item or service for internal accounting, reconciliation with providers or submitting data in accordance certain federal requirements relating to risk adjustment and capitated rates (45 CFR 153.710(c)), and “fee-schedule” which are amounts used to determine cost-sharing liability when the amount is different than the negotiated rate.
Billing code type. This refers to the different types of billing codes, such as MS-DRGs. CPT, HCPCS, revenue codes (RC). There is a permitted list in the schema: price-transparency-guide/schemas/in-network-rates at master · CMSgov/price-transparency-guide, which includes a custom billing code type that permits payers to define a rates for all possible billing code types under an arrangement.
Billing code. This is the code the payer uses to identify the item or service for which the rate applies. The examples and the discussion in the paper use rates reported with MS-DRGs and HCPCS/CPT codes. Unless otherwise noted, the rates with HCPCS/CPT codes used in the examples have no billing code modifier for the reported rates (the field is blank). There is also a discussion of the use of custom codes by United Healthcare and Cigna.
Description. A string with a simple description of the item or service. Often this is based on the title or description applied by the maintainers of the code.
Service code. This is the CMS place of service code which is used to describe the setting where an item or service is provided (e.g., emergency room, inpatient hospital, office). It is required only for rates for professional items or services, but some payers use it for institutional rates as well. Some payers report this as a string of places which might include 40 or more settings.
Negotiated rate. This is the amount of the reported rate. It can be a dollar amount or a percentage. [Return to brief]
Provider name. This is the name associated with the NPI by Turquoise Health. It is sometime but not always the same as the name the provider has in the NPPES data.
NPI. The national provider identification number reported with the rate.
NPI type. There are two general types of NPIs: Type 1 NPIs are for individuals, and groups of individuals; Type 2 NPIs are for organizations, such as agencies, group practices, ambulatory health care facilities, and hospitals. Organizations can have more than one Type 2 NPI.
Classification. This is the type of provider from the NPPES data. The categories differ for Type 1 and Type 2 providers. (Taxonomy)
Specialization. This is a provider’s area of specialization in the NPPES data. This field can be blank.
TIN. The tax identification number reported with the rate. In some cases, this can be the NPI.
Additional information. This is a field where payers can provide additional context about an arrangement or a rate.
Sample billing codes used in this analysis
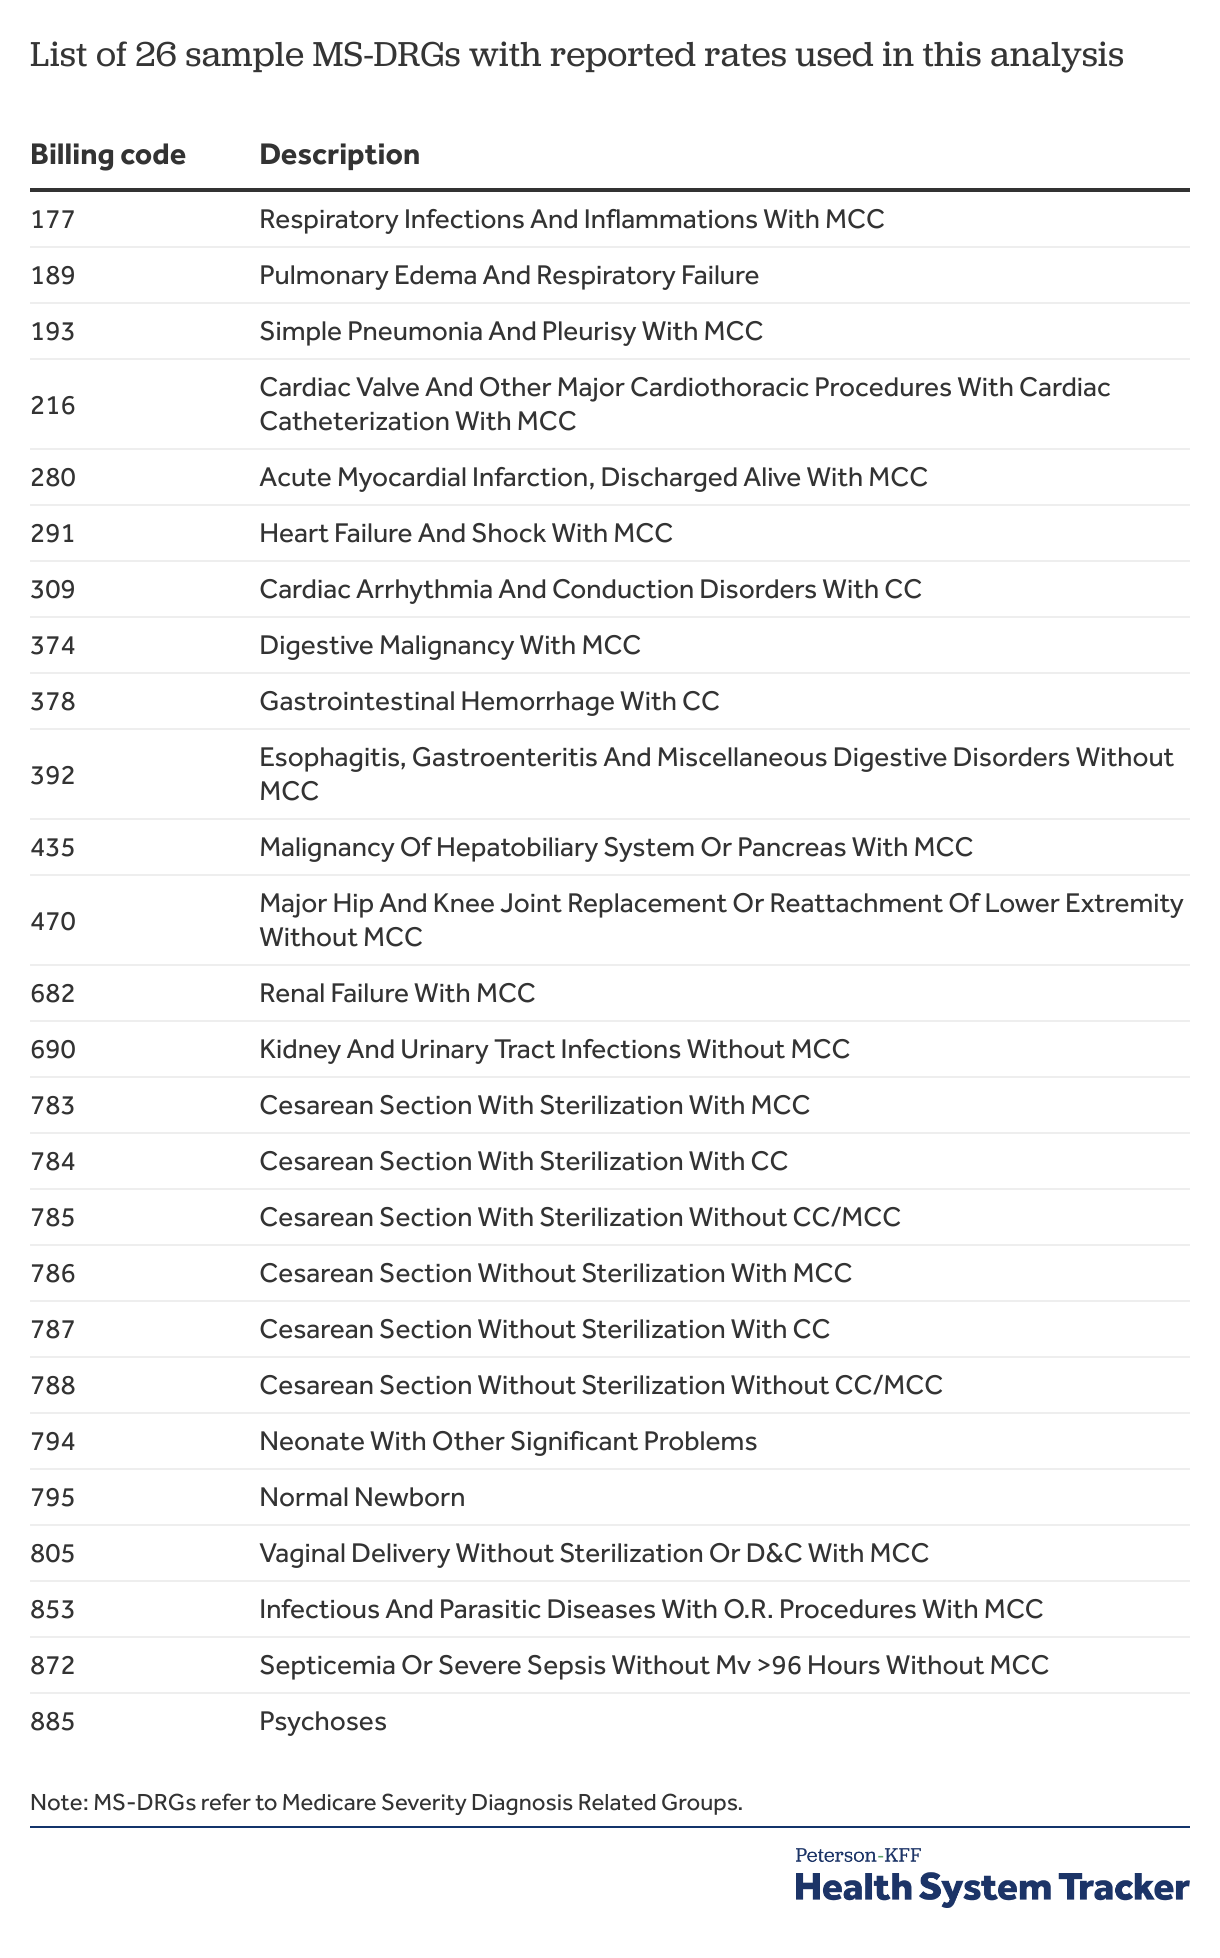
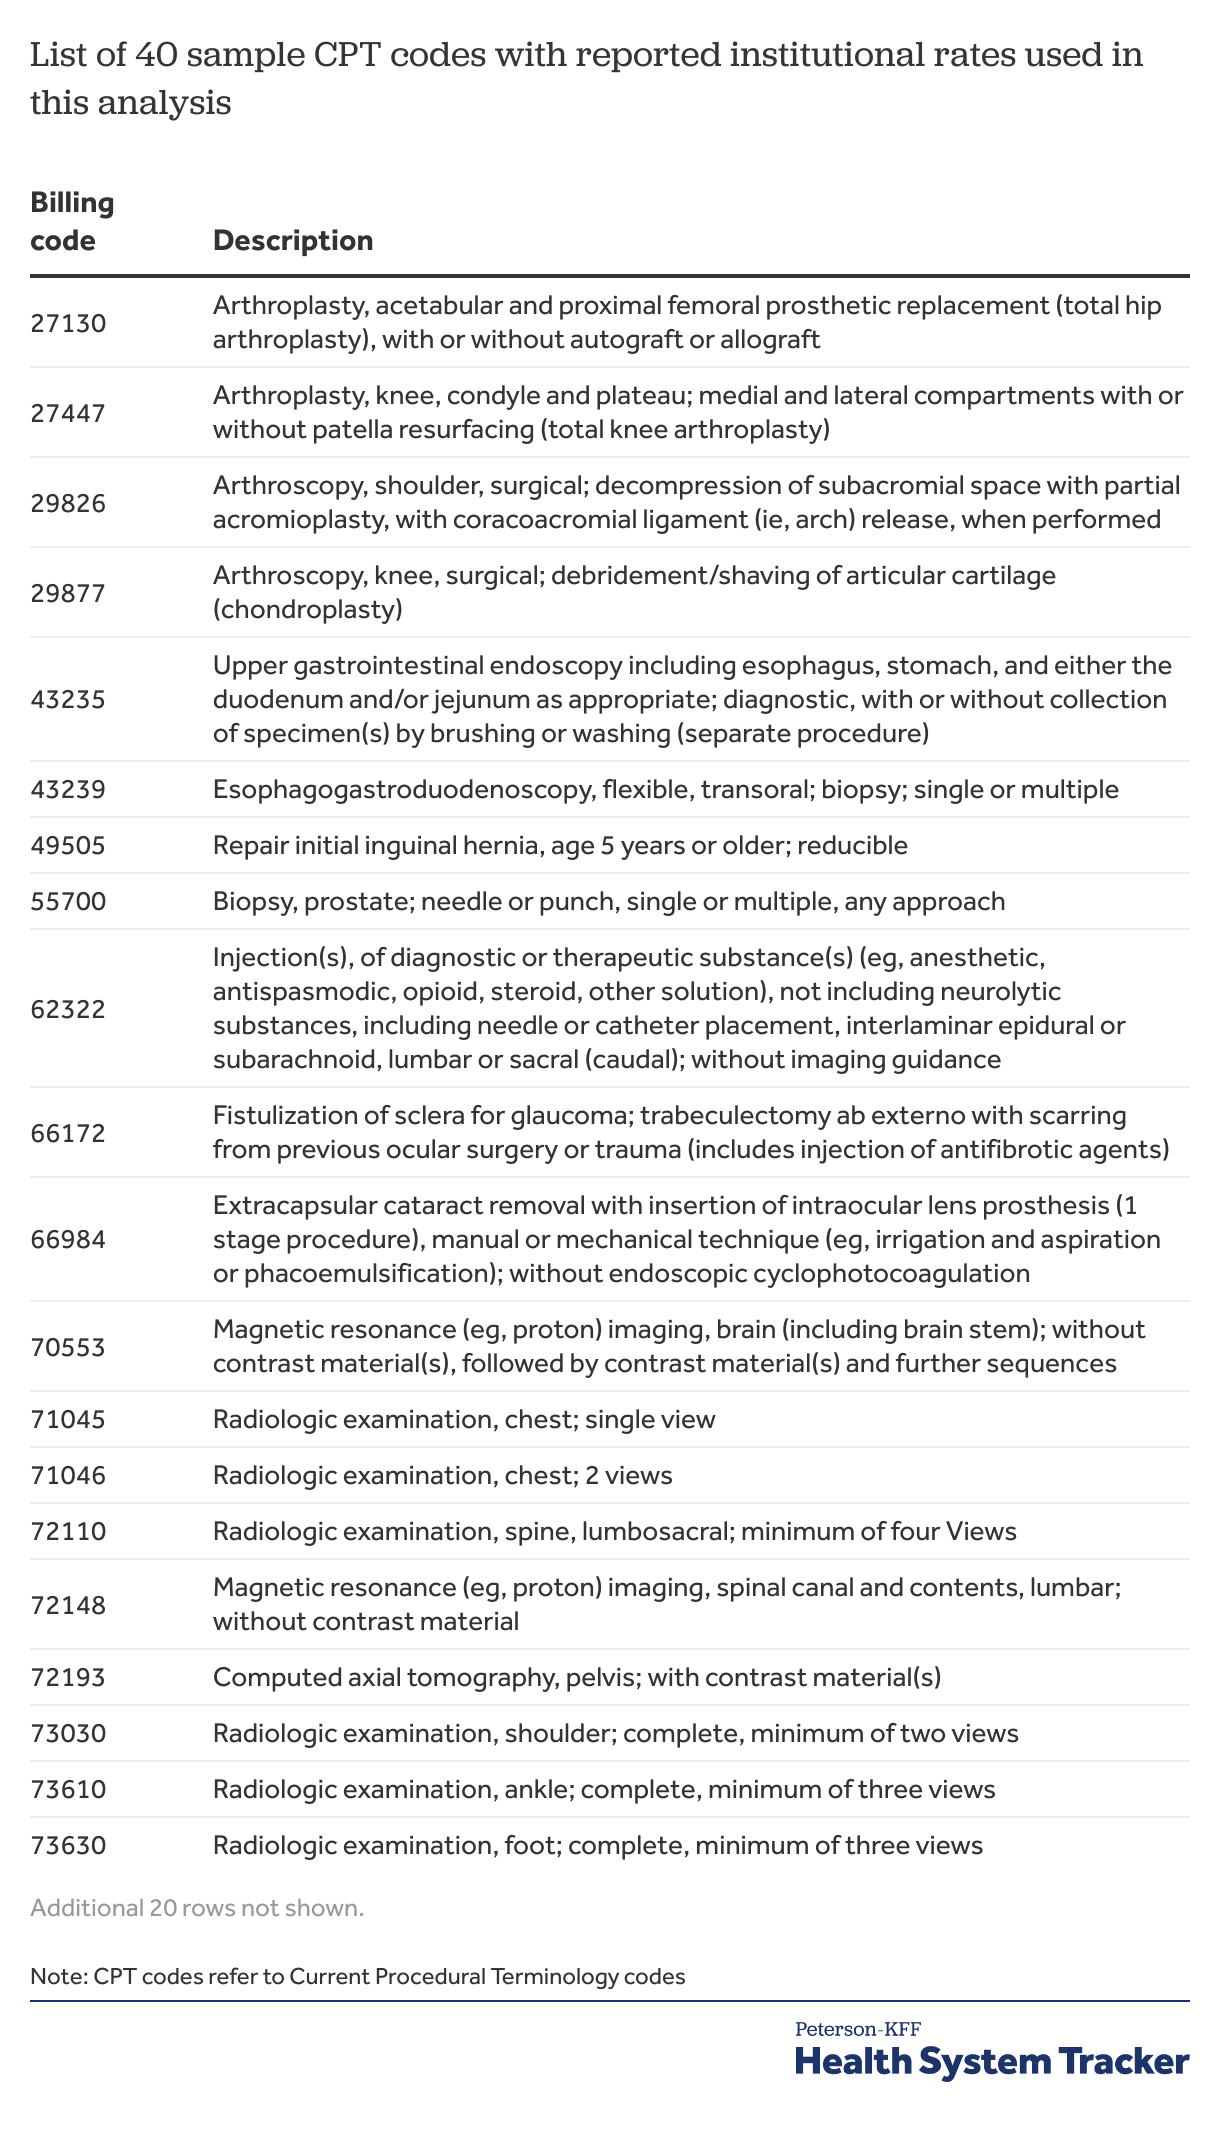
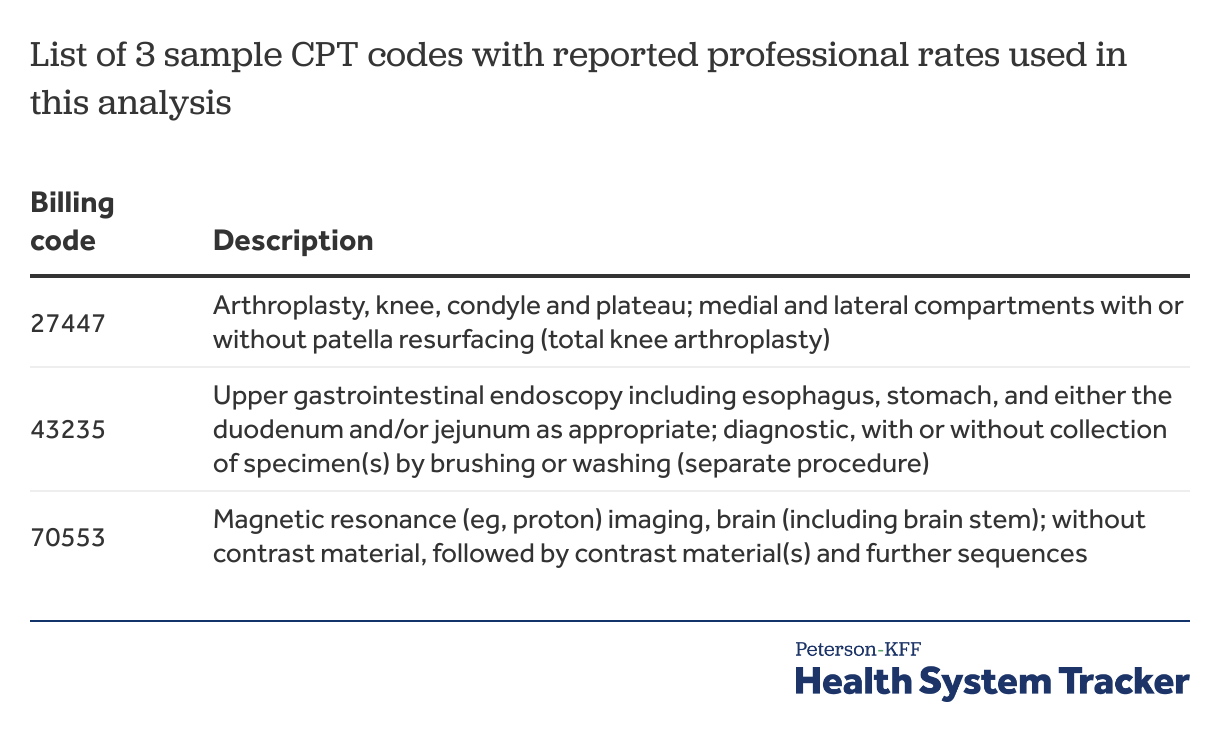
Footnotes
[1] This estimate comes from an article on Turquoise Health’s website received in an email from the group. Readers will need to create an account to view the article.
[2] Facilities such as hospitals typically have multiple national provider identifiers (NPIs) that are created for different parts or units of the facility. The TiC data identifies providers by NPIs as well as by their tax identification number.
[3] A national provider identifier (NPI) is an identification number that health care providers obtain from CMS to be used for claims and other electronic transactions. Type 1 NPIs are for individual providers and Type 2 NPIs are for organizations.
[4] This means the reported rates have the same negotiation arrangement, billing class, tax identification number and service code.
[5] These two examples refer to the reporting of multiple rate values (dollar values) for one NPI with a general acute care hospital taxonomy for many networks at the named hospitals. In fact, each payer reported multiple rates for these networks for these MS-DRGs for multiple general acute care hospital NPIs at these addresses.
[6] In a few cases United Healthcare added additional specifications in the additional information field when two dollar values were reported. This is not always the case, for example, this field was blank for MS-DRG rates reported with the New York-Presbyterian Hospital just discussed.
[7] Providers designate their type, area of practice, and area of specialization from a taxonomy that is part of the registration process.
[8] The first example is based on the pattern of reporting for many MS-DRGs by United Healthcare for The Mount Sinai Hospital. United Healthcare also reported the same rates for the same networks for another NPI at the same address. This last scenario is based on the pattern of reporting for many MS-DRGs by United Healthcare for the New York-Presbyterian Weill Cornell Medical Center, where United Healthcare reported multiple rates for the same network for multiple NPIs, and where the patterns of rates within networks varied across the different NPIs.
[9] Cigna does report rates for a custom billing code type for some hospitals and other providers that apply a percentage rate to “All other codes”, with a notation in the additional information field that says either “Outpatient services not otherwise priced” or “Inpatient services not otherwise priced”. These rates might be the negotiated rate to go along with the fee-schedule rates in some situations, although it does not report the rate with the inpatient note for some hospitals for which it reports fee-schedule rates for MS-DRGs.
[10] Derived and fee schedule rates are described more below. A derived rate may be used for alternative payment arrangements, such as capitation, where there is no negotiated rate for that service; the payer is directed to estimate what the negotiated amount would be if they do this as a normal part of their business. A fee schedule rate here means the amount that is used for determining out-of-pocket liability for participants and that it is different than the negotiated rate. A fee schedule rate should be reported along with the negotiated rate and, if there is not one, a derived rate unless no derived rate is produced by the payer in the normal course of business.
[11] In some cases, individual providers may use their social security numbers at their TINs. Payers in these cases may include the providers NPI in the TIN field.
[12] It is the Departments’ understanding that negotiated rates for items and services are based on the unique combination of a provider (NPI), service or item location (Place of Service Code), and the TIN under which the provider is furnishing the item or service.
[13] Although the preamble to the final rule discusses the importance of place of service codes in defining negotiated rates, the schema only requires place of service codes to be included when the billing class is “professional”. Nonetheless, some payers include them for institutional rates while others do not. Generally, for the examples in this paper rates have not varied by service code within a payer for a billing code. The payers do report place of service codes differently, which is discussed below.
[14] A third situation where multiple rates occurs for those using older months of data from Turquoise Health data is when the network field contains the word “Unlabeled.” This occurred for some rates filed by Anthem for at least January and February 2024, and resulted from a labeling practice by Turquoise Health for cases where they could not identify reliable network labels for Anthem. This process was stopped in early 2024. In these earlier files, however, there are multiple rate situations for rates reported by Anthem where with network as NY Unlabeled.
[15] In this case, the parent_org_name variable added by Turquoise Health includes a number of the NPIs in the Mount Sinai Health System that have different rates for this billing code. A second variable added by Turquoise Health, hms_org_name, would have grouped the hospital and the ambulatory surgical center NPI but would not have included all of the hospital units. Neither would have identified the NPIs that share the rates shown in the table.
[16] There may be instances where a place of service code localizes a rate within an institution. It is not a required field for institutional rates in the schema, although some payers use it. In the case of these tables there was no difference within payers for the service code reported for the different subparts of the hospitals. In Table 12, for example, Anthem reported service code “[‘22’]” for each of the negotiated rates, Aetna reported the same service code string “[‘01’,‘06’,‘08’,‘12’,‘19’,‘20’,‘22’,‘23’,‘24’,‘25’,‘26’,‘27’,‘41’,‘42’,‘50’,‘52’,‘53’,‘57’,‘58’,‘60’,‘62’,‘65’,‘99’]” for each negotiated rate, and Cigna reported no service code; in all cases there was no variance based on provider classification or specialization.
[17] “Where a plan or issuer uses an alternative reimbursement arrangement and does not have a negotiated rate, as defined in the final rules, the plan or issuer would be required to publicly disclose through the In-network Rate File the derived amount, to the extent the plan or issuer generates such an amount in the normal course of business.” — Transparency in Coverage, Federal Register / Vol. 85, No. 219 / Thursday, November 12, 2020 / Rules and Regulations p 72227
[18] Cigna does report many institutional rates for the sample CPT codes for type 1 NPIs and some of these are derived rates.
[19] See for example: https://www.serifhealth.com/blog/technical-exploration-of-mrf-postings-how-useful-is-negotiated-type
[20] Rates reported as fee schedule rates are not included in the counts for Aetna, Anthem or Cigna. United Healthcare only reported rates with the rate type “negotiated” for the 11 sample CPT codes.
[21] The custom codes appear to vary somewhat across these cities, both in number and in name.
[22] Email communication with Turquoise Health.
The Peterson Center on Healthcare and KFF are partnering to monitor how well the U.S. healthcare system is performing in terms of quality and cost.