This chart collection explores National Health Expenditure (NHE) data from the Centers for Medicare and Medicaid Services (CMS). These data offer insights into changes in health spending over time in the U.S., as well as the driving forces behind spending growth. The data specifically show how healthcare spending changed in 2024. A related interactive tool contains more of the latest NHE data, and a companion chart collection compares U.S. spending to peer countries.
Total health expenditures continued to increase rapidly in 2024
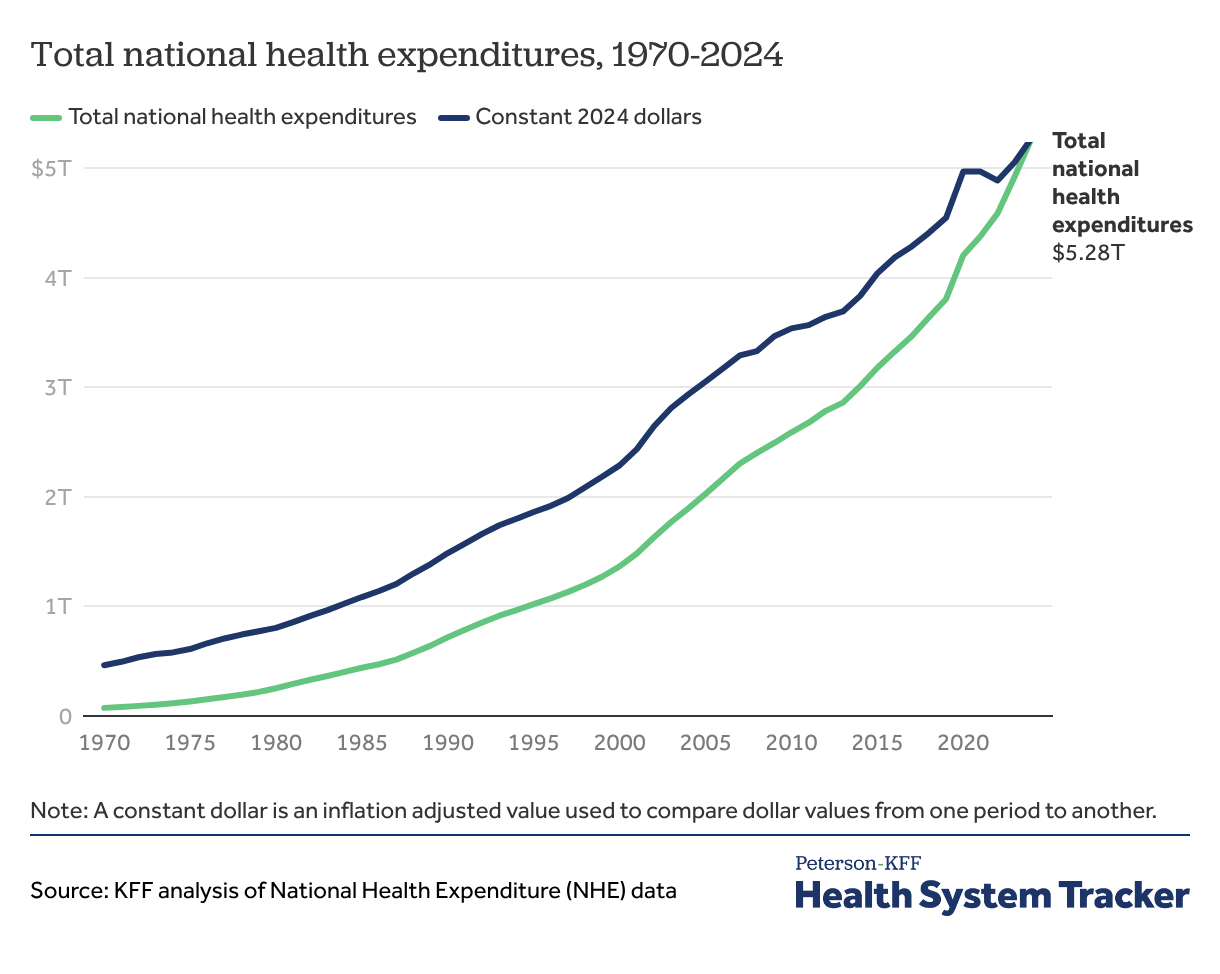
Health spending totaled $74.1 billion in 1970. By 2000, health expenditures had reached about $1.4 trillion, and in 2024 the amount spent on health more than tripled to nearly $5.3 trillion. In the first year of the COVID-19 pandemic, health spending accelerated by 10.5% from 2019 to 2020. Health spending increased by 7.2% from 2023 to 2024, similar to the 7.4% increase from 2022 to 2023 but faster than the 4.8% increase from 2021 to 2022. The growth in total health spending from 2023 to 2024 is well above the average annual growth rate of the 2010s (4.2%).
Total health expenditures represent the amount spent on healthcare and related activities (such as administration of insurance, health research, and public health), including expenditures from both public and private funds.
In the chart above, spending is shown in terms of both nominal dollar values (not inflation-adjusted) and constant 2024 dollars (inflation-adjusted based on the personal consumption expenditures (PCE) index. Adjusting for economywide inflation, national health spending increased 4.4% in 2024 from the previous year. The federal actuaries deflate health spending in their report using an aggregate of healthcare-specific consumer and producer price indices for specific commodities or services. Using the NHE deflator, real national health expenditures increased by 4.6% from 2023 to 2024.
Annual per person health spending reached $15,474 in 2024
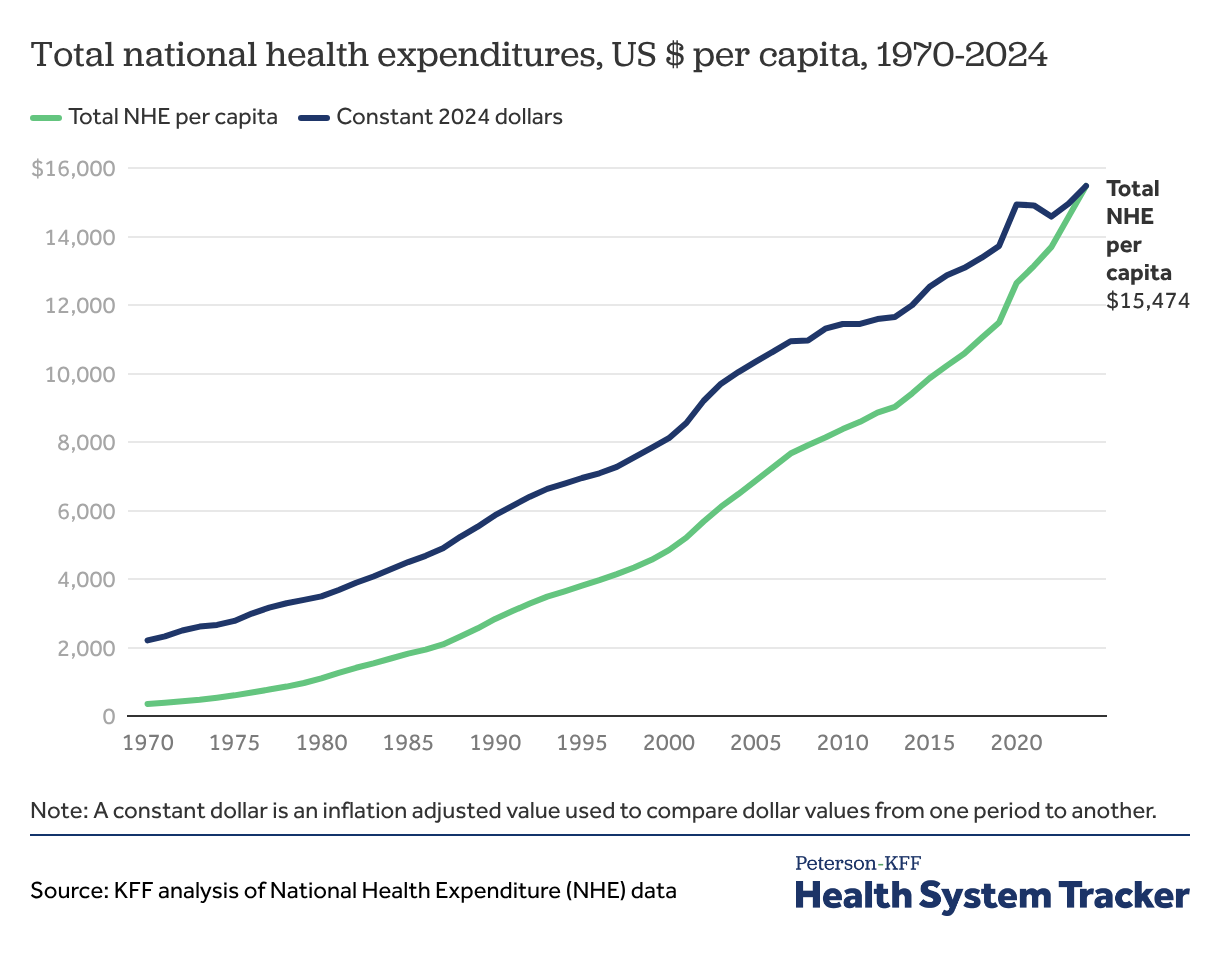
On a per capita basis, total health spending, including government, private, out-of-pocket, research, and infrastructure spending, has increased in the last five decades from $353 per year in 1970 to $15,474 per year in 2024. In constant 2024 dollars, the increase was from $2,208 in 1970 to $15,474 in 2024.
Health spending as a share of GDP increased in 2024
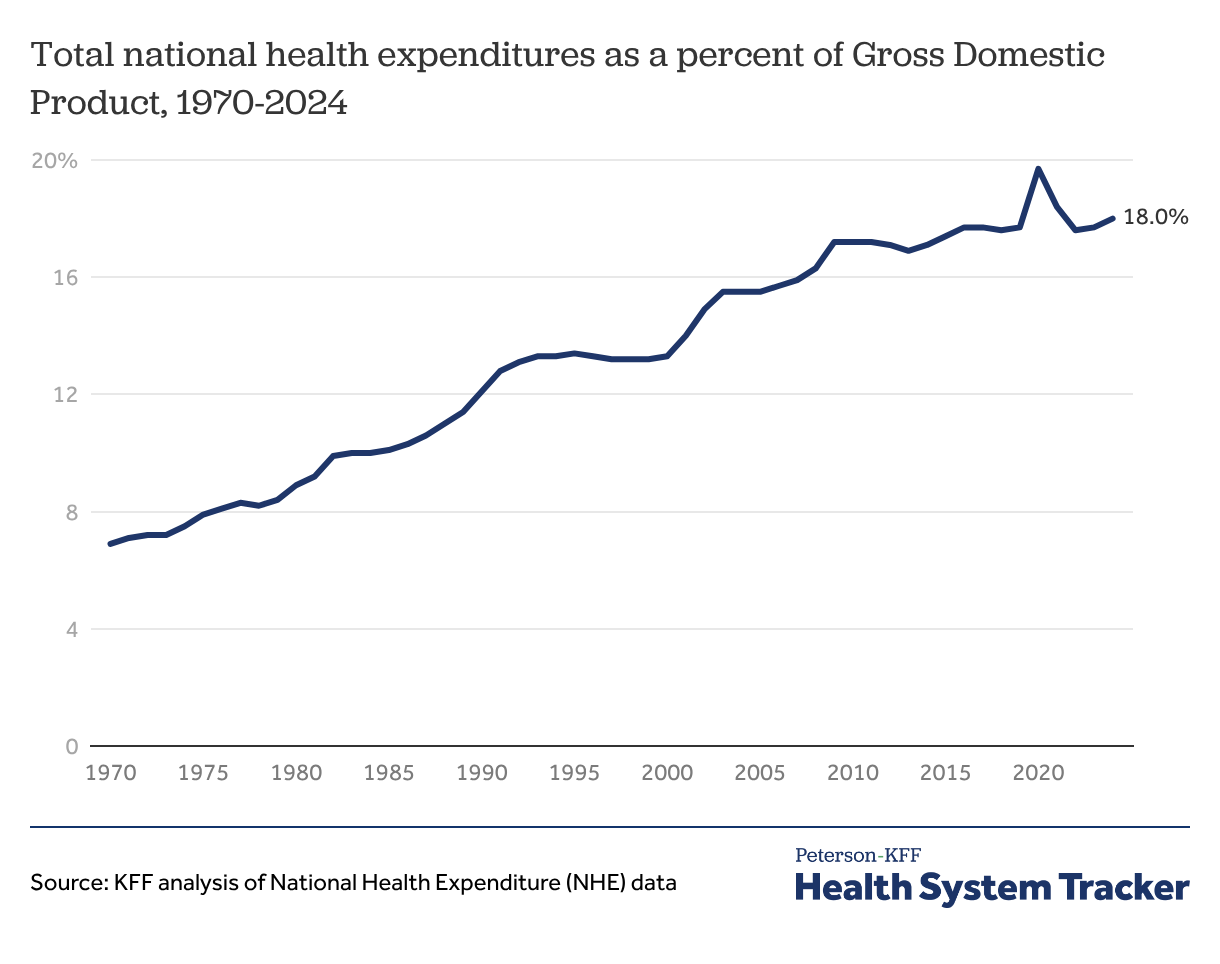
Health spending as a percent of gross domestic product (GDP) reached 18.0% in 2024, an uptick from 17.7% in 2023 as health spending grew faster than GDP.
The share of the economy devoted to healthcare peaked at 19.7% in 2020 amid increasing health spending and declining GDP during the COVID-19 pandemic. Total national health expenditures as a share of GDP declined through 2022 as the economy recovered and health spending increased more moderately. Since 2022, health spending has represented a similar share of the economy as it did prior to the COVID-19 pandemic.
Health spending growth slowed in recent decades but consistently exceeded GDP until the 2020s
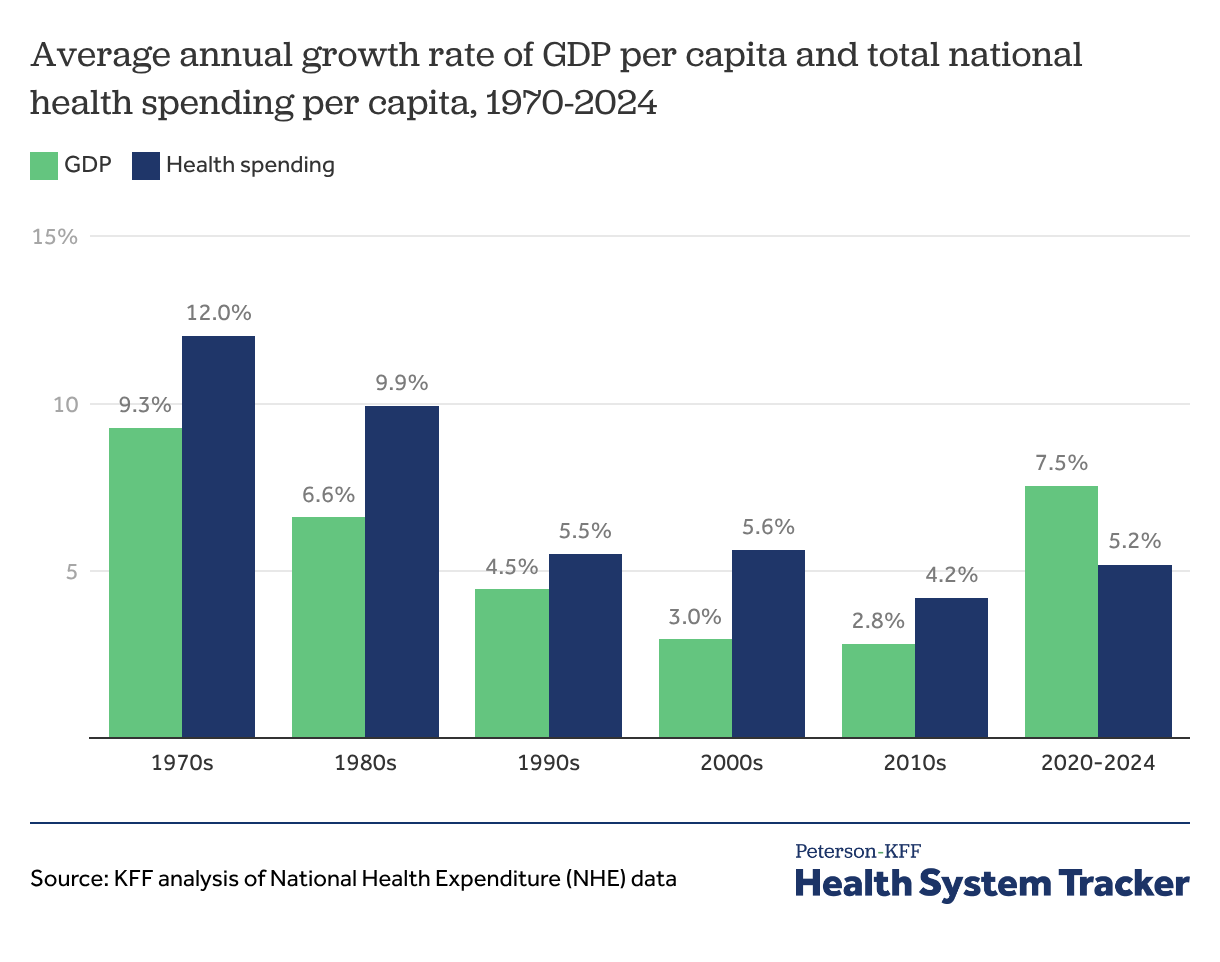
From 1970 through 1980, the average annual per capita growth in the U.S. economy was 9.3% per year, compared to per capita health spending growth of 12.0%. Although the health spending growth rate has since moderated, it generally continues to outpace growth of the economy. After a period of recession during the first year of the COVID-19 pandemic, the economy recovered in 2021. Since 2020, GDP per capita has increased at an average rate of 7.5%. Per capita national health expenditures increased by an average 5.2% compounded annual growth rate from 2020 to 2024.
Since 2020, retail prescription drugs spending grew faster than hospital and physician service spending
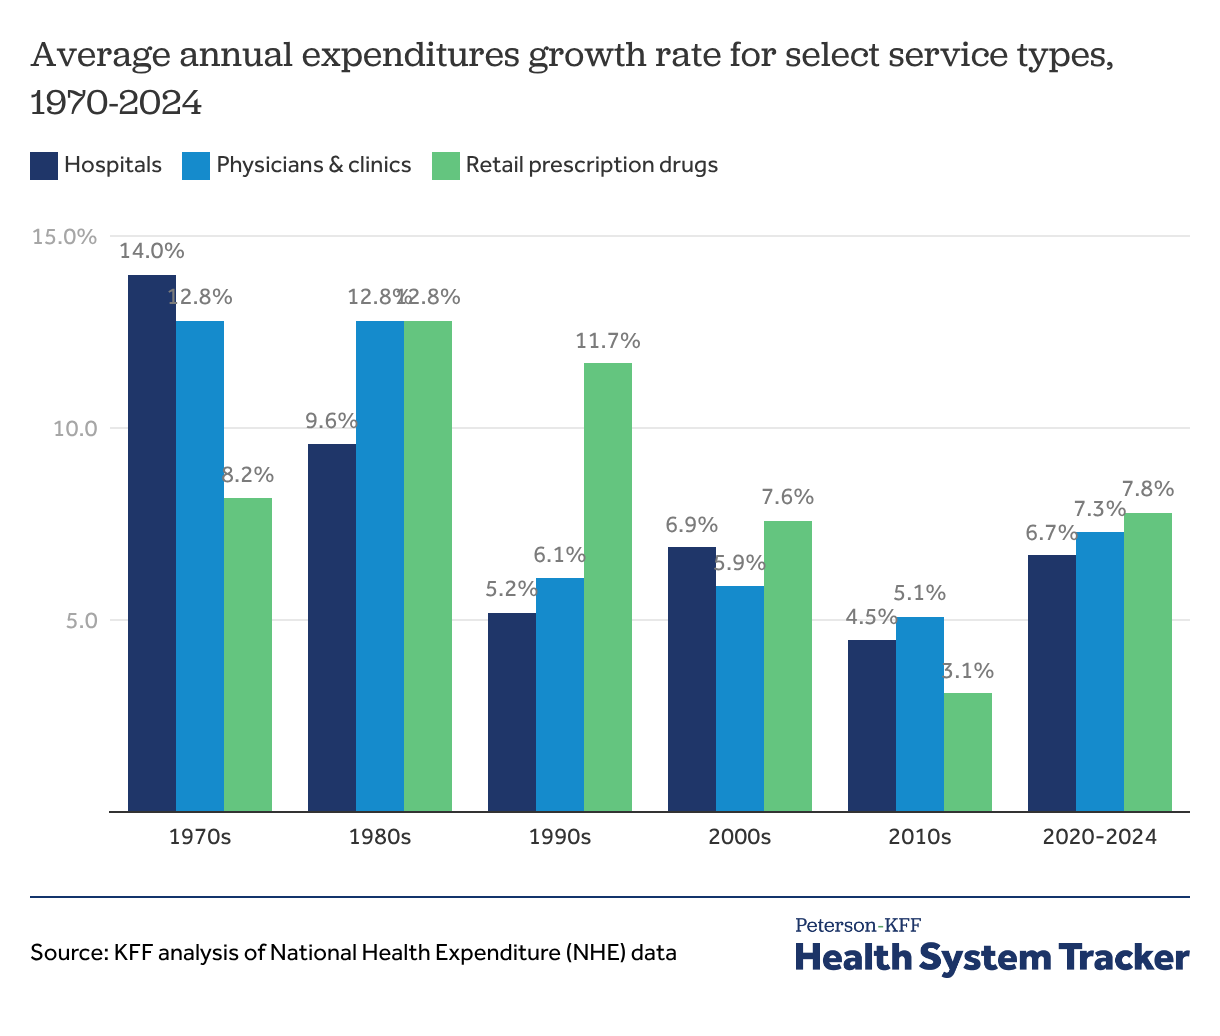
During the 1970s, growth in hospital expenditures outpaced other services, while prescriptions and physicians/clinics saw faster spending growth during the 1980s and 1990s. From 2020 to 2024, retail prescription drugs experienced the fastest average growth in spending at 7.8%, following 3.1% compound annual growth from 2010 to 2020. Average spending growth for hospitals and physicians/clinics between 2020 and 2024 was 6.7% and 7.3%, respectively.
Hospital and physician services represented half of total health spending
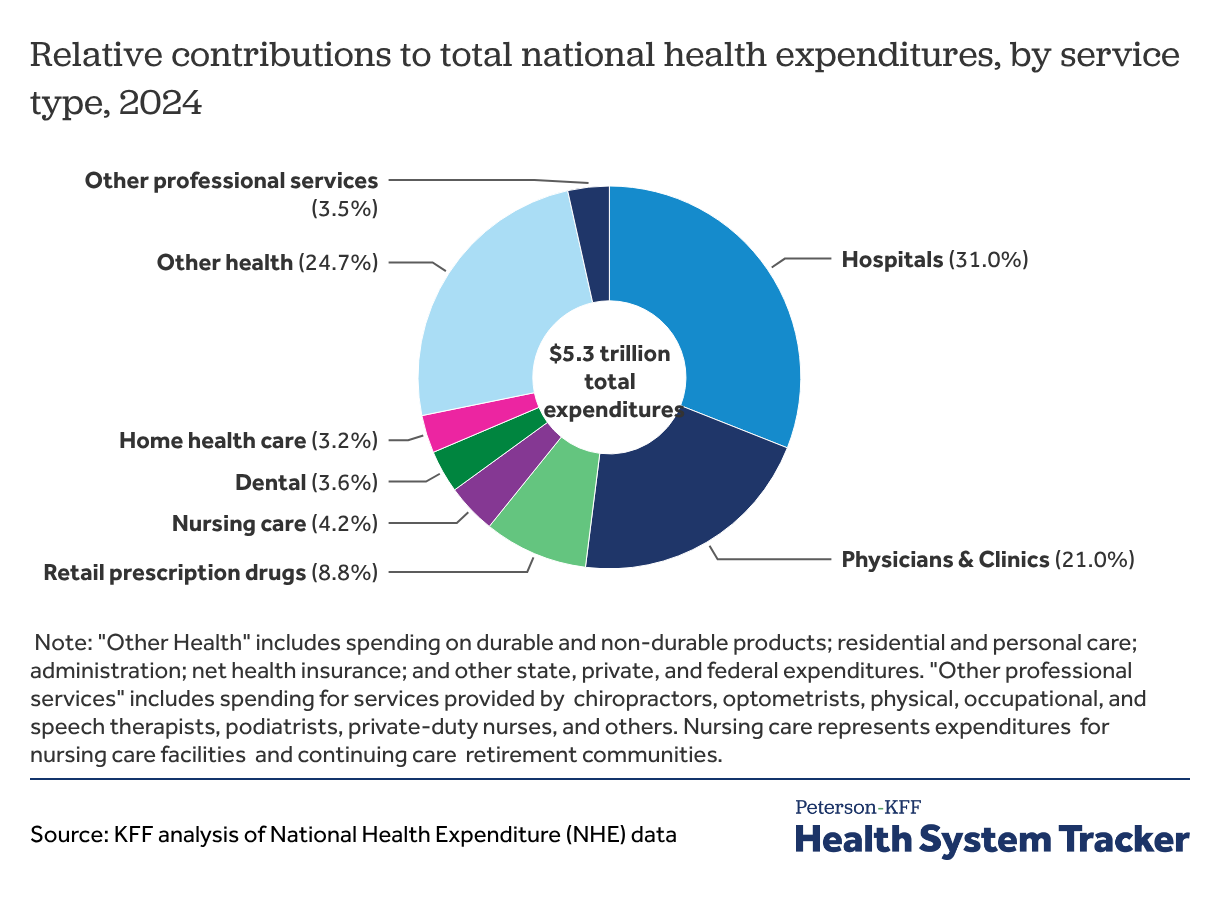
Hospital spending represented close to a third (31.0%) of overall health spending in 2024, and physicians/clinics represented 21.0% of total spending. Prescription drugs accounted for 8.8% of total health spending in 2024. These percentages stay relatively constant year-to-year.
Per capita out-of-pocket expenditures increased in 2024
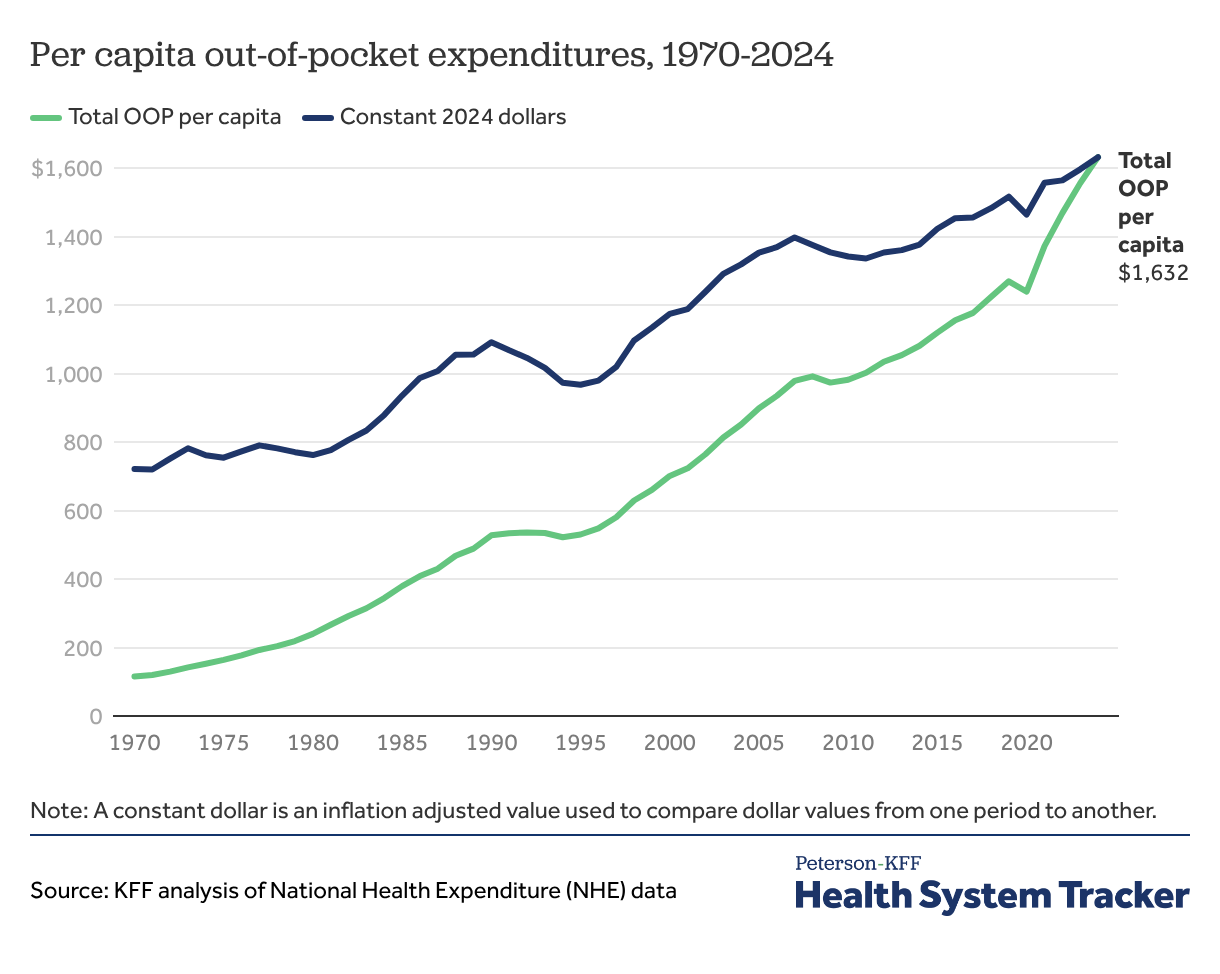
Out-of-pocket expenditures increased in 2024, averaging $1,632 per capita (out-of-pocket medical costs do not include the amount individuals contribute toward health insurance premiums). In 2024, real out-of-pocket spending also increased from the previous year from $1,596 to $1,632.
Related Content:
Health insurance represented about three-quarters of total health consumption expenditures
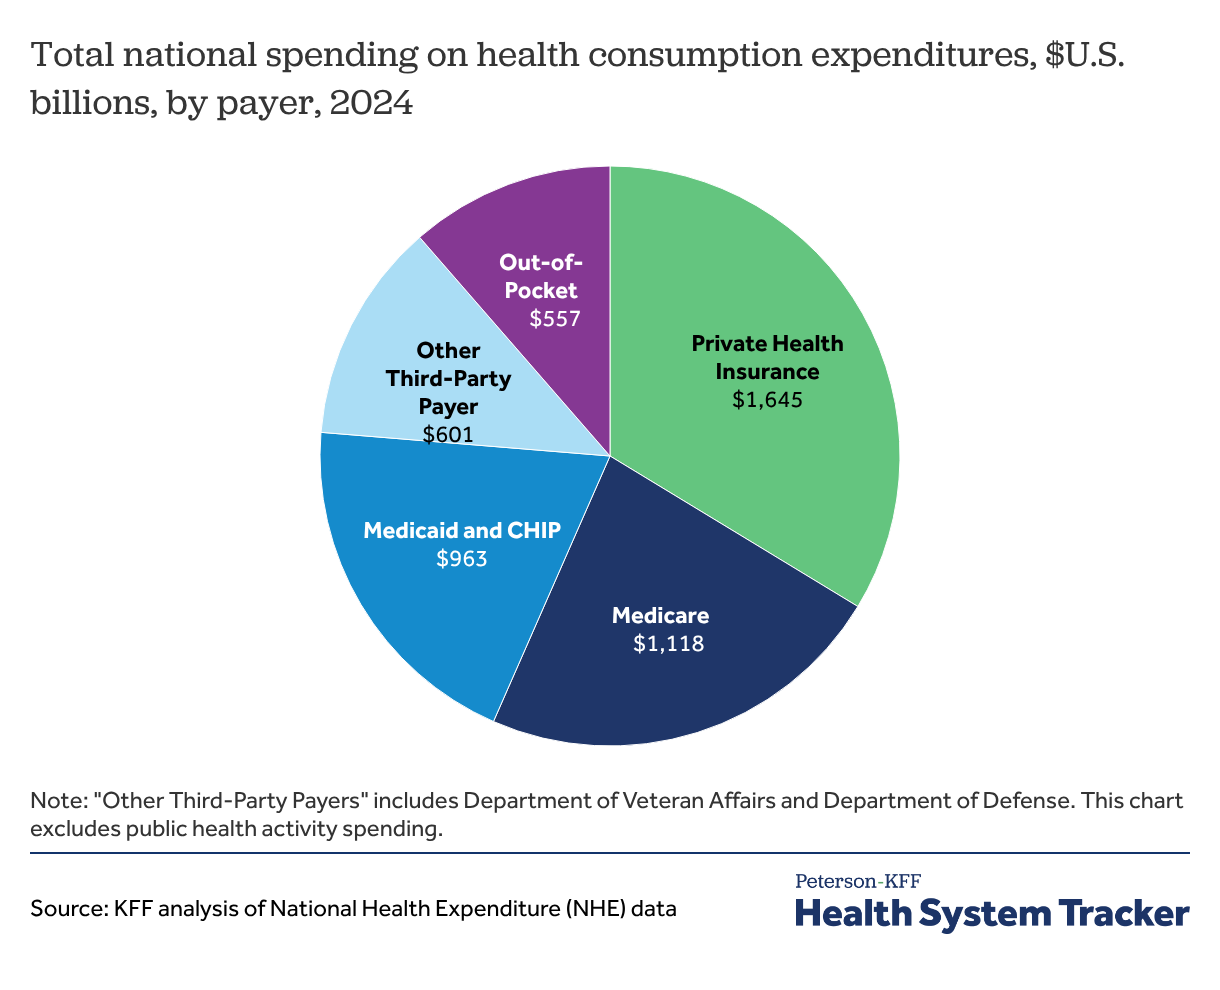
While private health insurance covers over half of the U.S. population (55%), it accounted for about a third of national spending (34%) on health consumption expenditures in 2024, excluding public health activity. Public health insurance programs managed in part by CMS, including Medicare, Medicaid, and the Children’s Health Insurance Program (CHIP), accounted for 43% of all health consumption spending. These programs often cover populations with higher healthcare utilization, including older adults, adults with disabilities, and lower-income people.
Out-of-pocket spending was a smaller proportion of health spending in 2024 compared to 1970
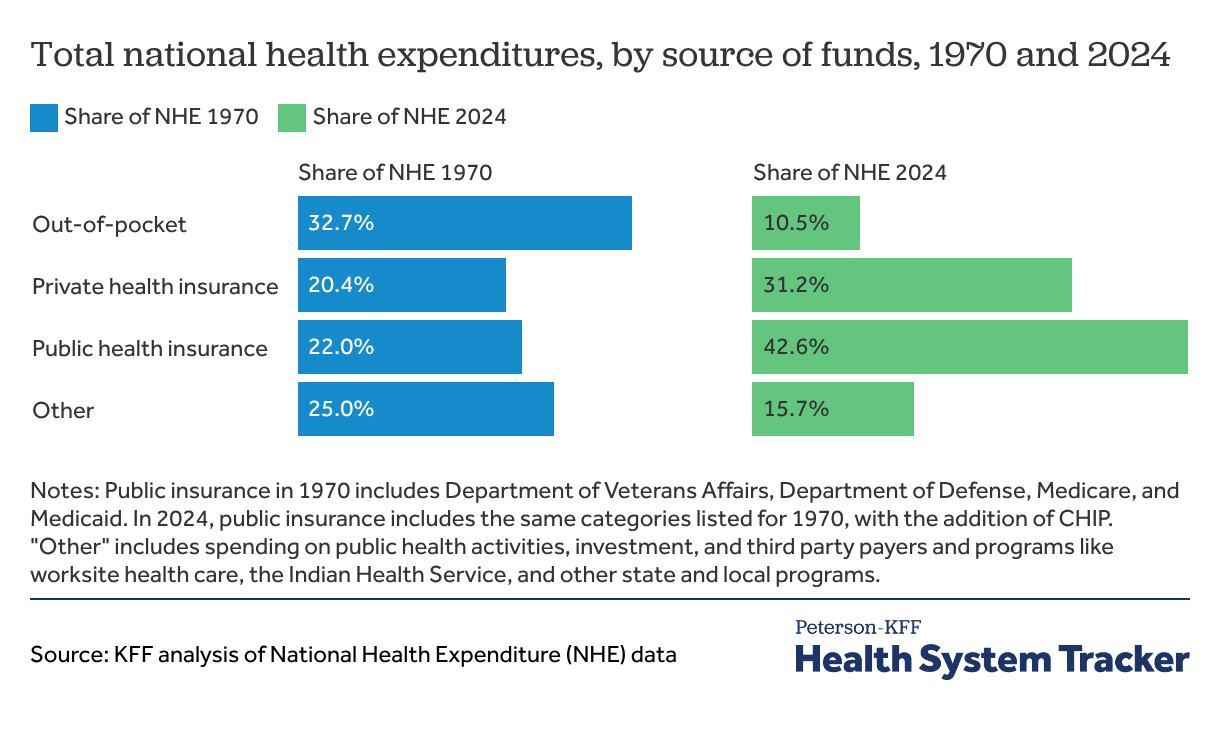
Private insurance expenditures now represent 31.2% of total health spending (up from 20.4% in 1970), and public insurance (which includes Medicare, Medicaid, CHIP, and the Veterans Administration and Department of Defense), represented 42.6% of overall health spending in 2023 (up from 22.0% in 1970). Although out-of-pocket costs per capita have increased in recent years, compared to previous decades, they now make up a smaller share of total health expenditures.
On a per enrollee basis, private insurance spending has generally grown faster than Medicare and Medicaid spending
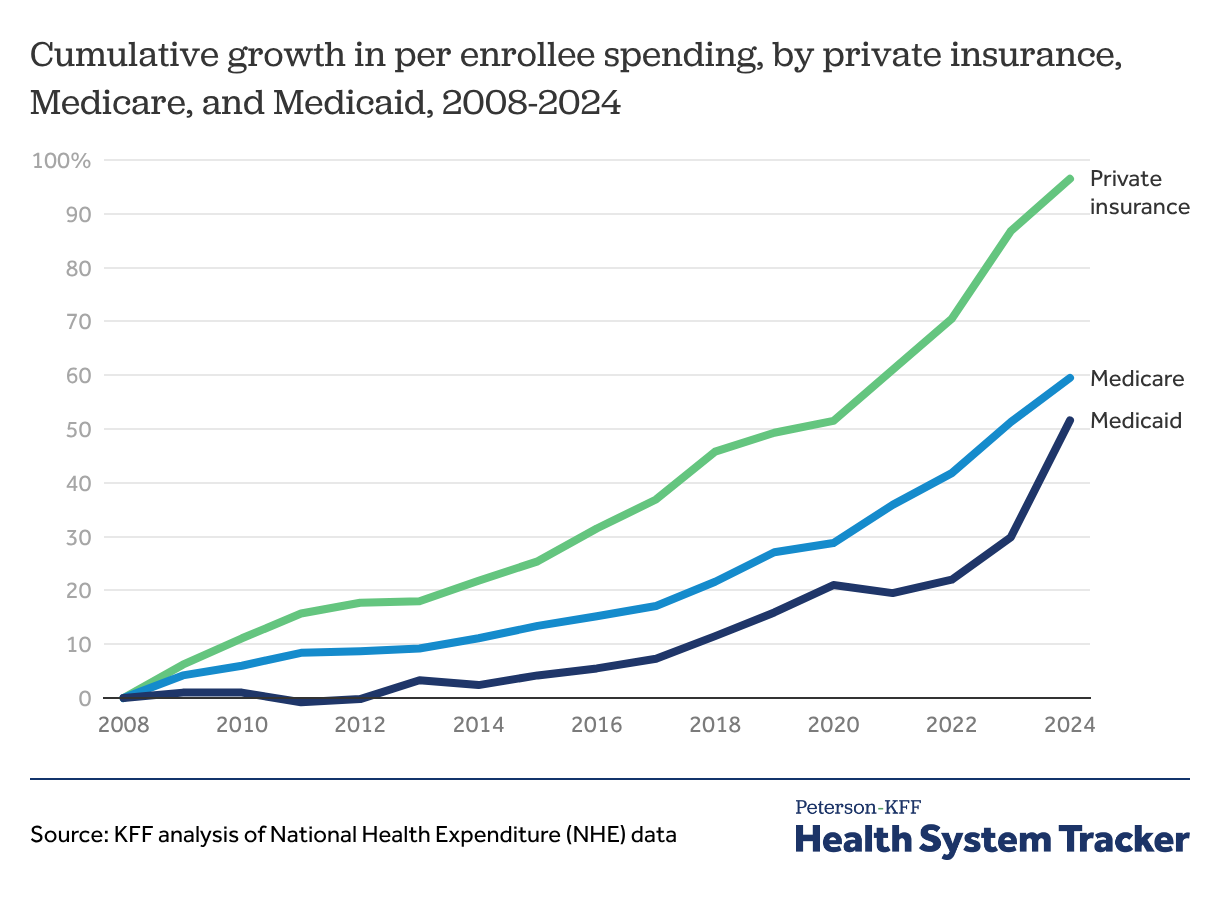
Per enrollee spending by private insurers grew by 96.5% from 2008 to 2024 — much faster than both Medicare and Medicaid spending growth per enrollee (59.5% and 51.6%, respectively). In general, private insurance pays higher prices for healthcare than Medicare and Medicaid.
Compared to the previous year, though, per-enrollee Medicaid spending rose by 16.6% in 2024, a large increase from 6.5% growth between 2022 and 2023. CMS attributes this growth to younger and healthier people disenrolling from the program through the Medicaid unwinding process, increasing provider rates, and increasing state-directed payments to providers through managed care organizations after a decline in per-enrollee spending in 2021.
Per-enrollee spending by private insurers rose by 5.2% in 2024, less than the 9.6% growth between 2022 and 2023. Similarly, per-enrollee spending by Medicare grew 5.4% in 2024, lower than the 6.7% growth in 2023.
Per-enrollee spending grew faster in the 2020s than in the 2010s across payers
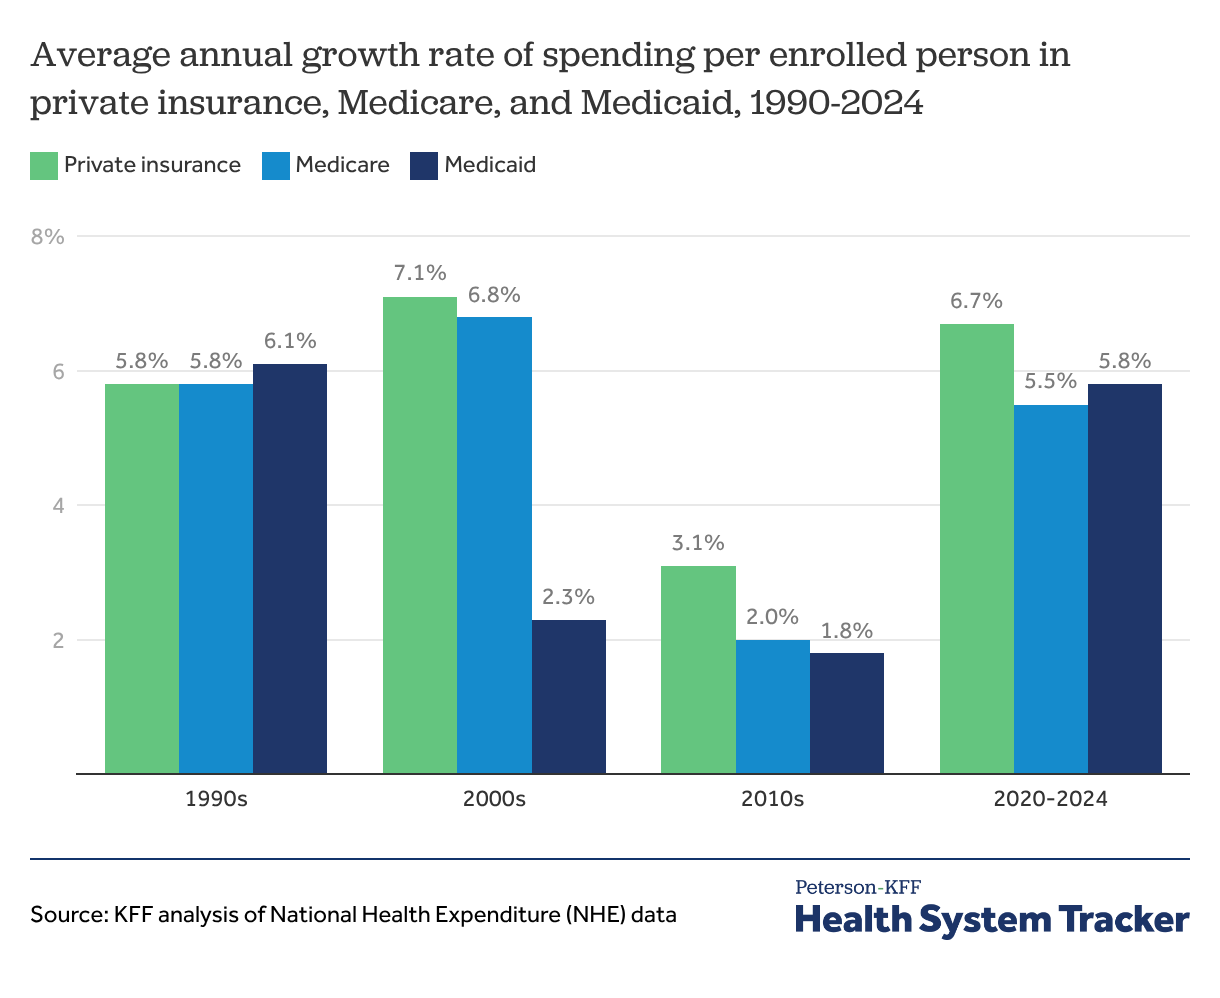
On a per enrollee basis, the average annual growth of Medicare spending was similar to that of private insurance over the course of the 1990s and 2000s. Average annual spending growth per enrollee in Medicaid was similar to growth for Medicare and private insurance in the 1990s but slowed in the 2000s. After a decade of slower growth for all major payers in the 2010s, per enrollee spending increased substantially, on average, for Medicare (5.5%), Medicare (5.8%) and private insurance (6.7%) between 2020 and 2024.
Almost half of health spending in the U.S. was by federal, state, and local governments
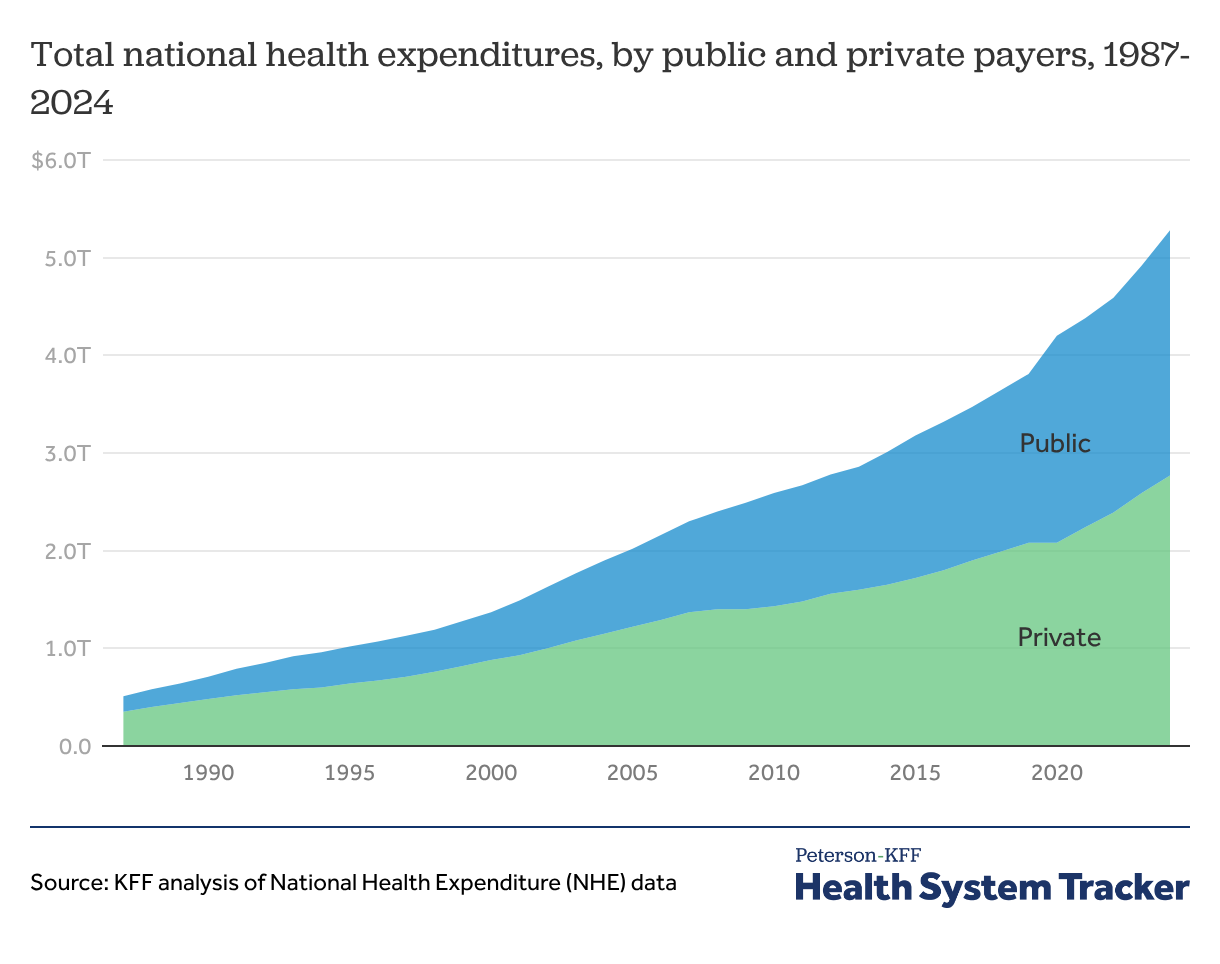
Public and private health spending have both continued to grow in the past few decades. Public spending in 2024 represented just under one-half (48%) of overall spending after briefly exceeding private spending in the first year of the pandemic. Public sector spending includes spending on insurance programs, such as Medicare and Medicaid, as well as other government spending, such as spending on public health and research.
Federal spending on public health decreased for the fourth straight year in 2024 but remained above pre-pandemic levels
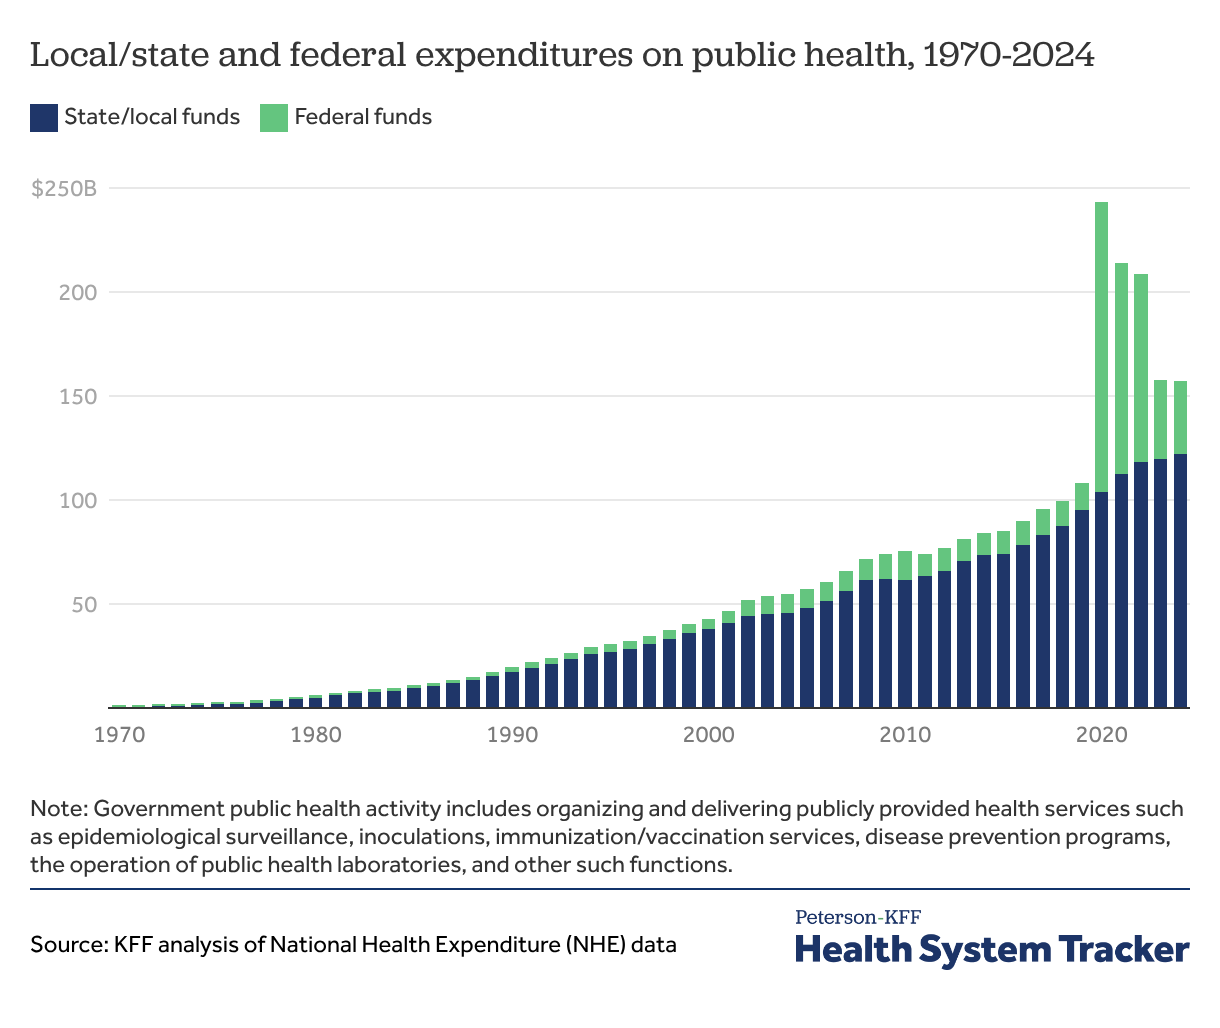
Spending on public health fell slightly from 2023 to 2024, following a sharp decline between 2022 and 2023 driven by the expiration of the COVID-19 public health emergency in 2023. Federal public health spending decreased by 6.3%, from $37.9 billion to $35.5 billion from 2023 to 2024. Meanwhile, state and local public health spending grew by 1.7%, in line with growth between 2022 and 2023.
Health insurance and administrative costs increased for decades but leveled off in recent years
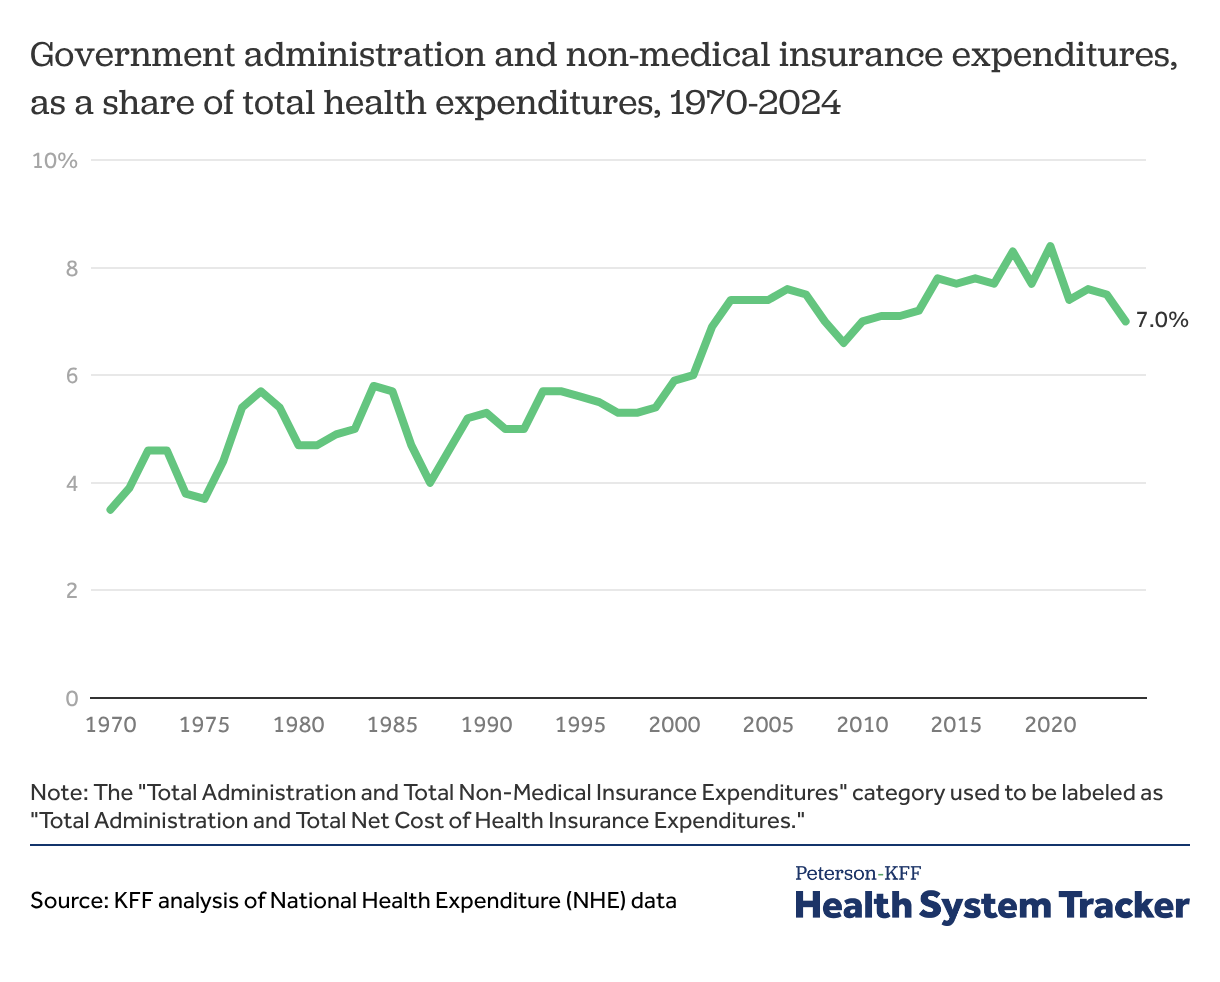
In 2024, administrative expenses – which include the cost of administering private insurance plans and public coverage programs but not the administrative costs of health providers – represented 7.0% of total national health expenditures, a decrease from 7.5% in 2023 and down from a peak of 8.4% in 2020.
Health services utilization increased at a higher rate between 2021 and 2024 compared to pre-pandemic utilization
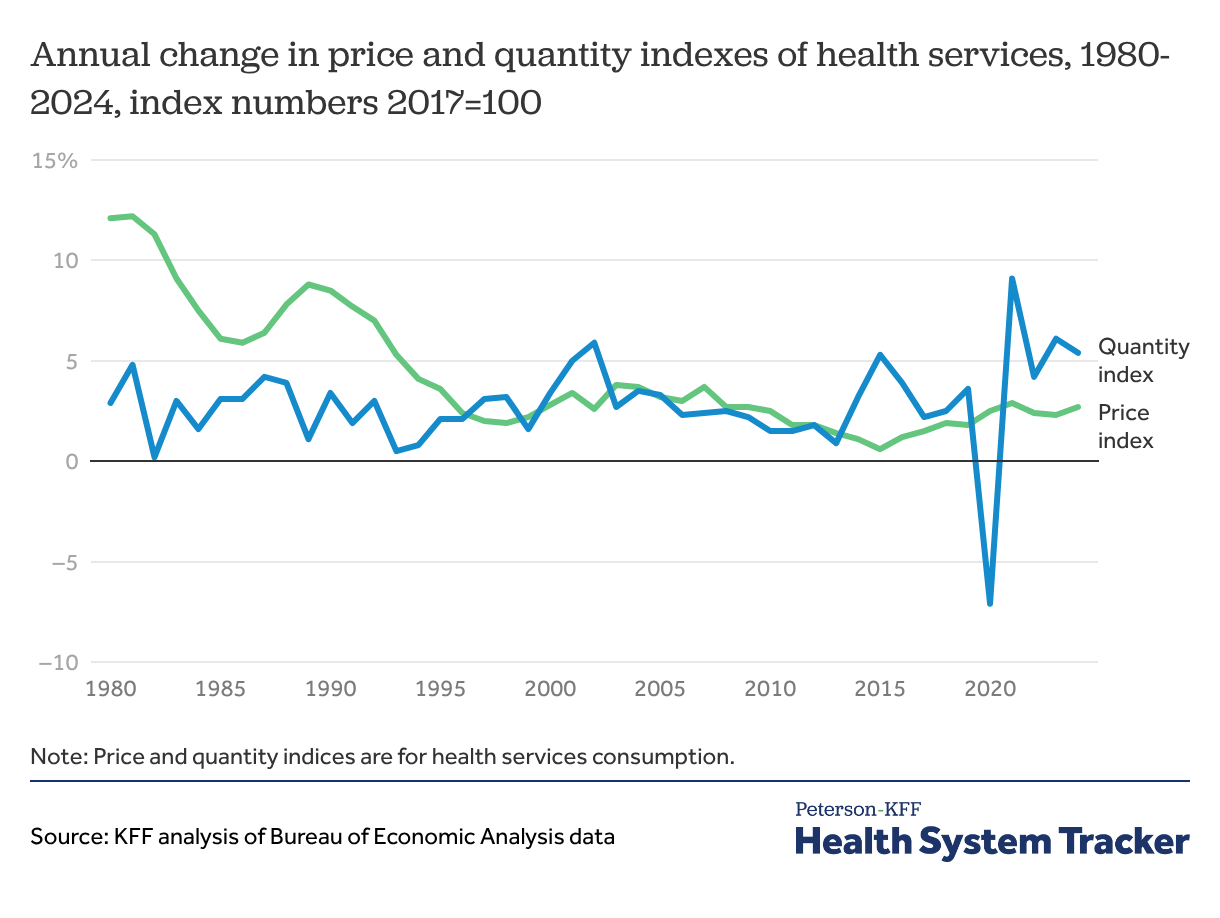
Health services spending is generally a function of prices (e.g., the dollar amount charged for a hospital stay) and utilization (e.g., the number of hospital stays). In 2024, healthcare prices increased by 2.7%, a slight uptick from 2.3% in 2023, but in line with recent years, while health services use increased by 5.4%, a drop from 6.1% in 2023 but still higher than typical pre-pandemic utilization increase levels.
Growth in price and utilization of pharmaceuticals varied over the past two decades
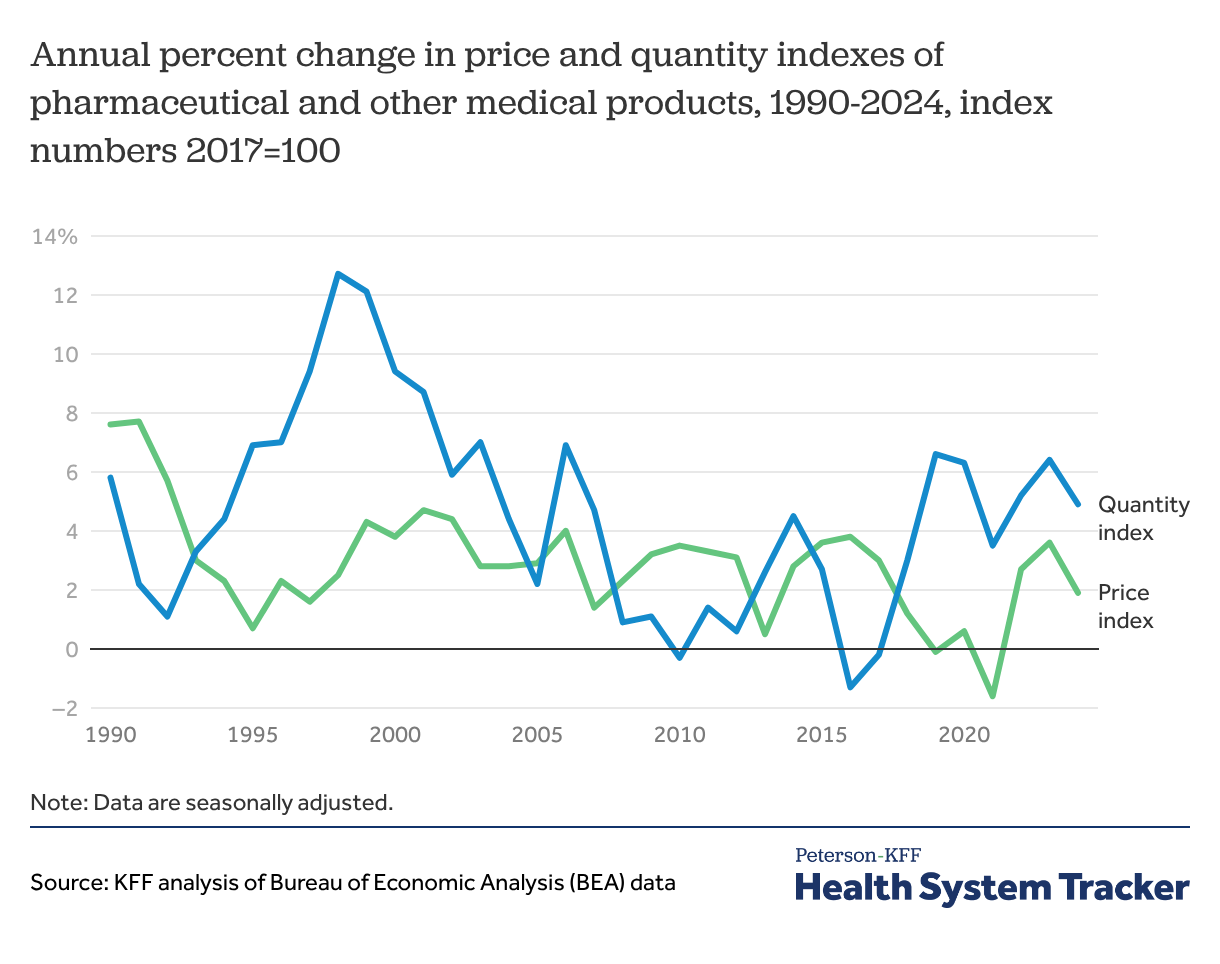
Due to the way drugs are selected for inclusion in the price index, it can take some time for new drugs to be reflected in the data. The price index for drugs grew steadily from the mid-1990s (ranging in growth from about 1% to 5% annually) before briefly declining around 2020. It increased by 1.9% between 2023 and 2024.
The growth in pharmaceutical product utilization between 2023 and 2024 (4.9%) was higher than the rates seen throughout much of the 2010s, though in line with growth in recent years.
National health spending per capita increased 6.1% in 2024 while general economic price inflation slowed
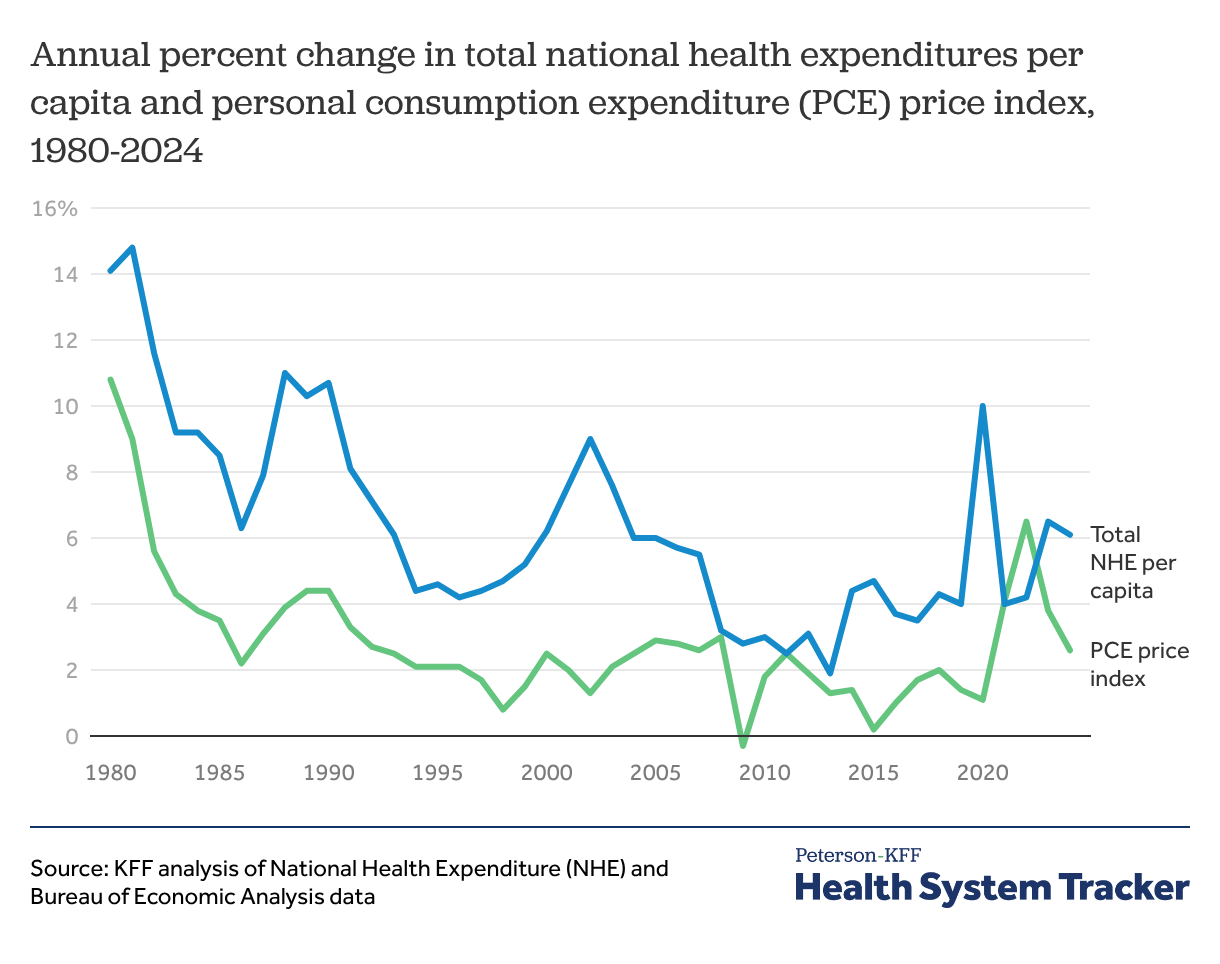
Health spending per capita increased by 6.1% in 2024, a drop from 6.5% in 2023, but still higher than 4.2% in 2022. The personal consumption expenditure (PCE) price index is a measure of inflation in prices paid by and on behalf of consumers that includes health care services and goods alongside other goods and services, including food, energy, and motor vehicles. The PCE grew 2.6% in 2024, a lower increase than was seen in previous years. In 2024, the rate of growth in PCE price indices dropped for food, energy, and motor vehicles, while growth in the health care price index outpaced inflation. Since many provider payment contracts are set in advance, health sector prices and overall health spending growth are lagged in reflecting general inflation.
The Peterson Center on Healthcare and KFF are partnering to monitor how well the U.S. healthcare system is performing in terms of quality and cost.