Note: This analysis was updated on August 2, 2024 to include new data.
Medical care prices and overall health spending typically outpace growth in the rest of the economy. Health costs represent a growing share of gross domestic product and many American families have seen the costs of health services and premiums grow faster than their wages.
This brief analyzes prices for medical care compared to other goods and services using consumer price index (CPI) and producer price index (PPI) data from the Bureau of Labor Statistics (BLS) and personal consumption expenditures (PCE) price index data from the Bureau of Economic Analysis (BEA).
Using the CPI, overall prices grew by 3.0% in June 2024 from the previous year, while prices for medical care increased by 3.3%. Overall prices excluding medical care grew by 2.9%. This marks the first month since early 2021 that prices for medical care had grown faster than overall inflation.
In June 2024, medical prices grew by 3.3% from the previous year, higher than the 3.0% overall annual inflation rate. Share on XMedical care prices have generally grown faster than overall consumer prices
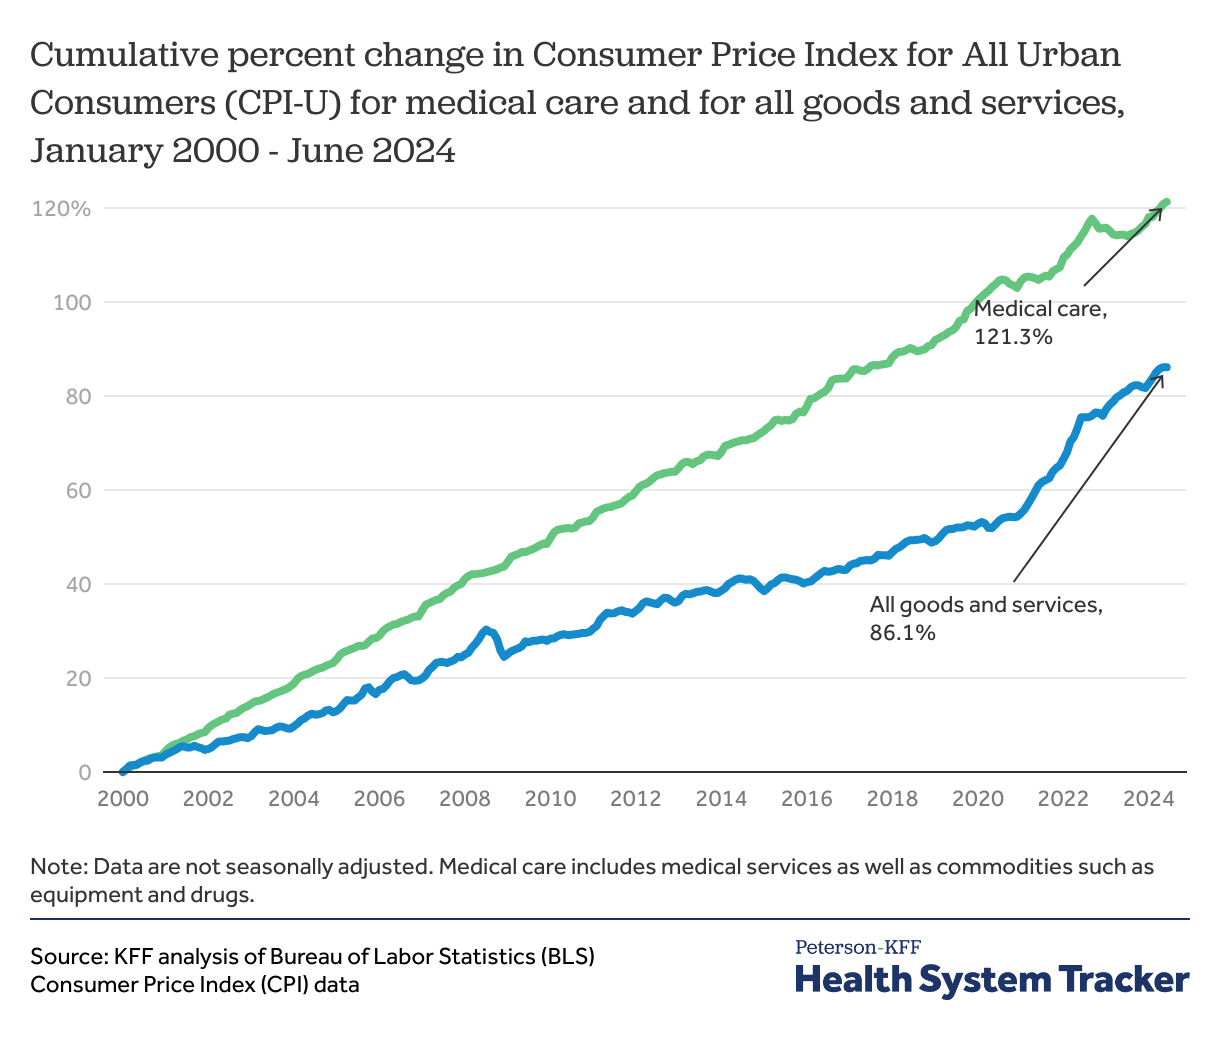
Since 2000, the price of medical care, including services provided as well as insurance, drugs, and medical equipment, has increased by 121.3%. In contrast, prices for all consumer goods and services rose by 86.1% in the same period.
Related Content:
In June 2024, prices rose 3.0% across the economy from the previous year, compared to 3.3% for medical care
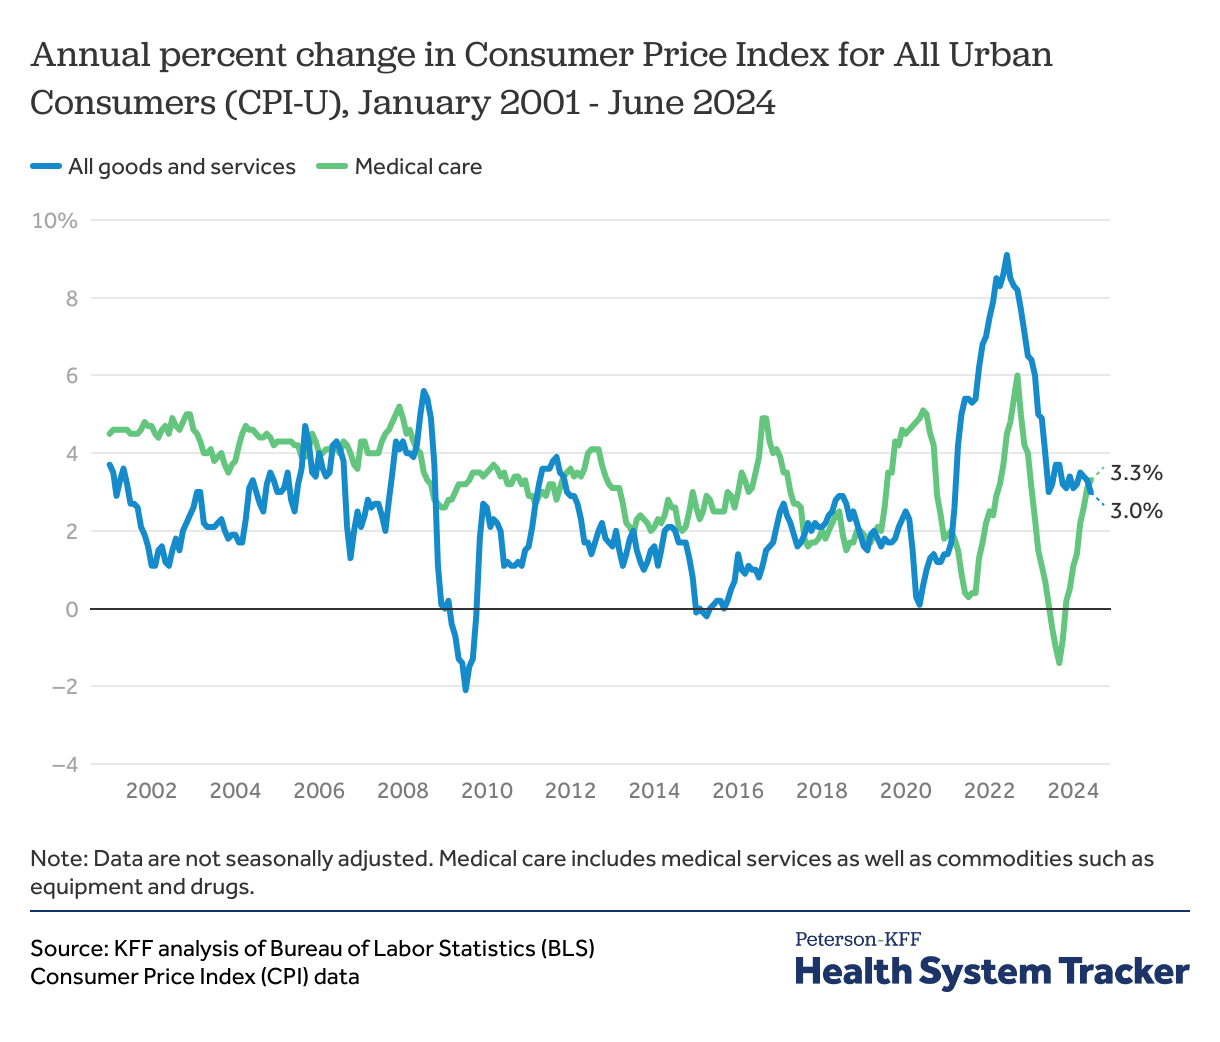
Medical care prices typically outpace growth of prices in the rest of the economy. However, starting in 2021, prices for many non-medical goods and services began increasing rapidly, outpacing the growth in medical prices. As general economic inflation has begun to cool more recently, though, medical prices are once again outpacing growth in other prices. Using the CPI, overall prices grew by 3.0% in June 2024 from the previous year, while prices for medical care increased by 3.3%. Overall prices excluding medical care grew by 2.9%.
As general economic inflation pushes wages upward, health worker wage increases also put upward pressure on medical prices, unless hospitals and other providers can find ways to operate with fewer staff or cut other expenses. However, many health prices are set in advance, administratively or via private insurance contracting, so there is a delay in observable price increases. Public payer prices are set by the federal and state governments annually. Medicare uses indexing measures to update payment rates annually, reflecting increases in operating costs and wage growth, among other factors. Some commercial rates are negotiated throughout the year, but most are tied to the plan or calendar year.
The Consumer Price Index (CPI)
The consumer price index for all urban consumers (CPI-U) measures the U.S city average change in prices consumers pay for goods and services. For medical care, CPI measures total price changes, including both the costs consumers pay out-of-pocket and those insurers (public and private payers) pay to providers and pharmacies. While CPI measures total price changes, the index weights spending to match consumers’ out-of-pocket costs, including consumers’ spending at the point of care and on health insurance premiums. For example, physician and hospital services are 47% of the medical care index.
BLS used new expenditure weights to calculate the CPI starting from January 2023 and will continue to update the weights annually. Previously, BLS updated CPI weights once every two years using two consecutive years of consumer spending data. CPI weights will now be calculated each year using one year of spending data for greater accuracy.
Medical care prices increased somewhat faster than prices for other consumer goods and services in the past year
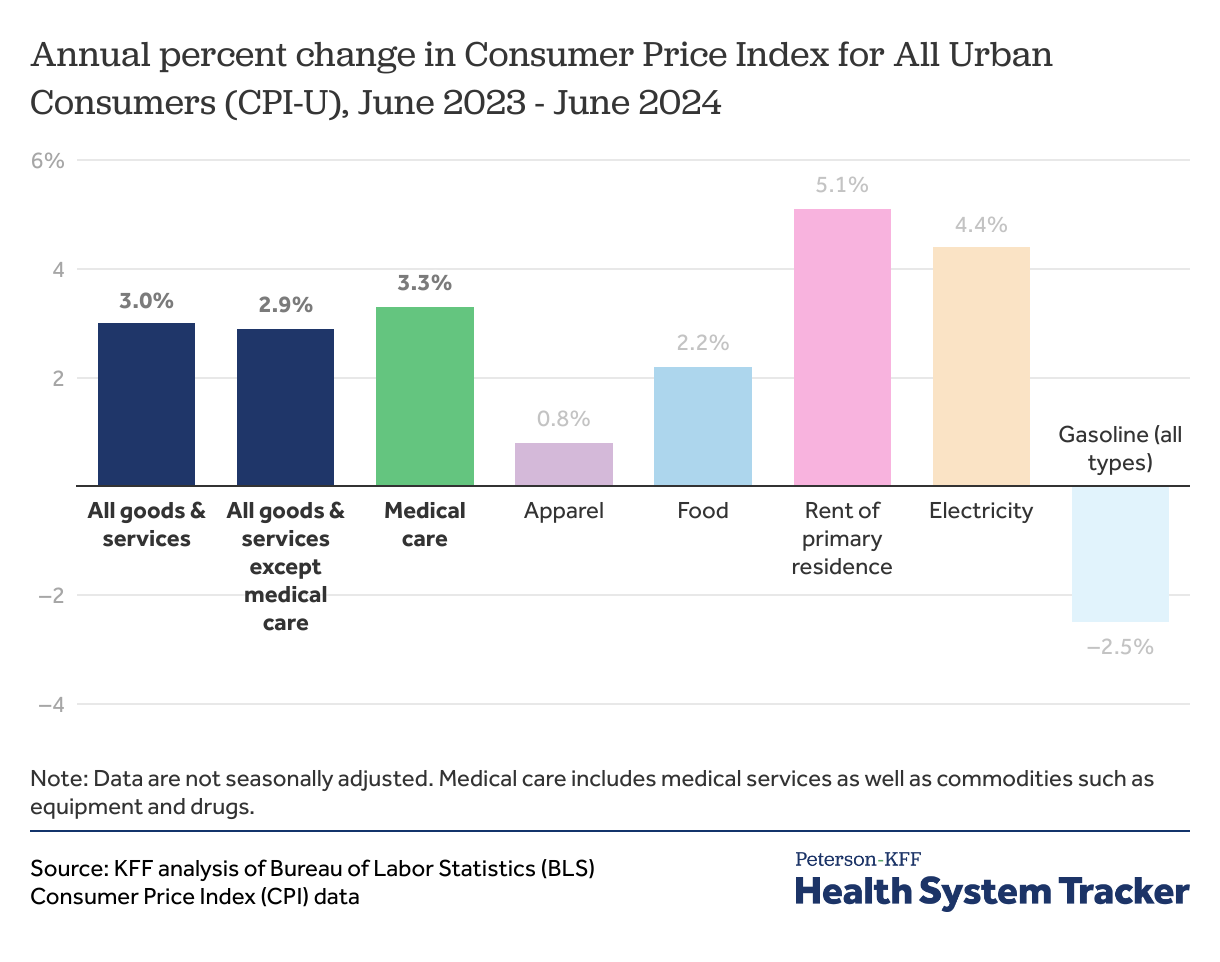
While the annual growth in medical prices is once again outpacing the growth in non-medical prices (3.3% vs. 2.9% in June) on average, some non-medical goods and services saw larger increases. Residential rents grew by 5.1% and electricity costs grew by 4.4%. Other household budget items, such as food and apparel, have seen smaller price increases in the past year than medical care. Gasoline was the fastest-growing essential household expense in 2022, reaching a peak inflation rate of 59.9% in June 2022. More recently, as of June 2023, gasoline prices have declined by -2.5% from the same month last year.
Some health prices increased faster than others in the past year
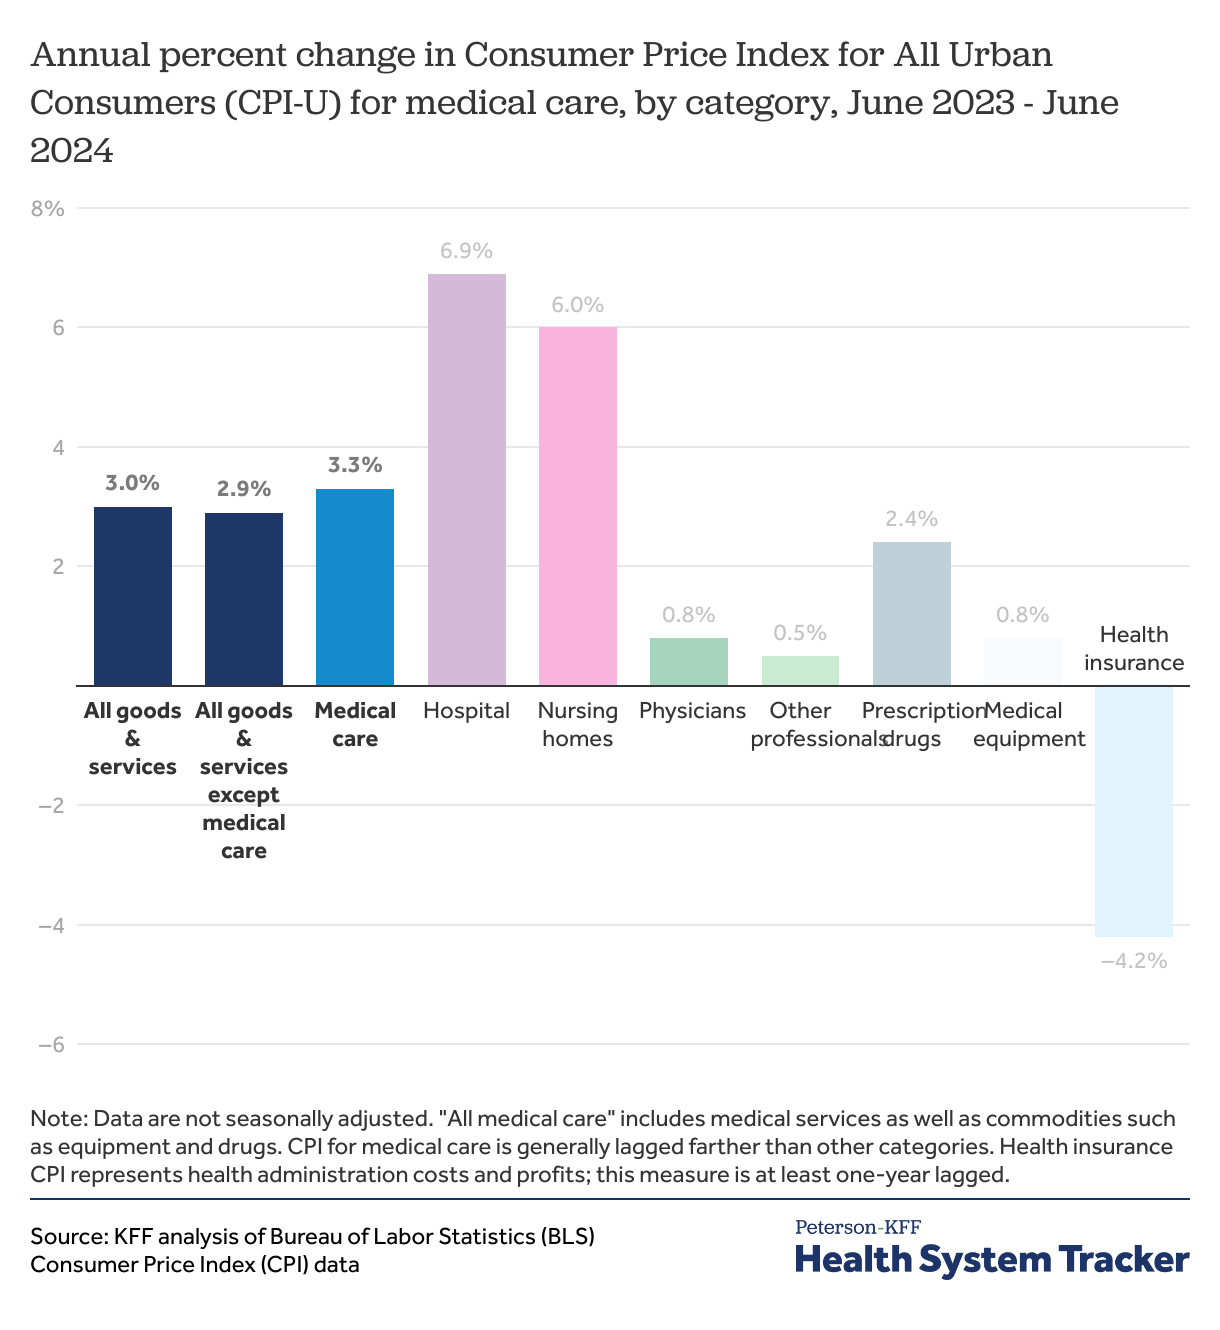
Prices for hospital services (6.9%) as well as for nursing homes (6.0%) rose faster than for prescription drugs and physicians’ services (2.4% and 0.8%, respectively). The medical CPI is generally based on lagged data even more so than other CPI categories. For example, the prescription drug CPI does not immediately reflect the introduction of new, high-priced drugs.
The medical care CPI also includes a price index for health insurance. This index measures retained earnings of health insurers – it is not a reflection of the premiums they set. The health insurance CPI fell from an annual increase of 28.2% in September 2022 (the all-time high) to a decrease of -4.2% in June 2024. However, the health insurance CPI presents data that is almost one-year lagged, so it is not representative of current price changes. In fact, the health insurance CPI through September 2022 reflects insurers’ margins in 2020, as they paid lower medical claims than in a typical year. Nevertheless, insurers likely saw lower margins, on average, in 2021 and 2022 than they had been in the first year of the pandemic due to returning utilization.
Regardless, with a 9% weight of the total medical consumer price index, health insurance brought the overall medical CPI up during most of 2022 and is now exerting downward pressure.
Different measures of medical inflation produce different estimates of price growth
While the CPI covers inflation in prices paid directly by consumers, another measure of inflation, the personal consumption expenditures (PCE) price index, also tracks changes in prices paid on behalf of consumers. For example, the health care services PCE price index covers payments by employers, private insurers, and government programs to providers in addition to premiums and out-of-pocket expenses paid by consumers. The PCE price index also accounts for shifts in consumer spending patterns in response to price changes. CPI, by contrast, assumes consumers buy a similar bundle of goods and services and does not account for trade-offs consumers may be making in response to price changes.
A third measure of inflation, the producer price index (PPI), represents inflation from the producers’ perspective in both the public and private sector. The PPI for health services includes medical services (provided by physicians or other care providers) paid for by third parties, such as employers or the federal government. Unlike the CPI, the PPI considers changes in industry output costs with a focus on the actual transaction prices.
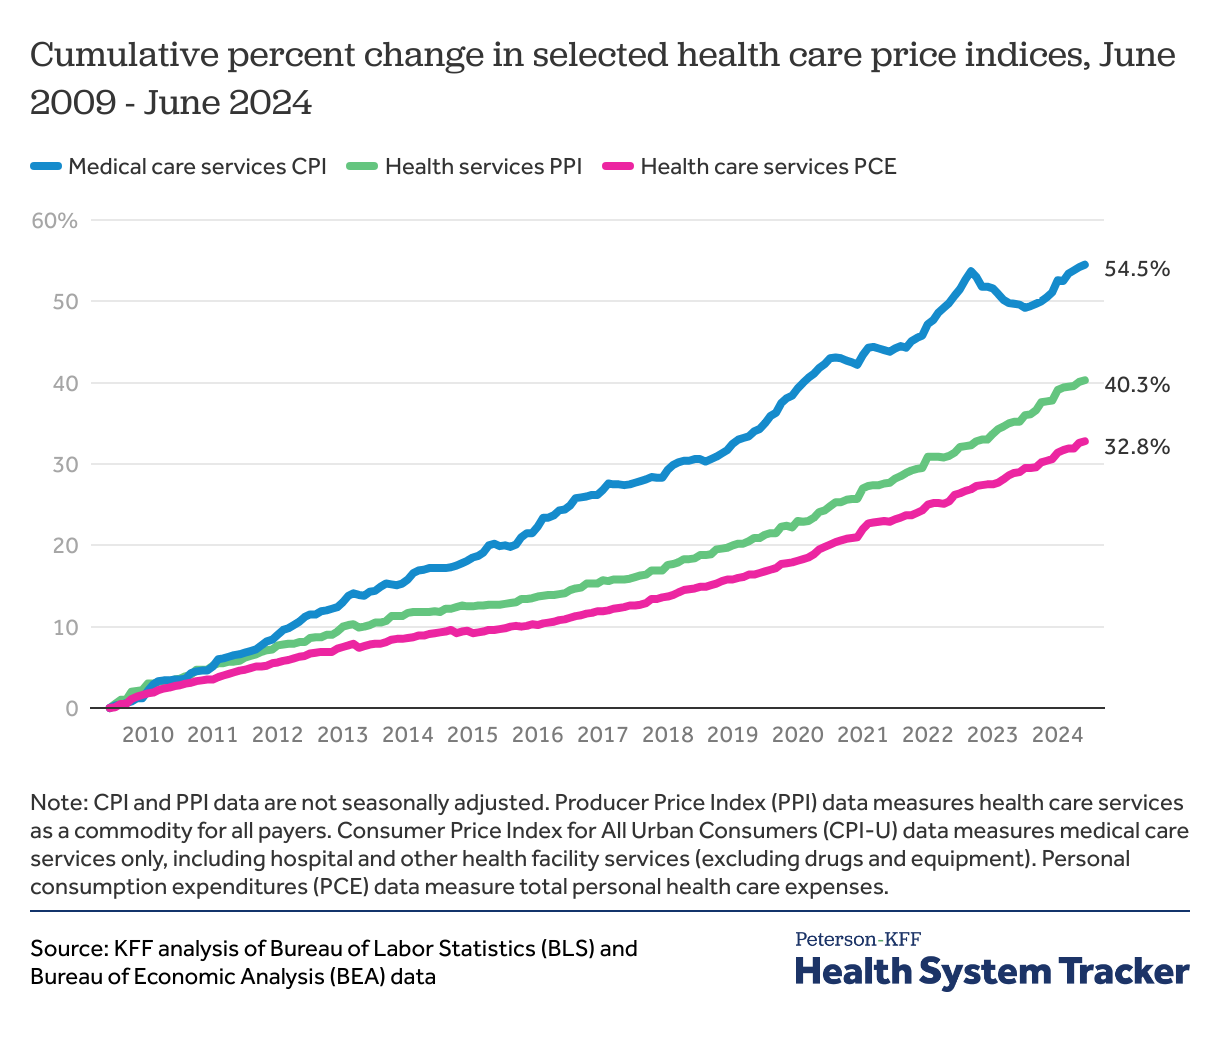
Since June 2009, the CPI-U for medical care services has risen by 54.5%, while the PPI for health care services has increased by 40.3% and the PCE price index for health care services has increased by 32.8%. Services included in this chart include hospital, physician, and other professional and facility care prices. While drugs and medical equipment are included in previous CPI-U charts in this analysis, this chart measures CPI-U of medical care services specifically and excludes drugs and medical equipment in both PPI and CPI-U measures.
Prices paid by private insurance generally outpace those paid by public programs
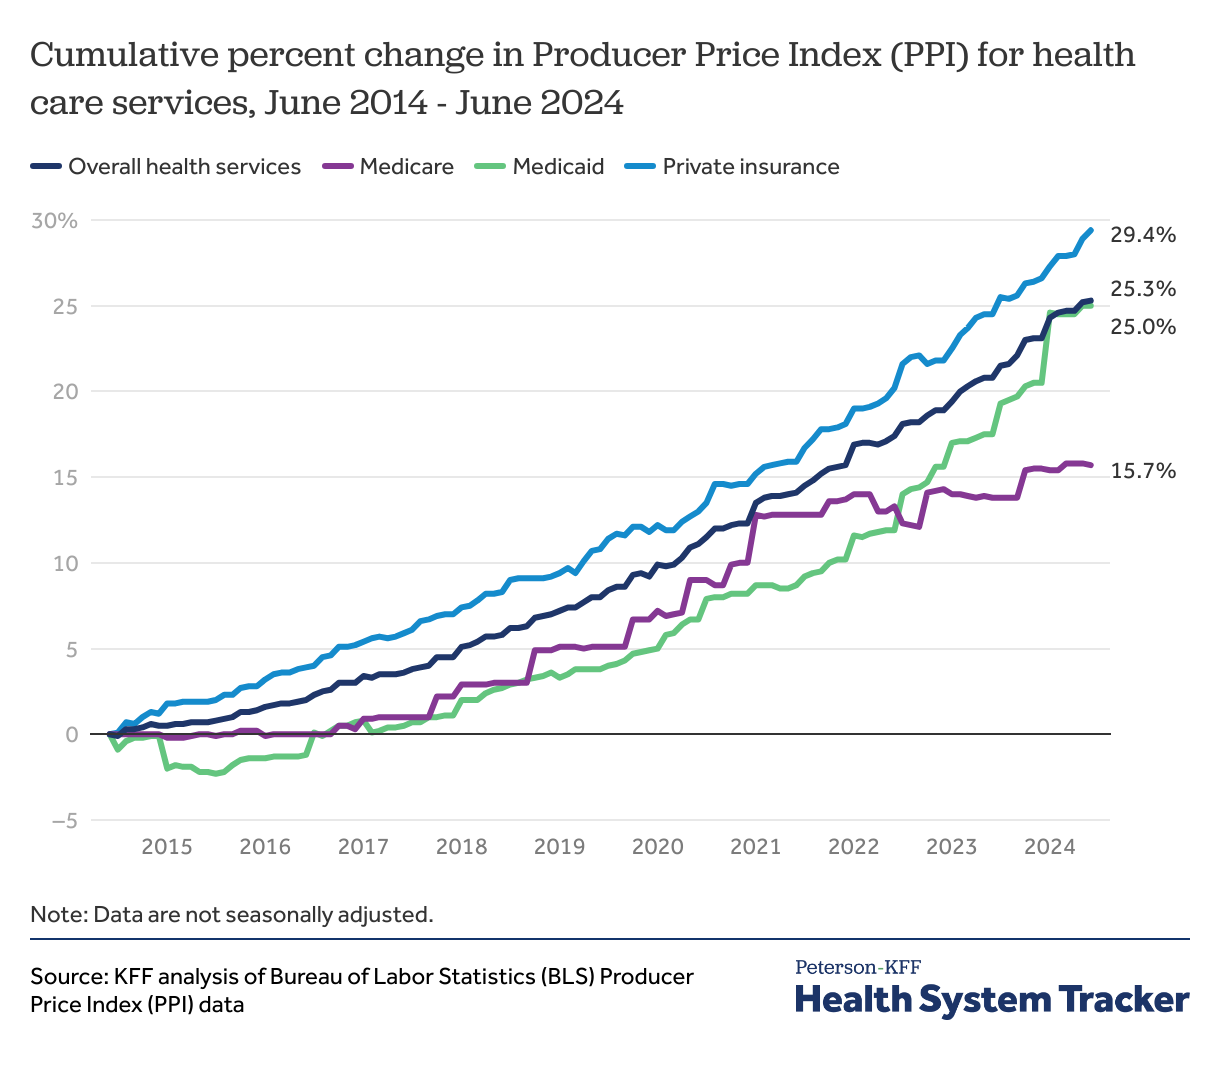
Generally, prices paid by private insurance are higher and rise more quickly than prices paid by public payers. Prices for private insurers are the result of negotiations between health systems and the insurance companies, while public payer prices are set administratively. In 2024, healthcare prices paid for by private insurance and Medicaid are rising faster than those paid for by Medicare. The private insurance health services PPI has risen by 29.4% since June of 2014, compared to 15.7% for Medicare and 25.0% for Medicaid in the same period. The overall health services PPI increased by 25.3% since June 2014.
During the public health emergency, Medicare provider reimbursement for COVID-19 treatment was boosted by 20.0%, which explains part of the reason for the increase in the Medicare PPI in 2020.
The Peterson Center on Healthcare and KFF are partnering to monitor how well the U.S. healthcare system is performing in terms of quality and cost.