Unemployment in the United States has been at or below 4% since November 2021. The health sector, along with the rest of the economy, saw a sharp drop in revenues and employment at the onset of COVID-19 in the spring of 2020. Health services utilization dropped precipitously as providers cancelled elective care and patients practicing social distancing avoided health facilities. Utilization of health services has remained somewhat lower than expected based on the trend in years before the pandemic, and health sector employment remains below pre-pandemic levels.
This chart collection uses the Bureau of Labor Statistics’ Current Employment Statistics (CES) and Job Openings and Labor Turnover Survey (JOLTS) data to analyze how jobs and wages in the healthcare industry have recovered compared to the non-healthcare sectors, and how this recovery is distributed across healthcare providers.
Unlike during past recessions, health employment fell drastically in early 2020
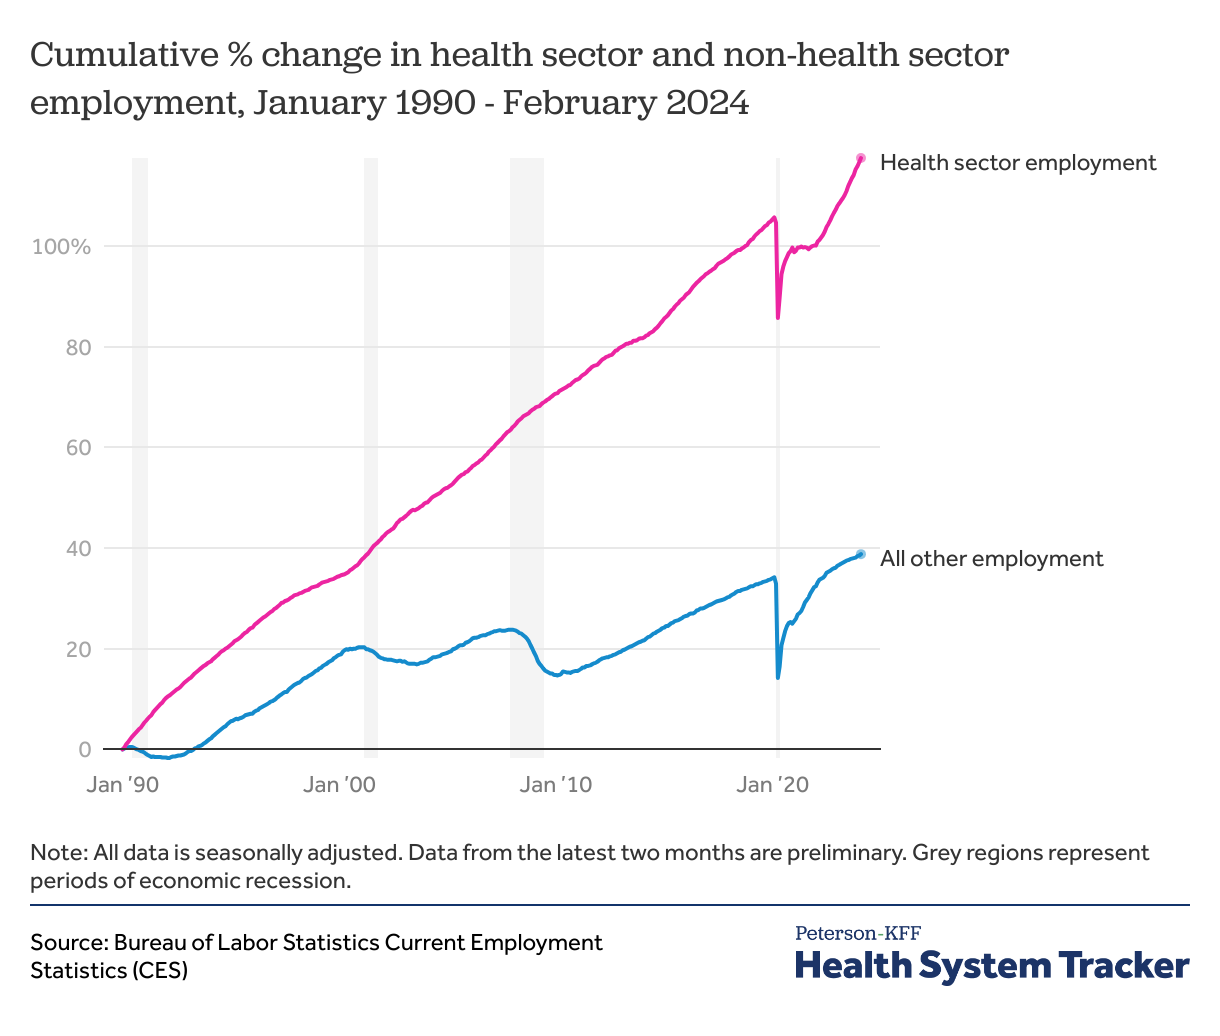
In the past, health sector jobs have been relatively recession-proof. During the Great Recession (from December 2007 through June 2009), for example, health sector employment continued to increase – from 13.1 million in December 2007 to 13.4 million in December 2008, and then 13.7 million in December 2009 – even as most other sectors saw significant declines.
The COVID-19 recession was markedly different – as lockdowns spread across the country, health sector jobs fell sharply along with jobs in other sectors. Even so, health sector employment did not fall quite as steeply as jobs in the rest of the economy. In April of 2020, health employment fell to 14.9 million from 16.2 million in 2019 (by -8.2%), while non-health employment fell by -14.0%. Total health employment in February 2020 was 16.5 million.
After this unprecedented drop at the beginning of the pandemic, jobs in both the health and non-health sectors sharply rebounded. Employment had begun to rise in both sectors by May 2020, though while the pandemic recession is over, recovery is incomplete. The health industry had reported 95% of pre-pandemic job numbers by July of 2020, but non-healthcare jobs did not return to 95% of pre-pandemic levels until almost a year later in June 2021.
As of February 2024, the health sector added 66,700 jobs over the previous month. Jobs in the health sector are 5.7% higher than in February 2020 (the previous peak), compared to 3.4% in all other sectors.
Related Content:

Health employment has made up a fairly consistent portion of U.S. employment since 2010
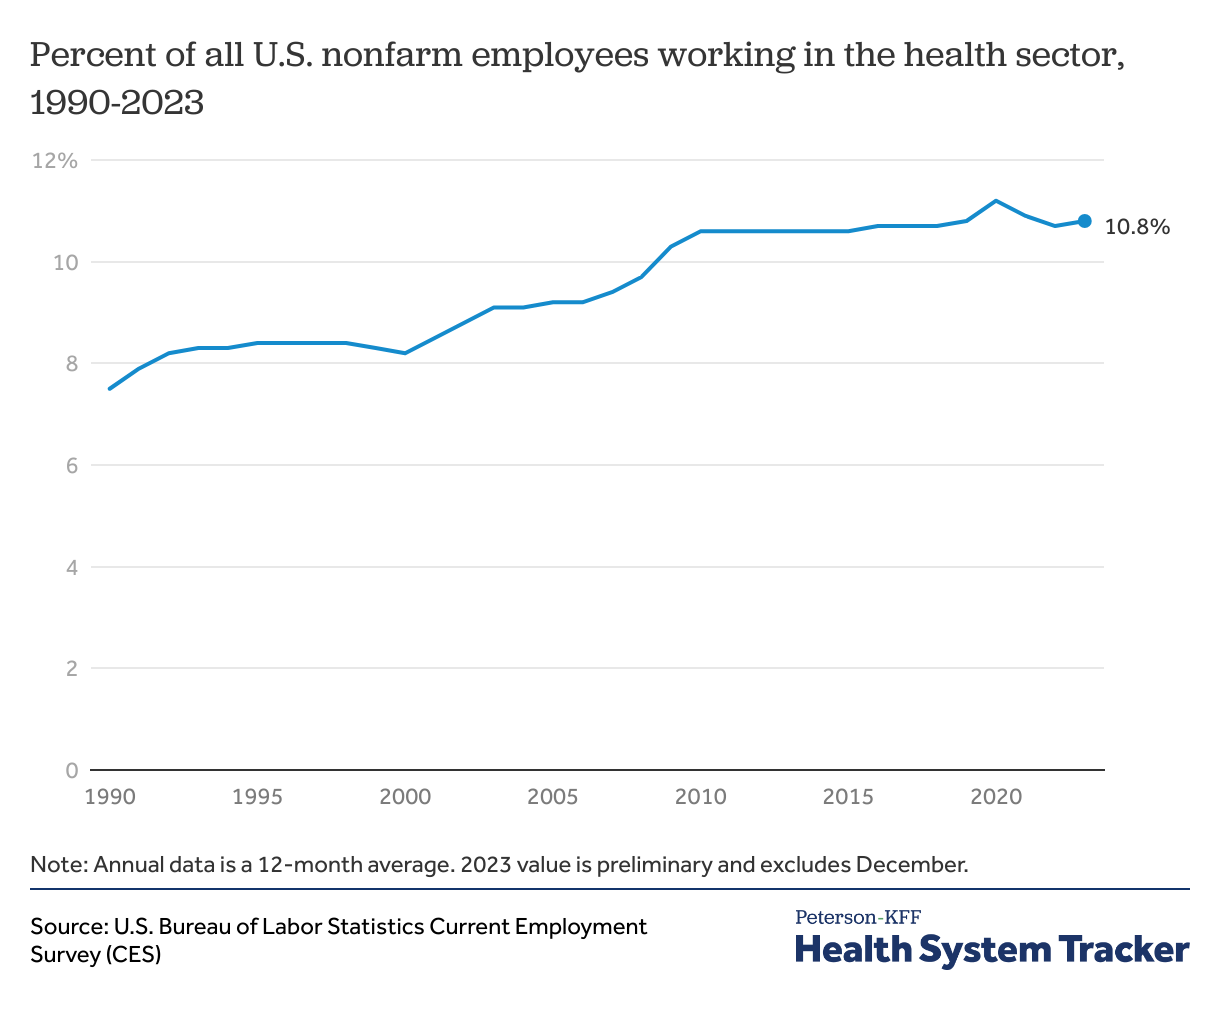
In 2023, 10.8% of people employed in the United States worked in the healthcare sector. This proportion has grown in past decades, from 7.5% in 1990 to 10.6% in 2010, but has remained fairly stable since. In 2020, amid pandemic-related layoffs in other industries, the proportion of workers employed in healthcare increased even as the number of healthcare workers declined, but the percent of workers in healthcare has returned to pre-pandemic levels as employment recovers in other sectors. Within the health sector, the top sites of employment include hospitals (31% of health sector employees) and physician offices (17%).
Skilled nursing care and elderly care employment remain below February 2020 levels
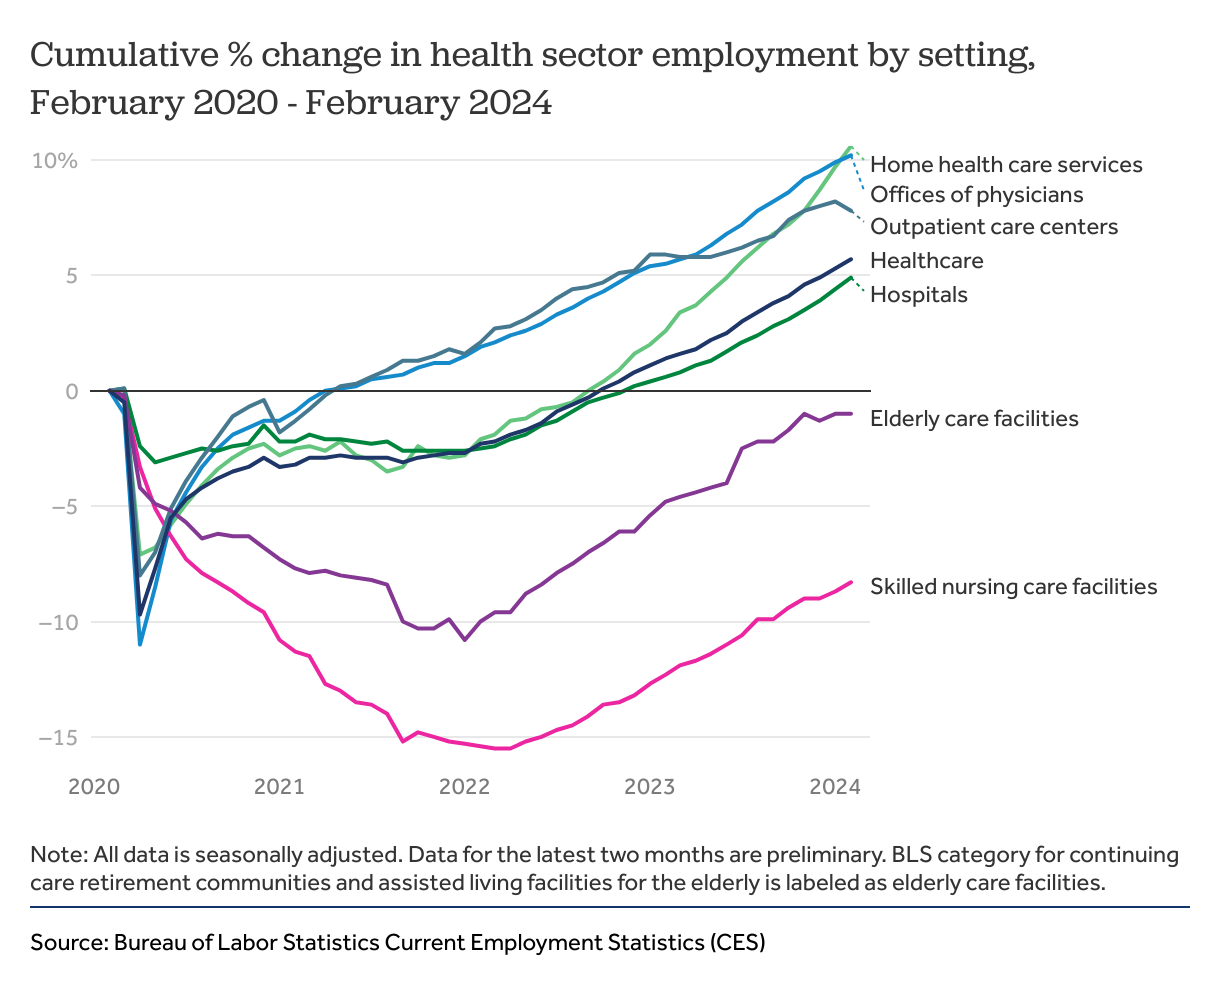
While all health service settings had sharp drops in employment at the beginning of the pandemic, most had seen an upturn in jobs by the summer of 2020 – an upward trajectory that has largely continued to the present. By February 2024, physicians’ offices, outpatient care centers, home health services, and hospitals employed more people than they had in February 2020. However, as we show in the charts below, employment in these settings is still below expected levels, given pre-pandemic trends. (Note that Current Employment Statistics data from the most recent two months is preliminary and subject to change).
The number of workers employed at skilled nursing care and elderly care facilities continues to remain below pre-pandemic levels. (Note: Throughout this chart collection, BLS category for continuing care retirement communities and assisted living facilities for the elderly is labeled as elderly care facilities.) Employment in elderly care facilities reached a low of 869,500 in January of 2022 and has been growing slightly since. These facilities had 974,600 employees nationwide in February 2020, and 965,100 in February of 2024—a 1% decrease. Skilled nursing care facilities have seen an 8.3% drop in employment since February of 2020.
Employment in some nursing and residential care settings has rebounded, but not all
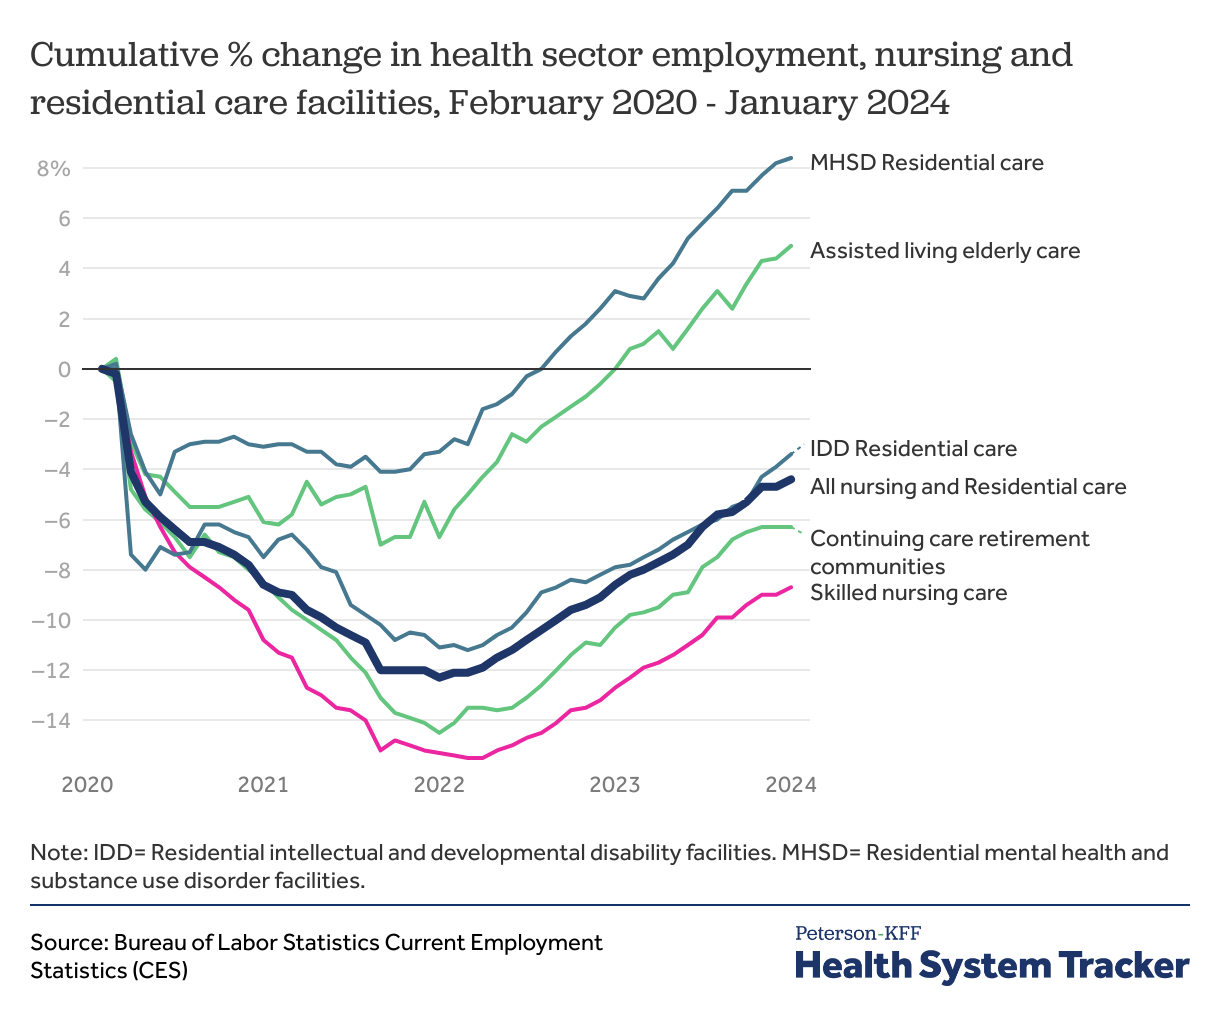
Employment in residential mental health and substance use disorder facilities and assisted living facilities for the elderly have rebounded following the pandemic at 8.4% and 4.9% respectively. However, employment in many residential settings remains below pre-pandemic levels. Residential facilities for people with intellectual and developmental disabilities have seen a 3.4% decrease in employment following the pandemic. Since February 2020, continuing care retirement communities have experienced a 6.3% drop in employment.
Overall health sector employment remains below trends seen before the COVID-19 pandemic
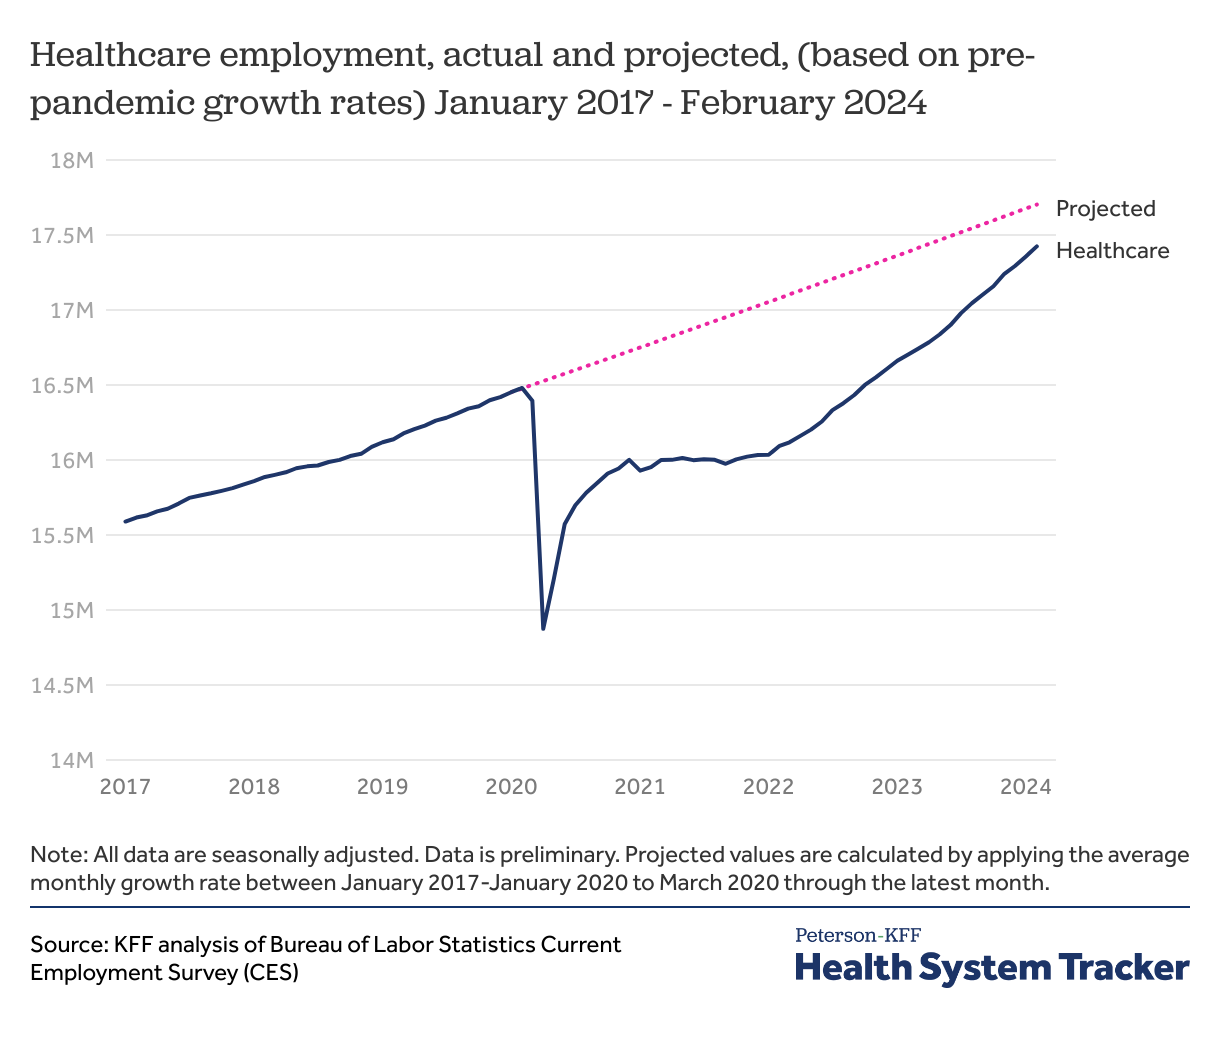
If health sector employment had continued to grow at pre-pandemic rates, overall health sector employment would be 279,100 higher in February 2024.
Related Content:
Health sector employment remains below pre-pandemic trends, particularly for elderly care facilities and outpatient care centers

While health employment in many facilities has nearly returned to pre-pandemic levels, the effects of the pandemic linger. Employment in most areas had been growing steadily before March 2020, and most jobs have not yet returned to where they likely would have been, based on pre-pandemic job growth rates. As an example, 1.54 million Americans were employed in home health services in January 2020, versus 1.71 million in February 2024. This represents a recovery of all jobs lost at the beginning of the pandemic. However, between 2017 and early 2020, employment in home health had been growing at an average rate of 0.3% per month. If this growth had continued from 2020 through most recent month, home health service employees would number 1.77 million in February 2024, rather than 1.71 million.
Employment had been growing in every health service industry between 2017 and early 2020 except for skilled nursing facilities, where the number of workers had been declining at an average rate of 0.1% per month. Skilled nursing homes employed 1.46 million people in February of 2024, which is 3.9% below the projected 1.52 million had pre-pandemic trends continued.
Job openings in the health sector, like the rest of the economy, are higher than pre-pandemic levels
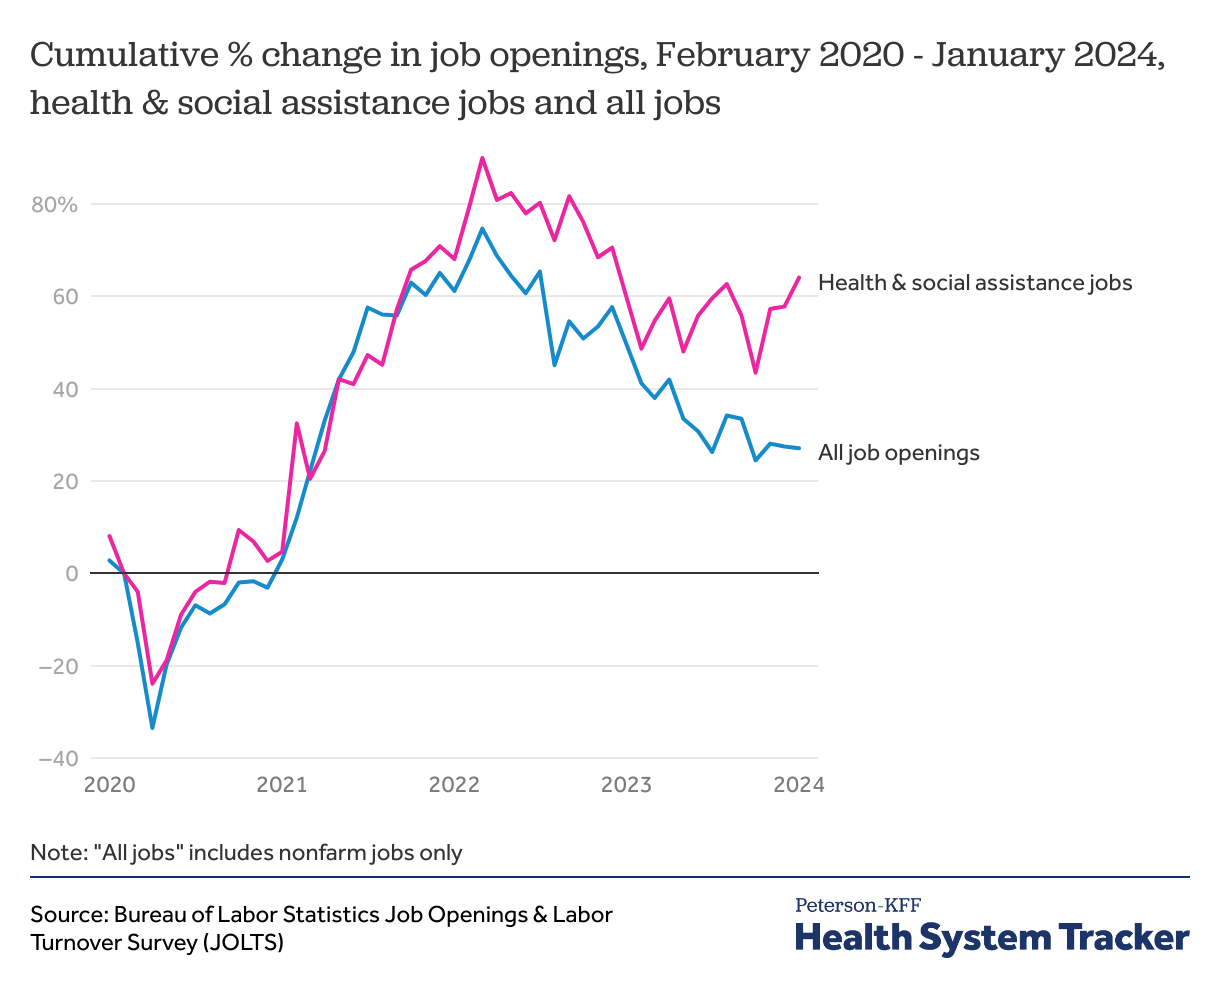
The Job Opportunity & Labor Turnover Survey (JOLTS) does not differentiate between healthcare and social assistance positions in monthly data, but it does show that the combined number of health and social assistance job openings has been increasing since April 2020, hitting a record high in March 2022. Even after a decline in April 2022, job openings in healthcare and social assistance are currently more than 50% higher than before the pandemic. Job openings across the labor market also remain higher than pre-pandemic levels, but by less than 30%, indicating that health and social assistance industry employers are working to fill more jobs than other sectors.
Job quits have returned to pre-pandemic levels
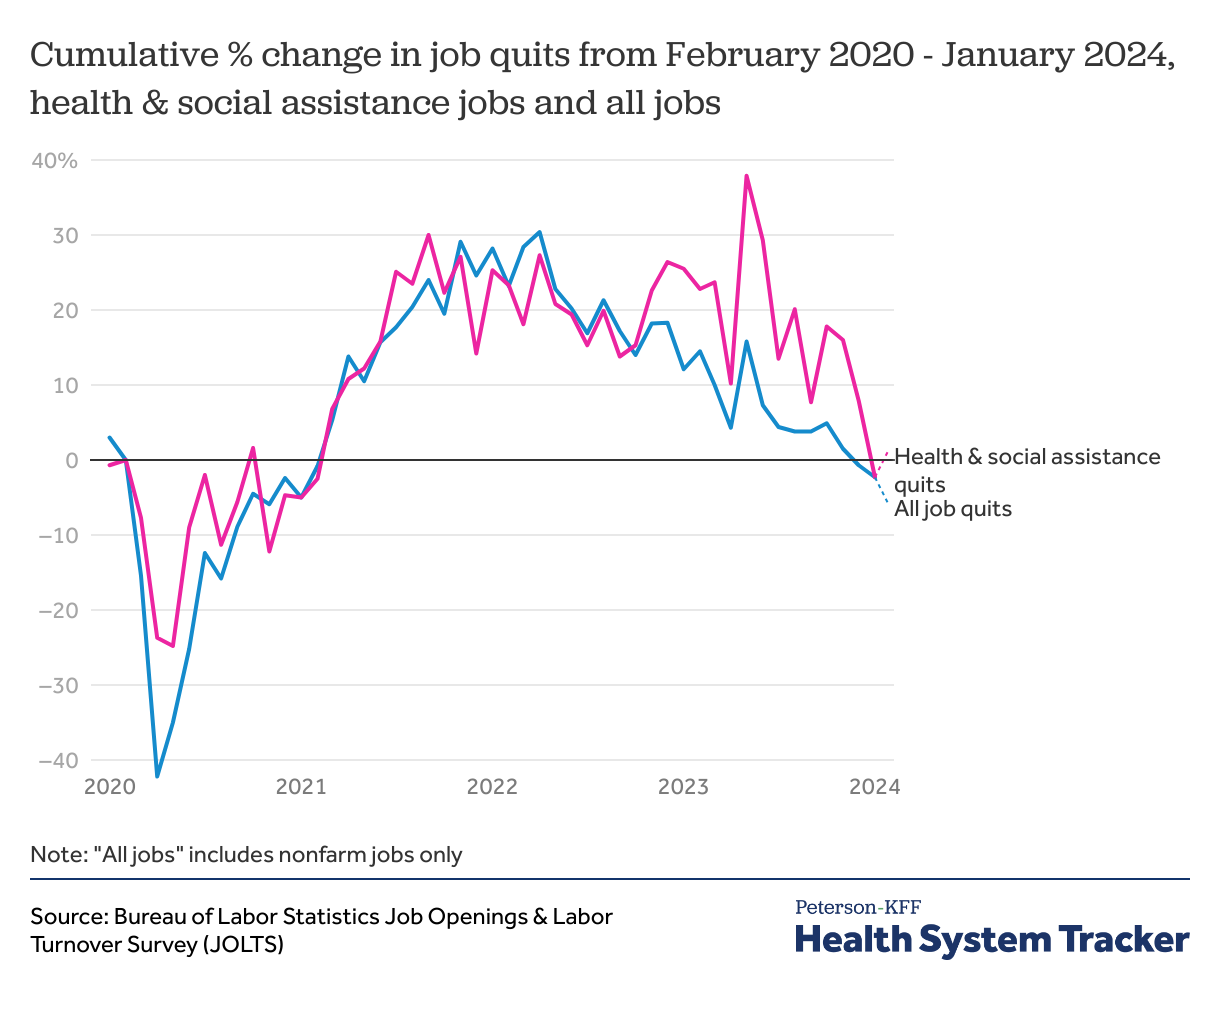
At the beginning of the pandemic, the number of workers quitting their jobs declined sharply. In the beginning of 2021, workers began leaving their jobs at higher rates than they had been before the pandemic started. By January 2024, healthcare and social assistance job quits were 2.3% lower than they had been before the pandemic, about the same as quits among all workers in the same period.
The increase in job quitting among healthcare workers has received attention in the media, though job quits rate was high across the economy (the “great resignation”) in the last few years – in fact, quit rates were at the highest levels ever recorded in November 2021. More recently, quits have declined and are now below pre-pandemic levels, indicating that workers are less likely to be voluntarily leaving their jobs. Whether this is due to improved wages and working conditions, increasing economic uncertainty among workers, or some combination of these and other factors remains to be seen.
Unemployment rates among hospital and non-hospital workers varies by sex
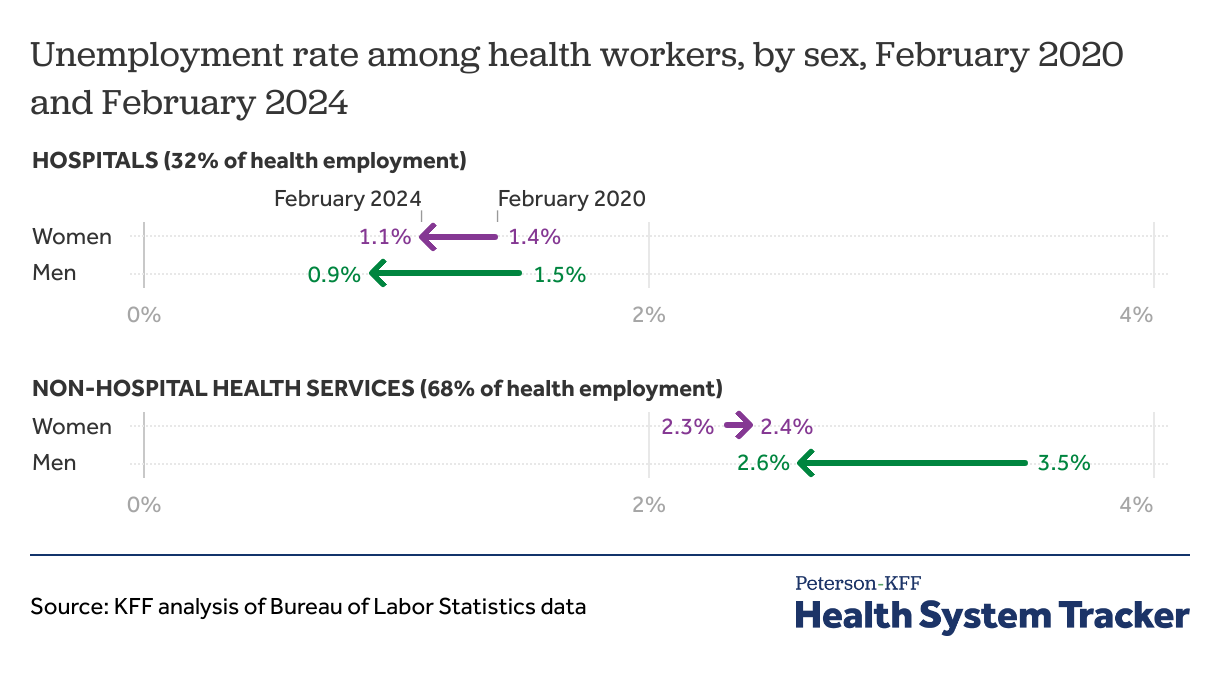
The unemployment rate during the pandemic among healthcare workers varies by sex, as well as the location of the individual’s usual employment. Hospital and non-hospital health services workers of both sexes have seen unemployment rates return to roughly pre-pandemic levels.
Average weekly earnings have increased steadily among all employees, including health sector employees, since the beginning of the pandemic
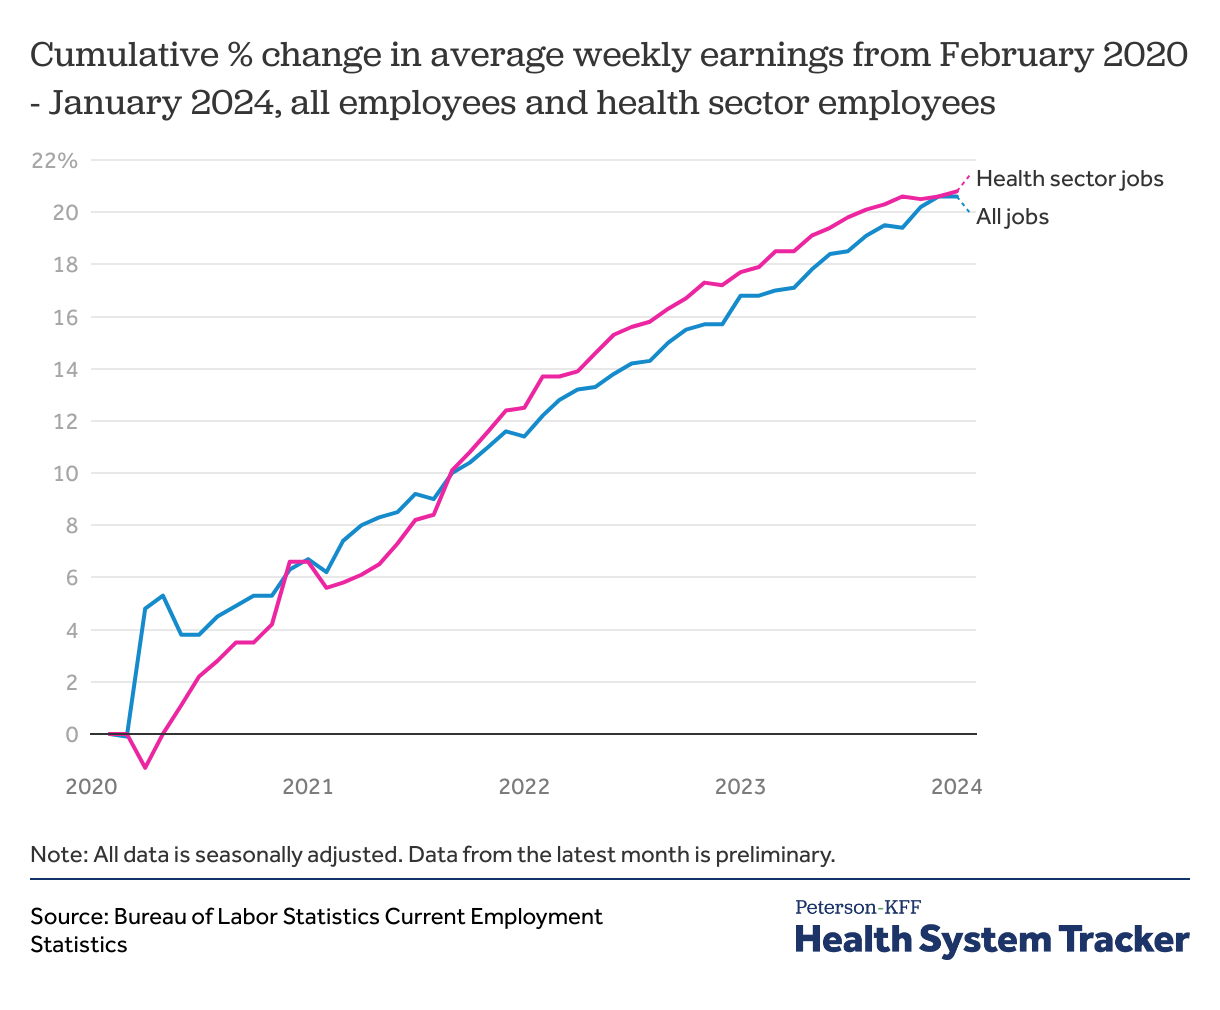
Since February 2020, healthcare jobs have seen average wage increases that mirror those among all employees of private organizations. In the early months of the pandemic, average healthcare wages rose slowly compared to overall workforce wages, as low-wage workers in non-health industries were disproportionately pushed out of the labor force thus driving the average wage higher. However, since mid-2021, health sector wages have increased slightly faster than overall average weekly earnings. Average weekly wages for employees of private organizations increased by 20.6% from $979 in February 2020 to $1,181 in January 2024, while healthcare employee average wages, always slightly higher, have increased 20.8%, from $1,038 before the pandemic to $1,254 in January 2024.
Increases in the average wage do not necessarily translate to higher pay for a given worker, and instead could be driven by changes in the distribution of high or low wage workers. An increase in unemployed low-wage workers would make the average wage higher. Also, these are nominal wages and thus do not account for inflation’s impact on purchasing power.
Home- and nursing care employees have seen higher average wage increases than employees who work in a clinical setting
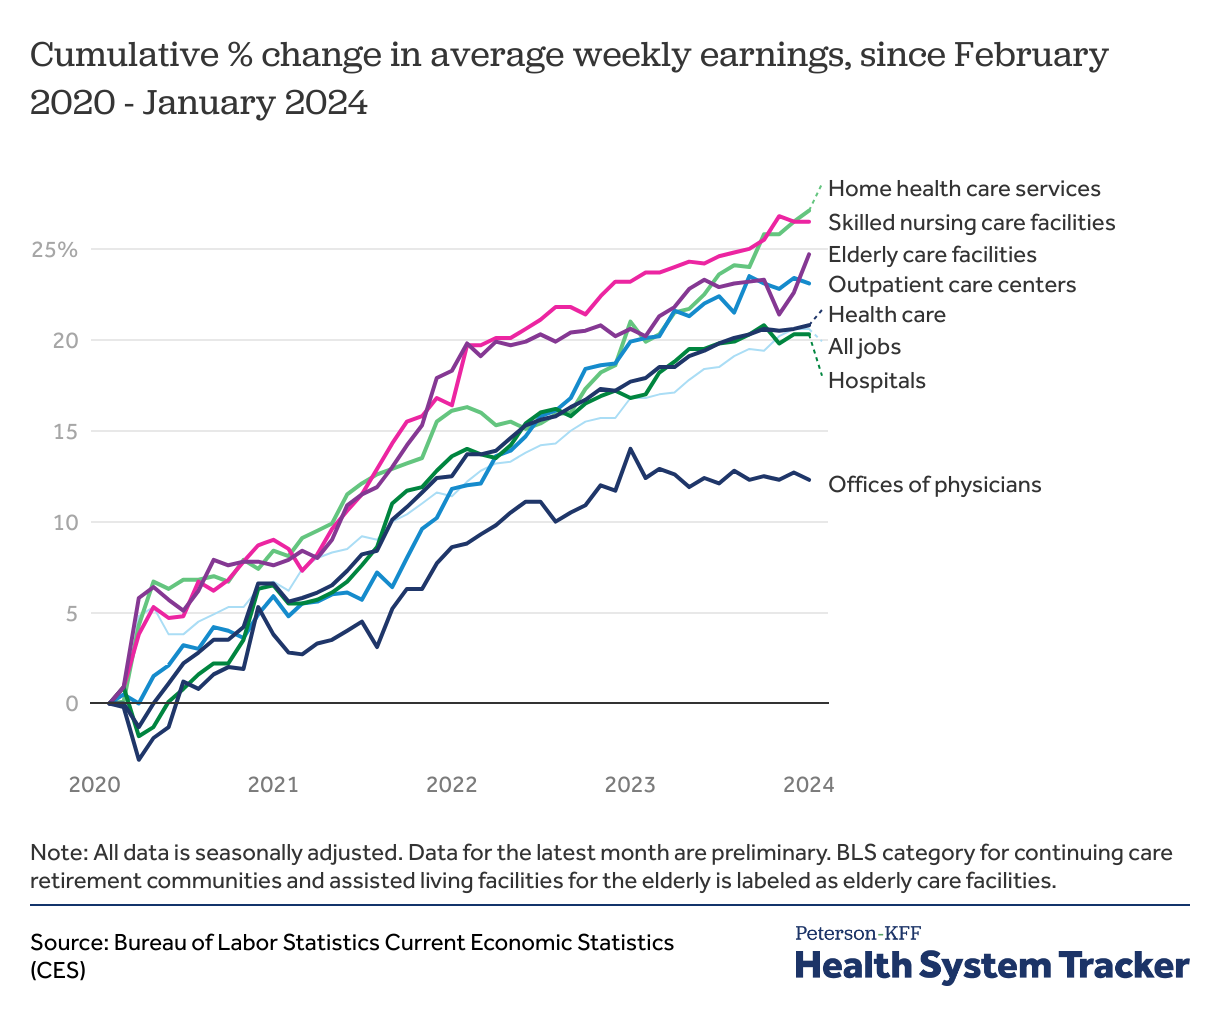
The upward trend in average health sector wages has been unequally distributed among health settings. Skilled nursing care facility employees have seen the slowest recovery in employment in the aftermath of the pandemic, and they have also seen among the highest average wage increases. Among skilled nursing care employees, average earnings rose by 26.5% between February 2020 and January 2024, from $671 to $849 per week.
Alternatively, offices of physicians which saw the largest rise in employment following the pandemic have seen the lowest average wage increases. Average earnings rose by 12.3% between February 2020 and January 2024, from $1,443 to $1,620 per week. Wages of hospital workers saw a 20.3% increase between February 2020 to January 2024, from $1,269 to $1,527 per week.
Discussion
The COVID-19 pandemic, and the rapid subsequent changes of both supply and demand in the labor market, will continue to have an impact on employment in the health industry (and the overall economy) for years to come. While hospitals and physicians’ offices have returned to pre-pandemic employment levels, industries such as elderly care and skilled nursing care facilities continue to see relatively low employment. Average wages for health sector positions have increased significantly since the beginning of the pandemic, but this could be at least in part a function of fewer low-wage workers employed in those settings.
The United States saw a period of rapid consumer price growth in the first half of 2022. While inflation has not yet seriously impacted prices of health services, rising prices of other consumer goods has put upward pressure on wages for all workers, including those in the health sector.
Related Content:
The Peterson Center on Healthcare and KFF are partnering to monitor how well the U.S. healthcare system is performing in terms of quality and cost.