Despite over 90% of the United States population having some form of health insurance, medical debt remains a persistent problem. For people and families with limited assets, even a relatively small unexpected medical expense can be unaffordable. For people with significant medical needs, medical debt may build up over time. People living with cancer, for example, have higher levels of debt than individuals who have never had cancer.
High deductibles and other forms of cost sharing can contribute to individuals receiving medical bills that they are unable to pay, despite being insured. KFF polling shows that people with medical debt report cutting spending on food, clothing, and other household items, spending down their savings to pay for medical bills, borrowing money from friends or family members, or taking on additional debts. (The KFF polling found that 41% of adults have health care debt according to a broader definition, which includes health care debt on credit cards or owed to family members.)
This brief analyzes data from the Survey of Income and Program Participation (SIPP) to understand how many people have medical debt and how much they owe. A recent Census Bureau analysis on medical debt at the household level found 15% of households owed medical debt in 2021. In this analysis, SIPP data is summarized at the individual level for adults who reported owing over $250 in unpaid medical bills as of December 2021. This analysis focuses on people with over $250 in medical debt, a threshold defined as “significant” medical debt to distinguish from people who owe relatively small amounts.
This analysis shows that 20 million people (nearly 1 in 12 adults) owe medical debt. The SIPP survey suggests people in the United States owe at least $220 billion in medical debt. Approximately 14 million people (6% of adults) in the U.S. owe over $1,000 in medical debt and about 3 million people (1% of adults) owe medical debt of more than $10,000. While medical debt occurs across demographic groups, people with disabilities or in worse health, lower-income people, and uninsured people are more likely to have medical debt.
People in worse health and those living with a disability are more likely to report medical debt
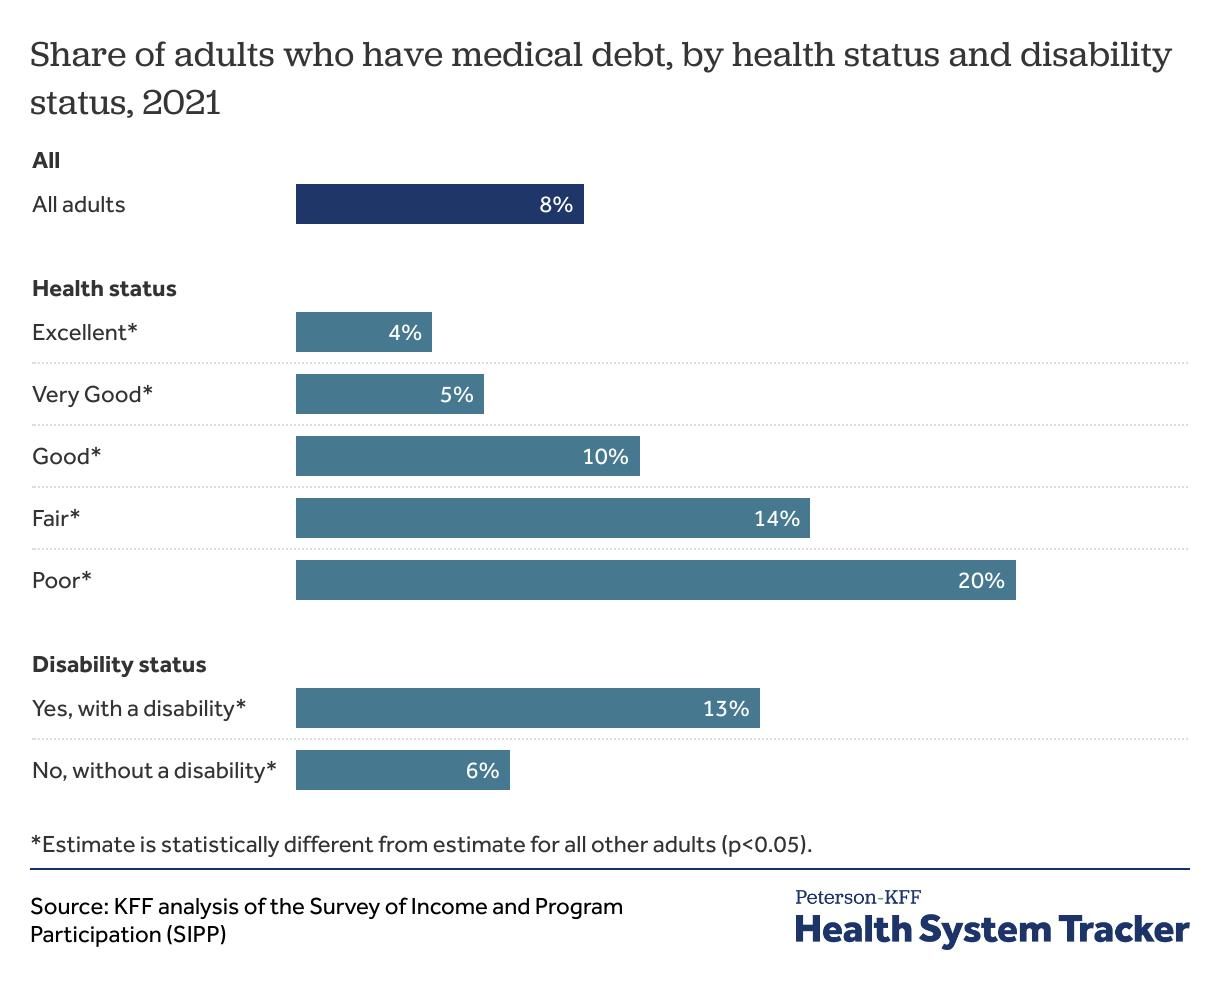
People with complex heath needs that require ongoing care can see medical bills pile up over time. Those in worse health or those living with disabilities may also experience unemployment or income losses, further contributing to their difficulty affording medical bills. Adults living with a disability are more likely than those without a disability to report owing medical debt (13% vs. 6%). Similarly, adults who report their health status is “fair” or “poor” are more likely to say they owe medical debt than those who say they are in “good” or better health.
Related Content:
Middle-aged adults and Black people are more likely to have medical debt
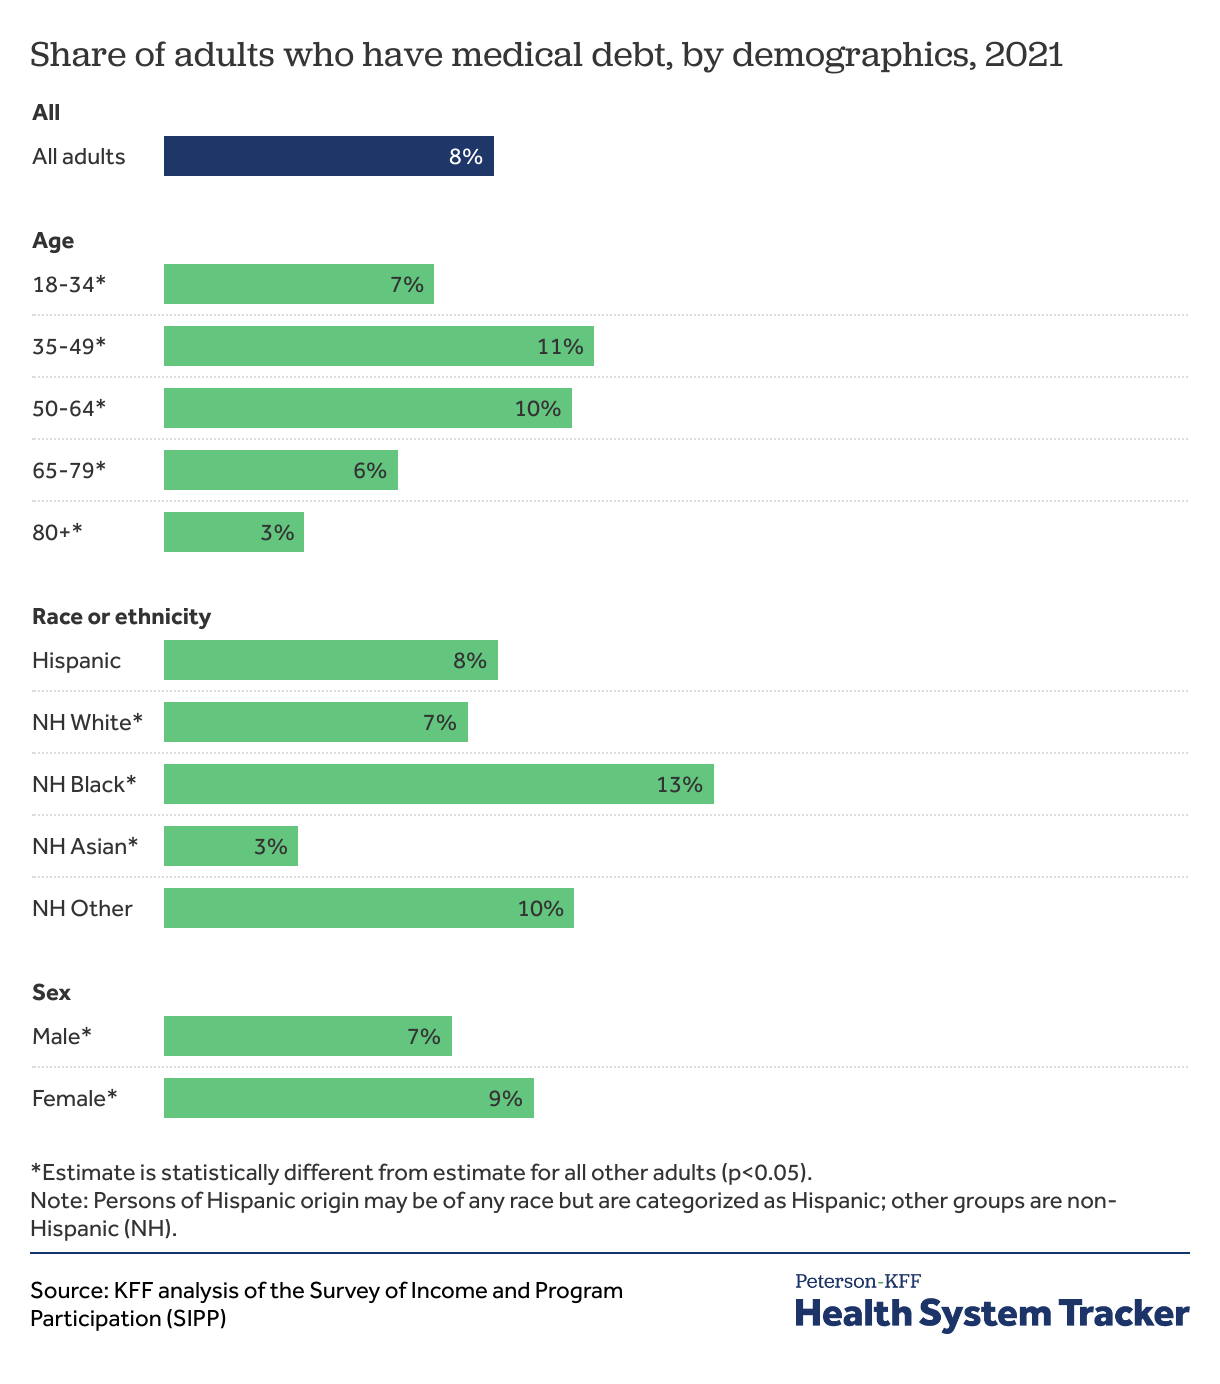
People typically use more health care and often have higher health care expenses and out-of-pocket costs as they age. Unsurprisingly, the share of adults with medical debt increases with age and middle-aged adults are more likely than young adults to have medical debt. However, the share of adults with medical debt decreases when people reach Medicare age. This analysis shows that 10% of adults ages 50 to 64 report having medical debt, compared to 6% of those ages 65 to 79.
Black Americans are far more likely than people of other racial and ethnic groups to report having medical debt. This analysis shows that 13% of Black Americans report having medical debt, compared to 8% of White and 3% of Asian Americans.
Women are also more likely to report having medical debt (9%) than men (7%), on average. Some of this difference is likely related to childbirth expenses and lower average income among women than men.
Low- and middle-income adults and those without health insurance are more likely to have medical debt
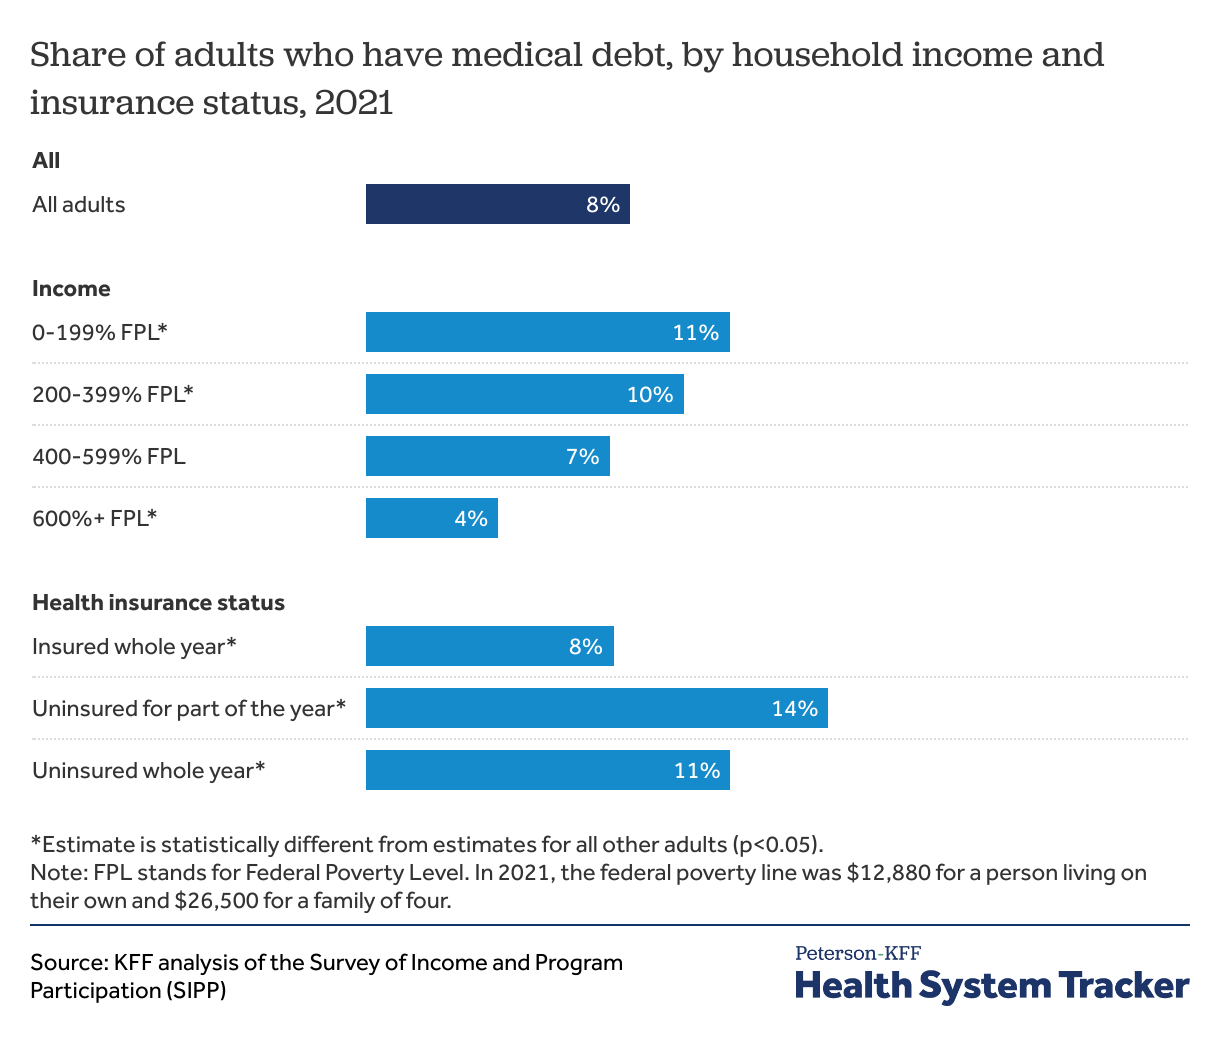
Adults with lower and modest incomes are more likely to have medical debt. This analysis shows that about 1 in 10 adults with incomes below 400% of the federal poverty level (FPL) report having medical debt. In 2021, the federal poverty line was $12,880 for a person living on their own and $26,500 for a family of four.
Most people in the United States are insured, but adults who were uninsured for part of the year are more likely to report having medical debt (14%) than those who were insured the full year (8%) or uninsured for the whole year (11%).
People living in rural areas and in the South are more likely to have medical debt
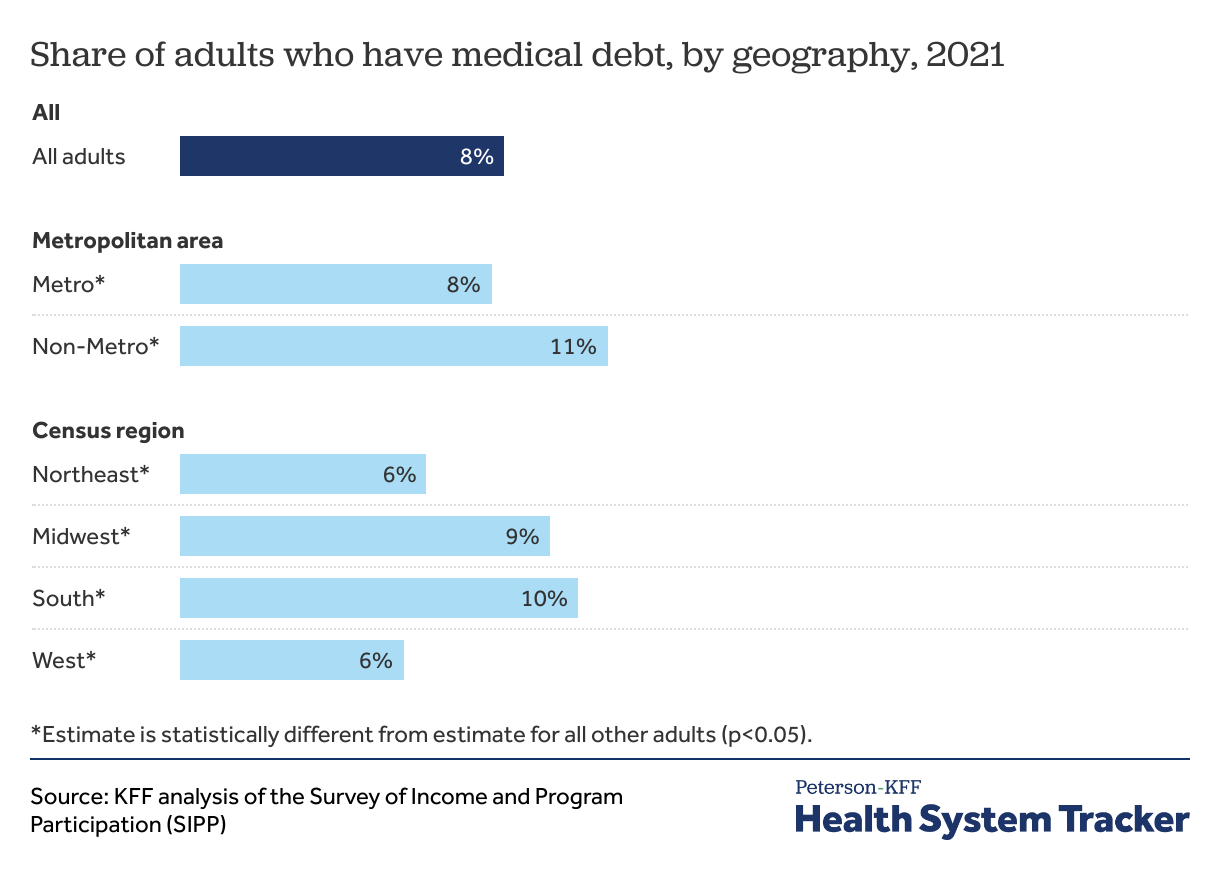
The burden of medical debt is not distributed equally across the country. Adults living in rural areas and in the South are more likely to report having medical debt.
Health status and income are both key factors in medical debt
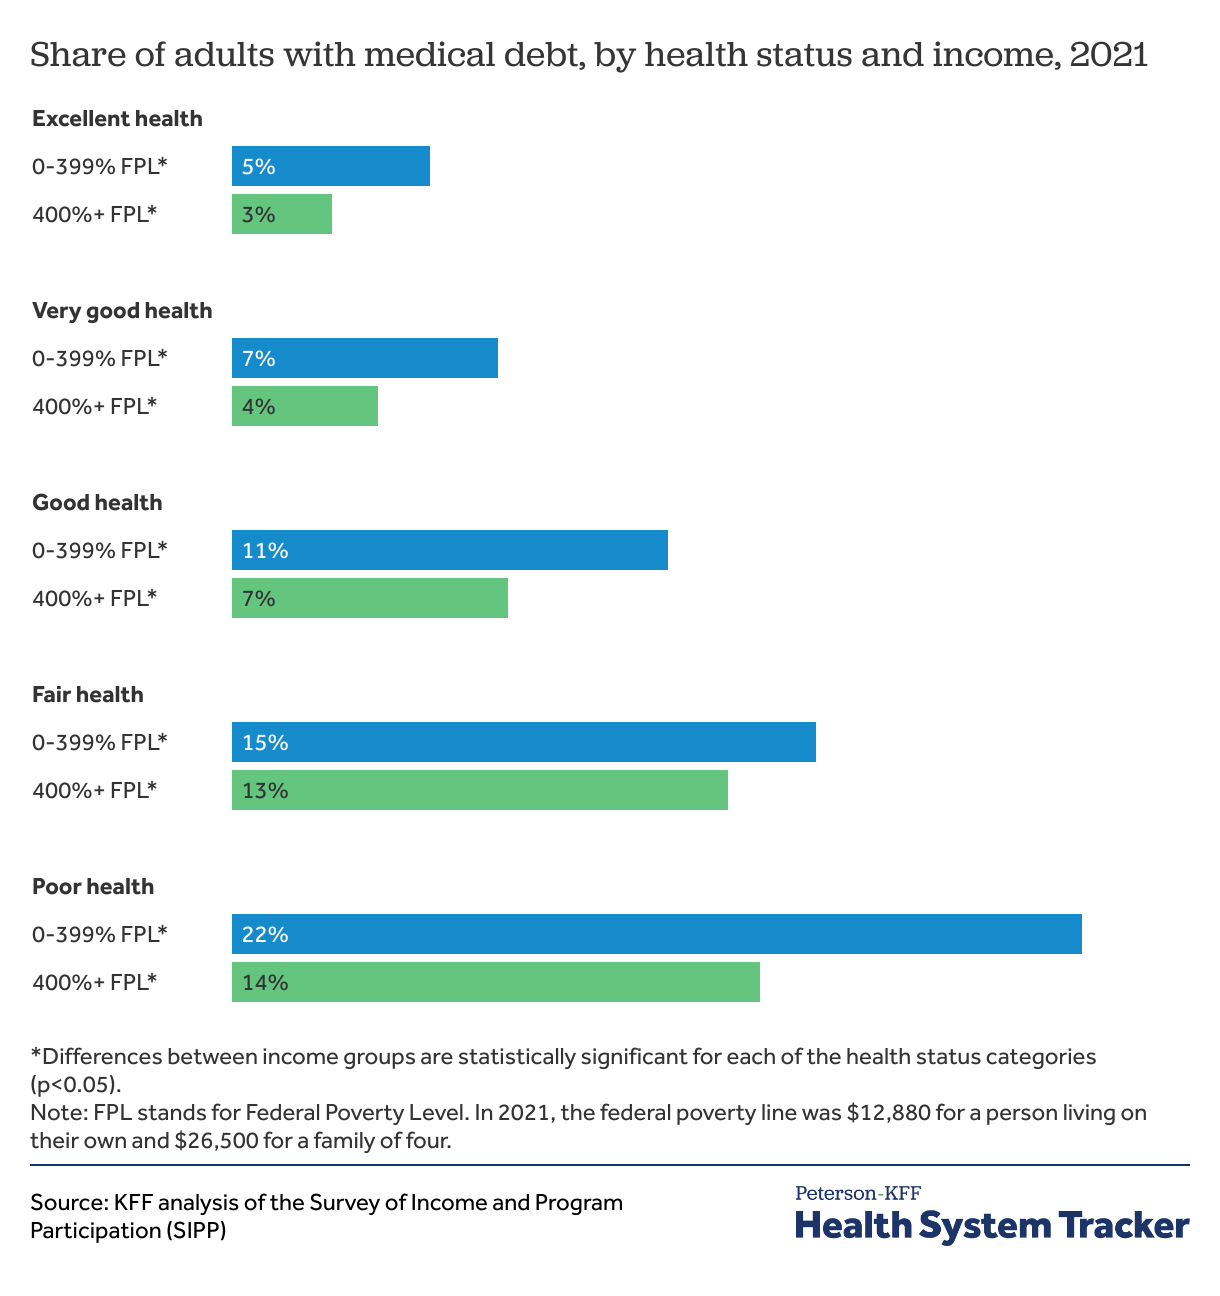
The chart above highlights the interaction between income and health status. Poor health status is associated with higher rates of medical debt even among people with higher incomes — adults with higher incomes in poor health are more likely to have medical debt than adults with lower incomes in good health. Adults in worse health are more likely to report medical debt when they are also lower- or middle-income. For example, 22% of adults in poor health with household incomes under 400% of the poverty line had medical debt, compared to 14% of adults in poor health with incomes at 400% or more of the poverty line.
Most people with medical debt owe over $1,000
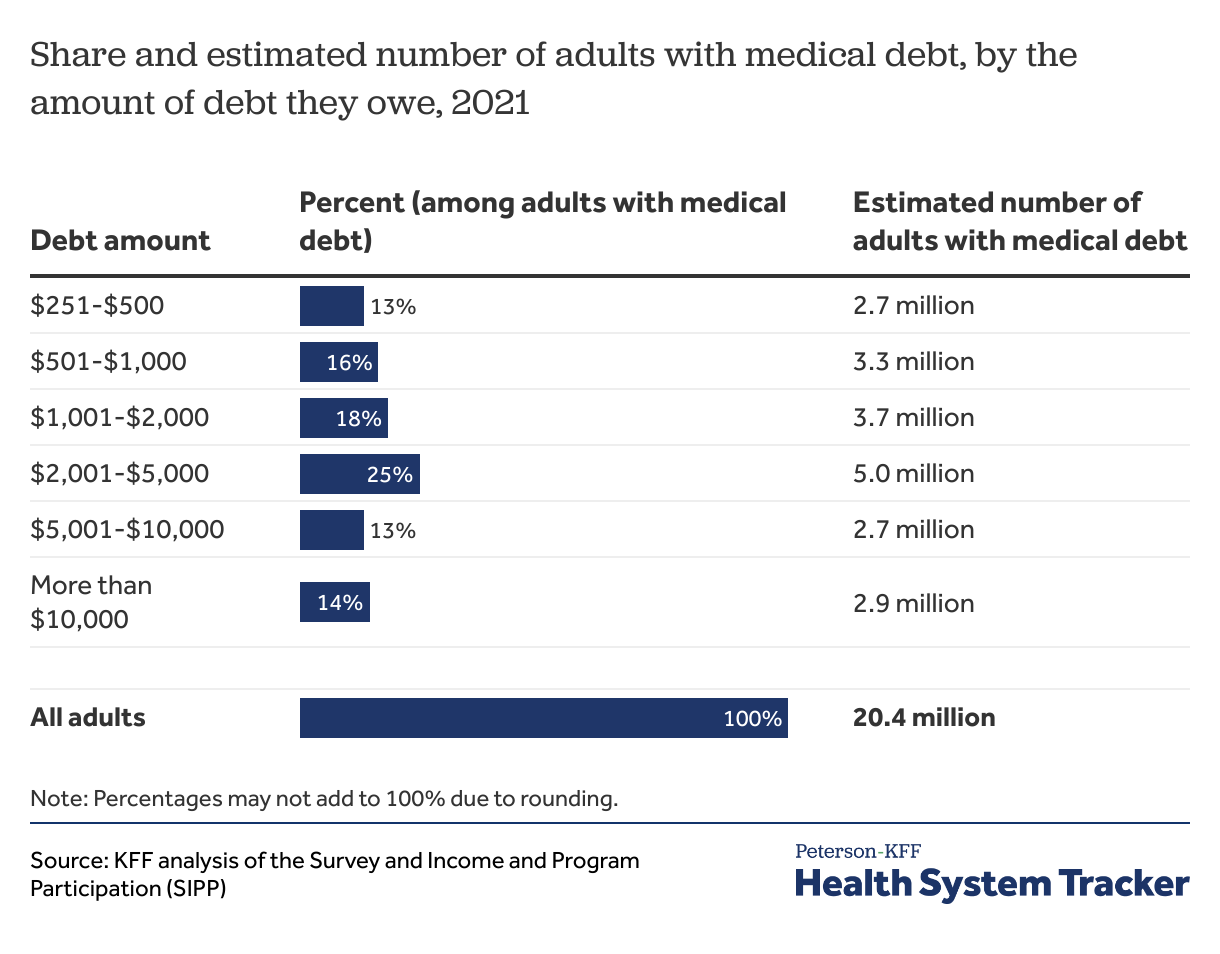
Most of the 20 million adults with medical debt owe over $1,000, and about half (11 million people) owe over $2,000. Among the 20 million adults with medical debt, about 3 million (13%) have debt obligations between $5,001 and $10,000, and another 3 million (14%) owe more than $10,000.
Approximately 6% of adults (14 million people) in the U.S. owe more than $1,000, 2% (6 million people) owe more than $5,000 in medical debt, and 1% of adults (3 million people) in the U.S. owe more than $10,000 in medical debt.
People in the U.S. owe at least $220 billion in medical debt and the bulk of that debt is owed by people with over $10,000 in debt
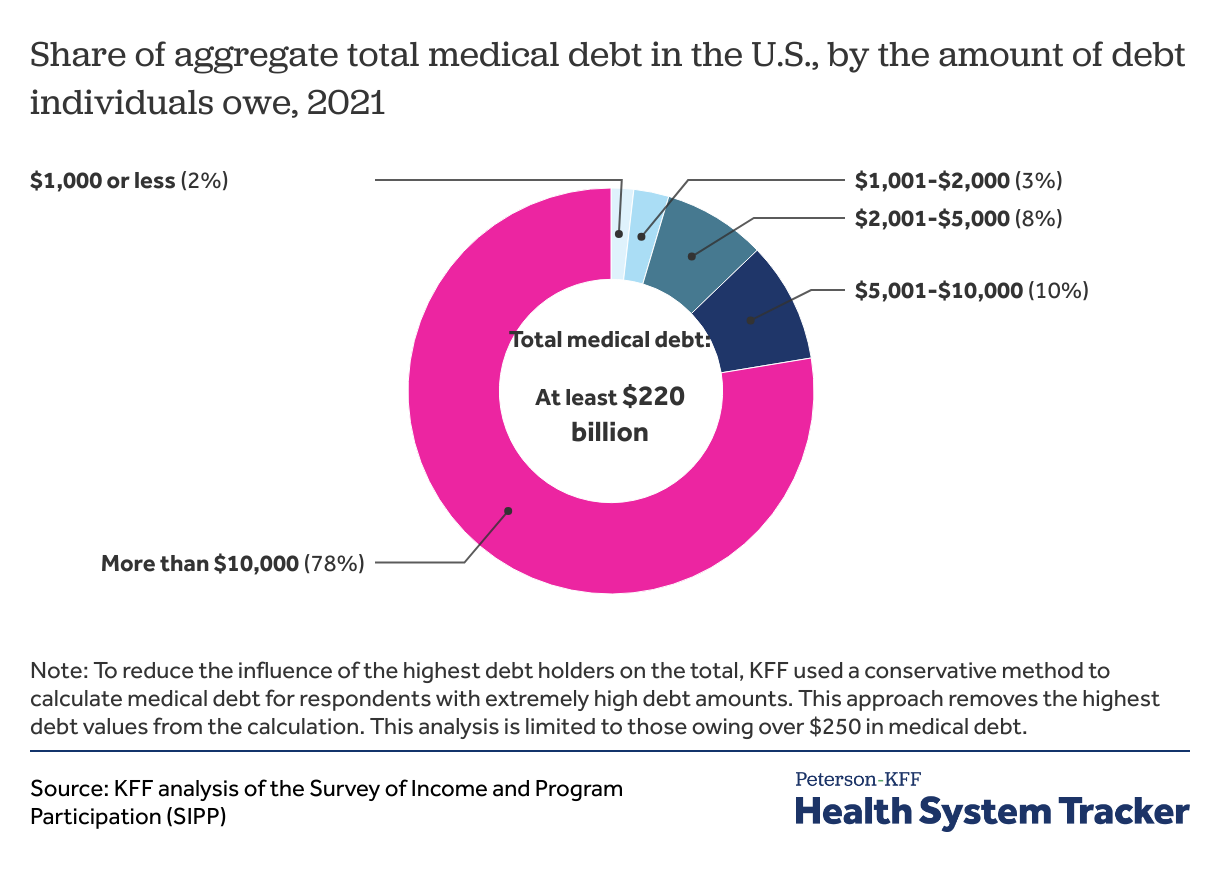
The total amount of medical debt is difficult to estimate. While surveys capture a larger share of people and more types of medical debt than analyses of credit reports, there are challenges in capturing data from people who owe high levels of debt. A small share of adults accounts for a large share of the total; for example, 0.3% of adults account for well more than half of the total medical debt. In SIPP, the aggregate amount of medical debt owed among the highest debt holders varies considerably from year to year. To reduce the influence of the highest debt holders on the aggregate amount of medical debt, KFF used a conservative method to calculate the total medical debt for respondents with extremely high debt amounts in SIPP. This approach essentially removes the highest debt values from the calculation. See Methods below for details.
Using this approach, the SIPP survey suggests that total medical debt owed was at least $220 billion at the end of 2021. This total represents the aggregate medical debt for people with over $250 and top coded up to $225,000 in medical debt. This is considerably less than the total medical debt reported in SIPP, but still much more than the total amounts estimated by others using credit reports.
The Consumer Financial Protection Bureau (CFPB) estimates that $88 billion in medical debt is reflected on Americans’ credit reports, though they acknowledge that the total amount of medical debt is likely higher because not all medical debt is visible to consumer reporting companies and those data only reflect debt among people with credit reports (not all adults). Medical debt can also be masked as other forms of debt, for example, when people pay for a medical expense on a credit card or fall behind on other payments to keep up with medical bills. On one hand, assessing total medical debt through surveys is difficult because a large share of total debt is held by a small share of people. On the other hand, surveys like SIPP may include medical debt that is not visible on credit reports or is otherwise disguised as another form of debt. This analysis suggests that the total amount of medical debt is likely much larger than the already large amount of medical debt reflected on credit reports.
The share of adults with medical debt varies considerably across the U.S.
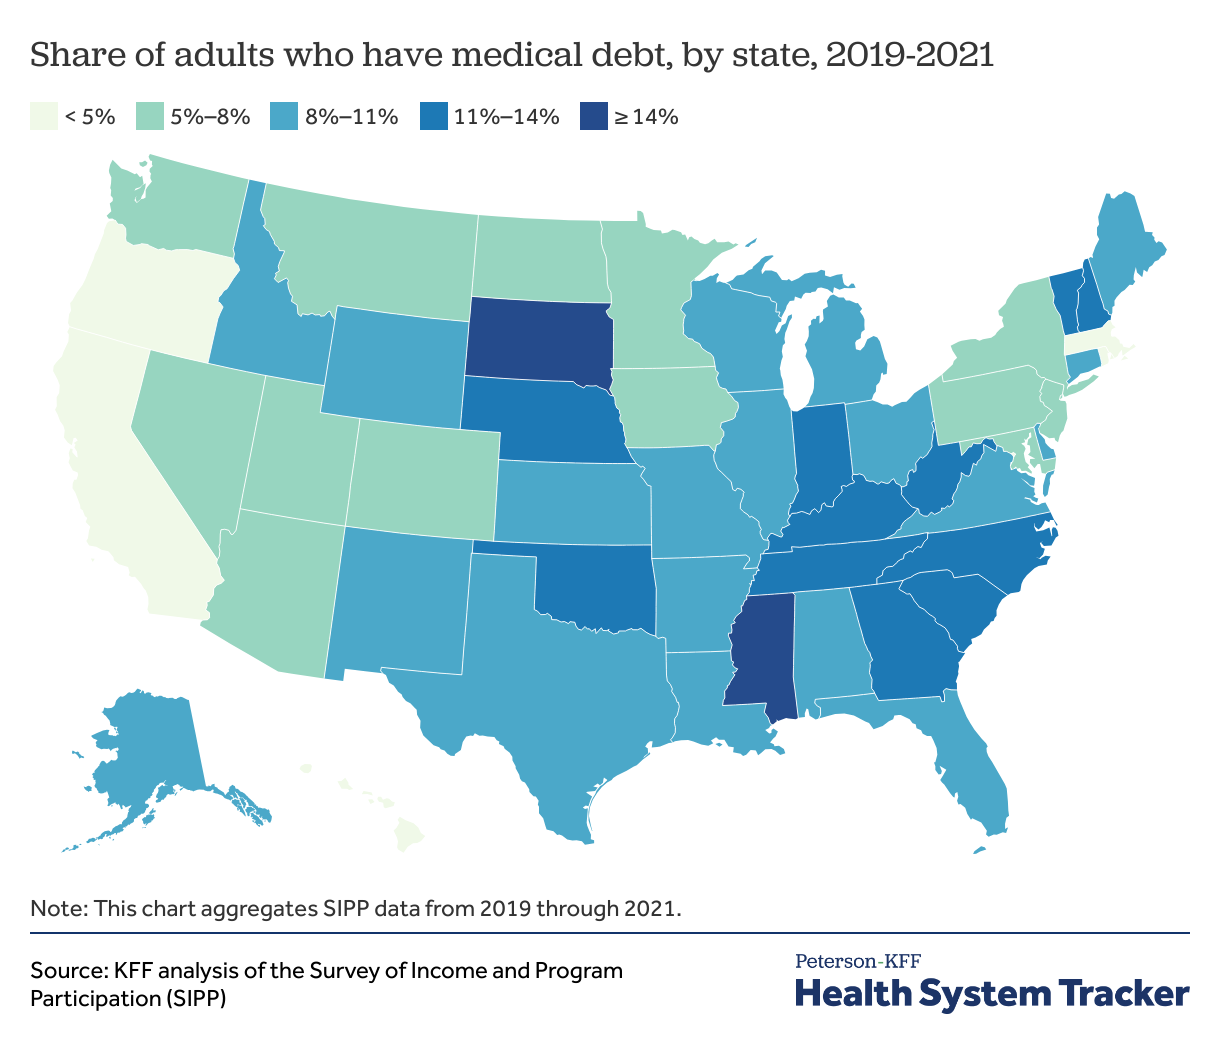
To bolster the number of respondents when analyzing medical debt at the state level, the chart above presents an average of the three most recent years of SIPP data. Annually on average, 8.6% of adults reported having medical debt between 2019 and 2021.
The burden of medical debt varies considerably from state to state. Hawaii (2.3%) and D.C. (2.7%) have the lowest share of adults with medical debt. States with the highest share of adults with medical debt include South Dakota (17.7%), Mississippi (15.2%), North Carolina (13.4%), West Virginia (13.3%), and Georgia (12.7%).
Discussion
Medical debt remains a persistent problem even among people with insurance coverage. Most Americans have private health insurance, which generally requires payment of a deductible, coinsurance, and copays for medical services and prescriptions. A serious injury or illness can cost thousands of dollars out-of-pocket to meet these deductibles and other cost-sharing requirements. For people with a chronic illness, even smaller copays and other cost-sharing expenses can accumulate to unaffordable amounts. Insured patients can also incur medical debt from care that is not covered by insurance, including for denied claims, and for out-of-network care.
Many Americans, even those with private health insurance, do not have enough liquid assets to meet deductibles or out-of-pocket maximums. Among single-person privately-insured households in 2019, 32% did not have over $2,000 saved. Among multi-person households where at least one household member has private insurance, 20% did not have savings over $2,000. Additionally, 16% of privately-insured adults say they would need to take on credit card debt to meet an unexpected $400 expense, while 7% would borrow money from friends or family. For these people, even a medical bill for a few hundred dollars can present major problems. A KFF poll suggests that people with unaffordable medical bills are more likely to delay or skip needed care to avoid incurring more medical debt, cut back on other basic household expenses, take money out of retirement or college savings, or increase credit card debt. People with medical debt are also more likely to have other forms of financial distress.
Medical debt can happen to almost anyone in the United States, but this debt is most pronounced among people who are already struggling with poor health, financial insecurity, or both. People who are very ill or living with a disability are also at risk of losing their employment or income due to illness. Shortcomings in both health insurance coverage and social safety net programs aimed at replacing income during a time of illness can compound to increase the likelihood that people with serious health care needs end up with large amounts of medical debt. There are also significant racial disparities, with Black Americans being much more likely than people of other racial or ethnic backgrounds to report owing medical debt.
The fact that medical debt is a struggle even among households with health insurance and middle incomes indicates that simply expanding coverage will not erase the financial burden caused by high cost-sharing amounts and high prices for medical services and prescription drugs.
Methods
The Survey of Income and Program Participation (SIPP) is a nationally representative survey of U.S. households. SIPP asked people aged 15 and older in the household whether they owe any money for medical bills not paid in full as of December 2021. Respondents were asked to exclude bills that will likely be paid by the insurance company. Households may include non-related persons cohabiting together. Respondents younger than age 15 were not asked about medical debt. A Census Bureau analysis of 2022 SIPP at the household level found 15% of households owed medical debt in 2021.
In this analysis, SIPP data is summarized at the individual level for adults ages 18 years and older. To identify people carrying more than small levels of debt, those reporting medical debt of $250 or less were excluded as some people have very small amounts of medical debt in SIPP. In SIPP, about 1.9 million people reported owing $250 or less in medical debt. Those owing small medical debts of $250 or less represented less than 0.2% of the total medical debt held. SIPP includes estimated debt amounts for people who reported high amounts of debt and these amounts can vary greatly from year to year. The total medical debt held was calculated among people owing over $250 in medical debt and capped up to $225,000 to avoid the influence of extremely high amounts in SIPP.
People with a disability are those who have difficulty with one or more of the six daily tasks (difficulty with hearing, seeing, cognitive, ambulatory, self-care, or independent living). The state-level analysis pools the three most recent years of SIPP data for sufficient sample size. The share of adults having medical debt in each state is a pooled average based on SIPP data from 2019 through 2021. See SIPP technical documentation for additional details.
The Peterson Center on Healthcare and KFF are partnering to monitor how well the U.S. healthcare system is performing in terms of quality and cost.