Pregnancy is one of the most common causes of hospitalization among non-elderly people. In addition to the cost of the birth itself, pregnancy also involves costs associated with prenatal visits as well as treatment for psychological and medical conditions that can arise during pregnancy, birth, and the postpartum period. Raising an infant also comes with additional medical costs, including a potential neonatal intensive care unit (NICU) stay after birth. An infant’s medical costs can continue to accumulate over time, which only adds to the financial burden that families already face from the costs of the delivery.
To examine the health costs associated with pregnancy, childbirth, post-partum care, and infancy, a subset of claims from the Merative MarketScan Encounter Database were analyzed from 2021 through 2023 for enrollees with employer-sponsored health insurance plans and their young (two years old or less) children. This analysis compares health spending (both the amount paid by insurers and out-of-pocket costs paid by enrollees) for reproductive-age enrollees who gave birth compared to those who did not.
On average, the health costs associated with pregnancy, childbirth, and post-partum care amount to $20,416, including $2,743 in out-of-pocket expenses, for women enrolled in employer plans. Childbirth and post-partum health spending among employer health plan enrollees varies by the type of delivery; costs for pregnancies resulting in a vaginal delivery average $15,712 ($2,563 of which is paid out-of-pocket), while those resulting in cesarean section (C-section) average $28,998 ($3,071 of which is paid out-of-pocket). Additionally, the medical costs associated with toddlers in their first two years of life average $16,575, with $1,511 paid out-of-pocket.
How much does pregnancy, childbirth, and post-partum care cost?
Some previous analyses of the costs associated with pregnancy and childbirth have focused on specific services, such as vaginal and cesarean deliveries, or services with a pregnancy or neonatal diagnosis code. However, looking only at specific claims can overlook other aspects of care associated with pregnancy and birth, including psychological care, physical therapy, and treatment of other pregnancy-related conditions that might not be directly billed under pregnancy-specific codes.
Related Content:
This analysis takes a different approach. By using a regression model that controls for age, the average difference in health spending for women of reproductive age who give birth compared to those of the same age who do not give birth is calculated. The benefit of this approach is that it captures not only the cost of the delivery, but all health costs related to pregnancy, childbirth, and postpartum care. This analysis is limited to people who give birth in a hospital (whether live birth or stillbirth) and excludes pregnancies ending in abortion or miscarriage.
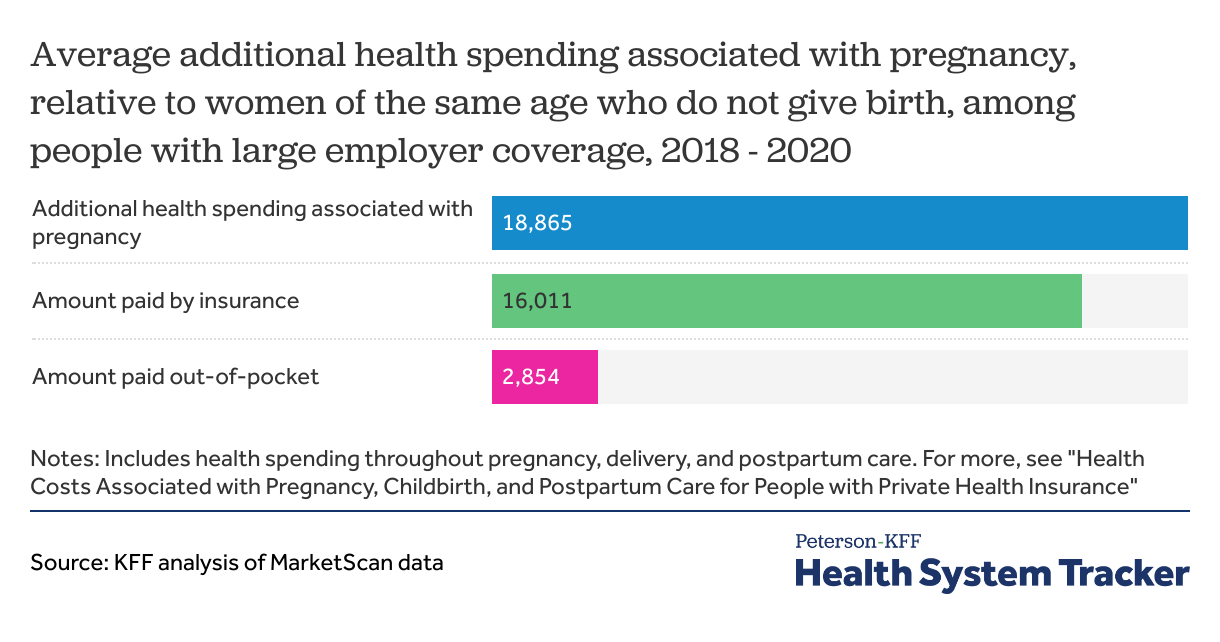
It is estimated that pregnant women of reproductive age (ages 15 to 49) enrolled in an employer health plans incur an average of $20,416 more in health care costs compared to those who do not give birth. This additional health spending associated with pregnancy, delivery, and post-partum care includes both the amount paid by insurance (an average of $17,674) and the out-of-pocket costs paid by the enrollee (an average of $2,743). There is significant variation around these averages, based on a variety of factors, including the type of delivery.
How much pregnancy-related health spending is for hospitalizations and outpatient care?
While pregnant women typically have frequent outpatient office visits prior to giving birth, the majority of pregnancy-related health spending is attributed to the delivery itself. On average, pregnant women in employer plans incur $22,168 more in inpatient and outpatient costs than women of the same age who do not give birth. However, prescription drug spending averages $1,751 less for women who give birth compared to those who do not. This difference reflects a lower likelihood of pregnant women using prescription drugs, including common medications like birth control pills (oral contraceptives), which are one of the must used types of prescription drugs for women of reproductive age. Additionally, several other common prescription drugs, such as some antifungal treatments, can be unsafe to take during pregnancy. It is important to note that this data only includes spending on retail prescription drugs and does not account for out-of-pocket spending on prenatal vitamins or over-the-counter drugs that pregnant women may use. Drugs administered during hospitalization are included as inpatient spending.
The frequency and intensity of services typically used during pregnancy, such as prenatal visits, lab tests, and delivery-related care, are a considerable expense for both enrollees and insurers. Given the high cost of pregnancy, some insurers have developed alternative payment models, electing to pay for the cost of these services with a bundled payment.
In total, pregnant women incur $2,743 more in out-of-pocket costs than women of the same age who do not give birth. These out-of-pocket costs reflect health plan cost-sharing (deductibles, coinsurance, and copayments), but do not include spending on fertility care, which is generally missed because these services are often not covered by insurance. Similarly, balance bills sent by out-of-network providers directly to patients are not captured in this data. Previously, KFF estimated that 10% of in-network admissions for maternity care included an out-of-network charge, putting patients at risk for surprise medical bills. However, as of January 2022, the No Surprises Act has prohibited surprise billing by out-of-network providers when a patient is admitted at an in-network hospital.
How do pregnancy and childbirth costs vary by type of delivery?
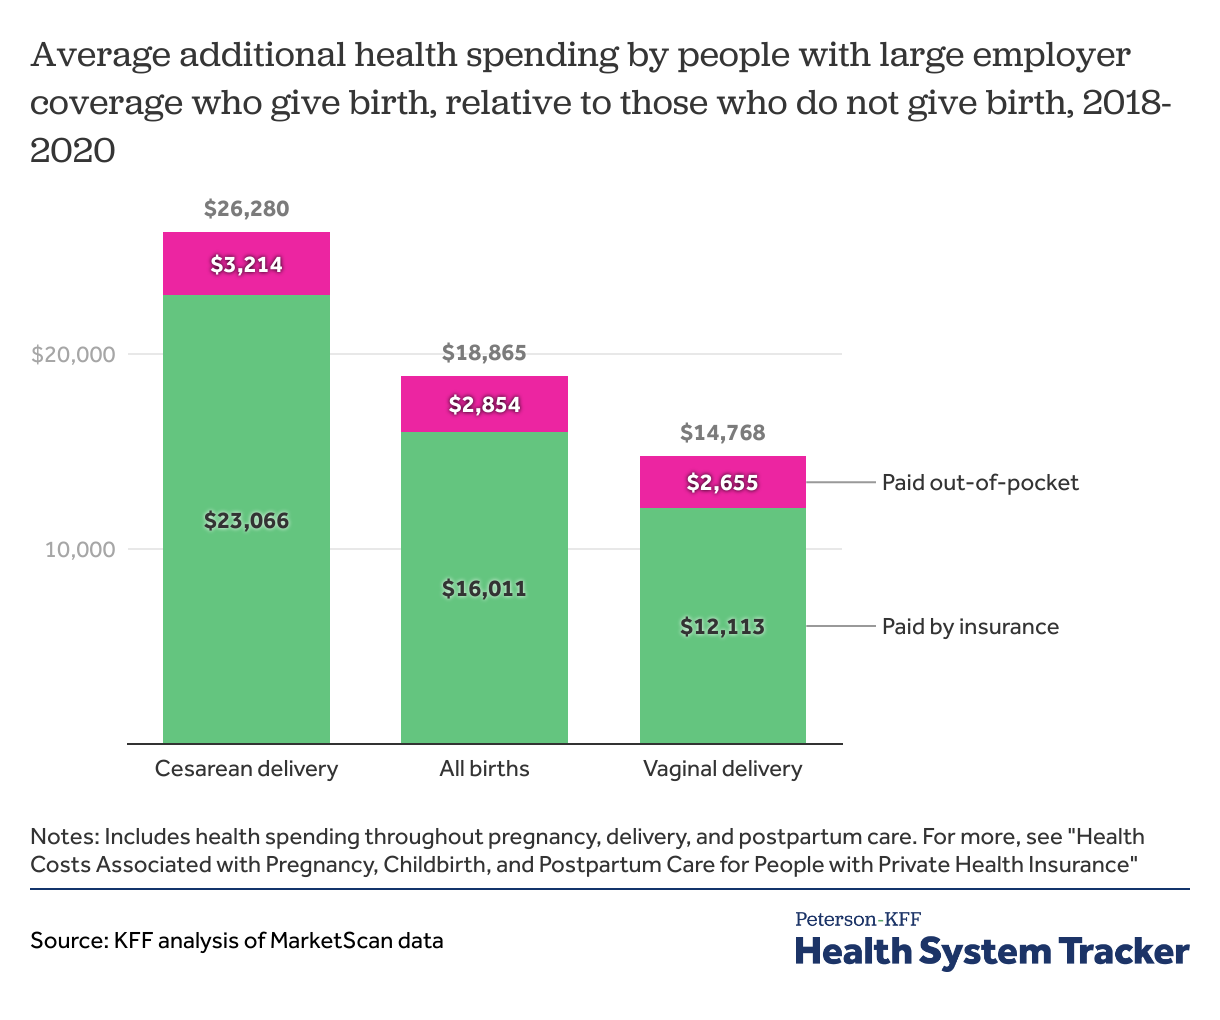
Health costs associated with pregnancy, childbirth, and post-partum care vary significantly depending on whether the baby is born by cesarean section or vaginal delivery. Over the course of their pregnancy, delivery, and post-partum period, employer plan enrollees who have a cesarean section incur an average of $28,998 more in total healthcare costs than those who do not give birth. About a third of all deliveries in the United States are by caesarean (32.3% in 2023). In contrast, women who have a vaginal delivery incur an average of $15,712 in total healthcare spending.
The total cost of pregnancy, delivery, and post-partum averages over $20,000, and out-of-pocket costs average $2,700.
The higher costs associated with cesarean births stem not only from the procedure itself, but also from increased expenses before and after delivery. These additional costs may be linked to more intensive care related to delivery complications, underlying health conditions that contribute to the need for a cesarean, and the extended recovery process following surgery.
On average, out-of-pocket costs associated with pregnancy, childbirth, and post-partum care are also higher for women who deliver via cesarean section ($3,071) than for those with vaginal deliveries ($2,563). However, while the total average cost of a pregnancy resulting in a cesarean section ($28,998) is 85% higher than that of a vaginal delivery ($15,712), average out-of-pocket costs are only 20% higher for women who have a cesarean section ($3,071) than those with a vaginal delivery ($2,563). This discrepancy is largely because enrollees with an inpatient admission often reach their plan’s deductible or out-of-pocket maximum, meaning that the higher cost hospitalizations do not always result in proportionally higher out-of-pocket spending, depending on the plan design.
How much does infant and toddler health care cost?
In addition to the cost of pregnancy and birth, families face additional healthcare expenses once the child comes home from the hospital. Many newborns enroll in a parent’s employer-sponsored plan and begin to incur additional health care costs as they receive care.
To assess the health care costs of infants and toddlers to health plans and families, this analysis examined children born between 2021 and 2023 who were continuously enrolled in an employer-sponsored plan. Spending was calculated for children of different ages: those with between 0 and 3 months of enrollment and those with between 18 and 24 months of enrollment.
Newborns, defined as children with fewer than three months of enrollment, had average total health care spending of $5,820, including $475 in out-of-pocket costs. Spending generally increases as children age. Toddlers, defined as children between 18 and 24 months of enrollment, had an average total spending of $16,575, including $1,511 in out-of-pocket costs over the course of their lives. For many children less than two, the vast majority of their spending was in the first month of their life.
How are infant healthcare costs affected by a NICU admission?
An infant’s healthcare costs are impacted by the type of care they require after birth. Babies who need specialized care or who are born prematurely are typically admitted to the neonatal intensive care unit (NICU), with the level of care depending on the severity of their condition. Otherwise, newborns are typically admitted to the well-baby nursery or roomed with their parents. Across payers, nearly ten percent of newborns are admitted to the NICU.
Children who had been admitted to the NICU after birth accumulate 5 times more in healthcare costs over their first 18-24 months of enrollment than those who do not have to be admitted to the NICU.
On average, children between 18 and 24 months old who are enrolled in a parent or guardian’s employer health plan incur $14,268 in total healthcare costs if they were not admitted to a NICU as newborns. The families of these children face $1,724 in out-of-pocket expenses over this period. In comparison, a child between 18 and 24 months of age who was admitted to the highest-level NICU (Level IV), an intensive care unit reserved for newborns with complex neonatal conditions, incurs an average total cost of $117,878, including $3,265 in out-of-pocket expenses. Overall, children admitted into the NICU as newborns incur an average of $77,992 in healthcare costs, including $3,021 in out-of-pocket costs for their first 18-24 months of life. The higher costs associated with NICU admissions may reflect not only the hospital care provided during the NICU stay but also additional health care needs after discharge.
Infants admitted to the highest-level NICU average over $3,000 in out-of-pocket spending in the first two years of life.

For toddlers who were admitted into the NICU after birth, a longer stay results in higher health spending. A toddler who had a NICU admission of 4 days or fewer incurs an average total health cost of $41,037 by the time they are between 18 and 24 months old, compared to an average of $120,972 in health costs for toddlers who had spent more than 4 days in a NICU after birth.
What are the implications of high out-of-pocket costs for pregnancy, childbirth, and childcare?
About half of people who give birth each year are covered by private insurance, and the other half is typically covered by Medicaid, which generally has little or no out-of-pocket costs. However, for parents covered by private insurance, the frequency and intensity of services associated with pregnancy, childbirth, and infant care can lead to considerable out-of-pocket expenses.
On average, pregnant women enrolled in employer health plans incur $2,743 more in out-of-pocket costs over the course of their pregnancy compared to similar women who are not pregnant. These costs are more than many families can afford. In fact, roughly one third of multi-person households and half of single-person households lack the liquid assets necessary to cover typical out-of-pocket costs associated with pregnancy and childbirth under private health plans.
One consequence of these high out-of-pocket costs may be a higher rate of medical debt for those giving birth. New mothers are twice as likely to have medical debt compared to young women who did not recently give birth. Among women ages 18-35, 14.3% of those who gave birth in the last 18 months had medical debt exceeding $250, compared to only 7.6% of women in the same age group who did not give birth.
Methods
This analysis uses claims from the Merative Health Analytics MarketScan Commercial Claims and Encounters Database, which contains claims information from employer sponsored health plans. Enrollees can be tracked for the duration of their enrollment at one contributing entity (employers and plans). This analysis uses a subset of claims for enrollees covered between 2021 through 2023. All dollar values are reported in 2023 nominal dollars. To make MarketScan data more representative of those with employer sponsored health insurance, weights were applied to match counts by state, sex, and age in the Current Population Survey. The data file contains records on 17,800,000 of 11% percent of the 165,500,000 people with employer coverage.
The cost of pregnancy is estimated among female enrollees between ages 15 and 49 who were continuously enrolled during the 2021-2023 period, to avoid including costs for women who changed coverage during the pregnancy. In total, this analysis used claims for almost 2,672,900 female enrollees, which represents about 11% women of reproductive age enrolled in employer plans.
MarketScan assigns a DRG to each admission using the Centers for Medicare & Medicaid Services (CMS) Grouper. This method selects a DRG for the admission based on the diagnosis and procedures a patient received during the stay. Women are identified as having a pregnancy if, between August 2021 and September 2023, they had an admission that was designated as a delivery (765-768, 774-775 783-788, 796-798 & 805-807). Spending was modeled for these enrollees between January 2021 and December 2023, controlling for age and whether they had multiple pregnancy related admissions over that period. This method does not include the cost of pregnancy for enrollees who do not give birth (i.e., those pregnancies ending in a miscarriage or abortion).
Estimates of infant costs are limited to children born between 2021 and 2023 who are 24 months old or younger. In this analysis, days of continuous enrollment are used as a proxy for age, since health costs for infants and toddlers are analyzed in 3-month intervals. Age is estimated based on the number of months a child was continuously enrolled and confirmed to be born within the 2021–2023 period. For example, a child born in 2022 with 4 months of coverage in 2022 and 12 months in 2023 would be recorded as 16 months old. To avoid including infants with unknown birth dates, we excluded records of children who were not present in the 2021 file and had exactly 365 days of continuous enrollment. NICU admissions were identified using revenue codes: codes 0170 and 0171 were used to define normal newborn care, newborn stays in the parent’s room, and well-baby nursery admissions, while codes 0172, 0173, and 0174 defined more complex nursery care and NICU admissions. Infants records without a revenue code were dropped for this analysis. Infant spending is highly skewed, so spending was trimmed at the 99.5th percentile to reduce the influence of outliers on average cost estimates.
Claims data available in MarketScan allows an analysis of liabilities incurred by enrollees with some limitations. First, these data reflect cost sharing incurred under the benefit plan and do not include balance-billing payments that beneficiaries may make to health care providers for out-of-network services or out-of-pocket payments for non-covered services, meaning that costs associated with pregnancy may be understated. Fertility treatments are often not covered by insurance and would therefore be excluded. Secondly, claims data show the retail cost for prescription drugs and do not include information about the value of rebates that may be received by payers. Third, when showing how spending is divided across types of care (i.e., health services and prescriptions), spending on inpatient and outpatient care was combined because global billing is commonly used for maternity services. In claims data, inpatient costs will therefore sometimes include all services for routine prenatal care, delivery services, and postpartum care since the global maternity claim is typically billed the day of delivery. These costs reflect the additional costs of covering someone who is pregnant and not the cost of being pregnant. Pregnant people on average use more health care but may delay or avoid some elective procedures until after their pregnancy. Lastly, sex is defined as reported on the claim, and the gender identity of the enrollee cannot be identified.
This analysis does not account for health status before the pregnancy. It is possible women who give birth are somewhat healthier on average going into their pregnancies than women of the same age who do not give birth. Conversely, it is also possible that health conditions present before pregnancy may be incidentally discovered during pregnancy. Although health status is not controlled for, health status and spending are strongly correlated with age, which is controlled for.
The Peterson Center on Healthcare and KFF are partnering to monitor how well the U.S. healthcare system is performing in terms of quality and cost.