In a given year, a small portion of the population is responsible for a very large percentage of total health spending. We tend to focus on averages when discussing health spending, but individuals’ health status – and thus their need to access and utilize healthcare – varies over the course of their lifetimes. In fact, very few people have spending around the average.
This collection of charts explores trends in health spending variation across the population through an analysis of the Medical Expenditure Panel Survey (MEPS) data.
People age 55 and over account for over half of the total health spending
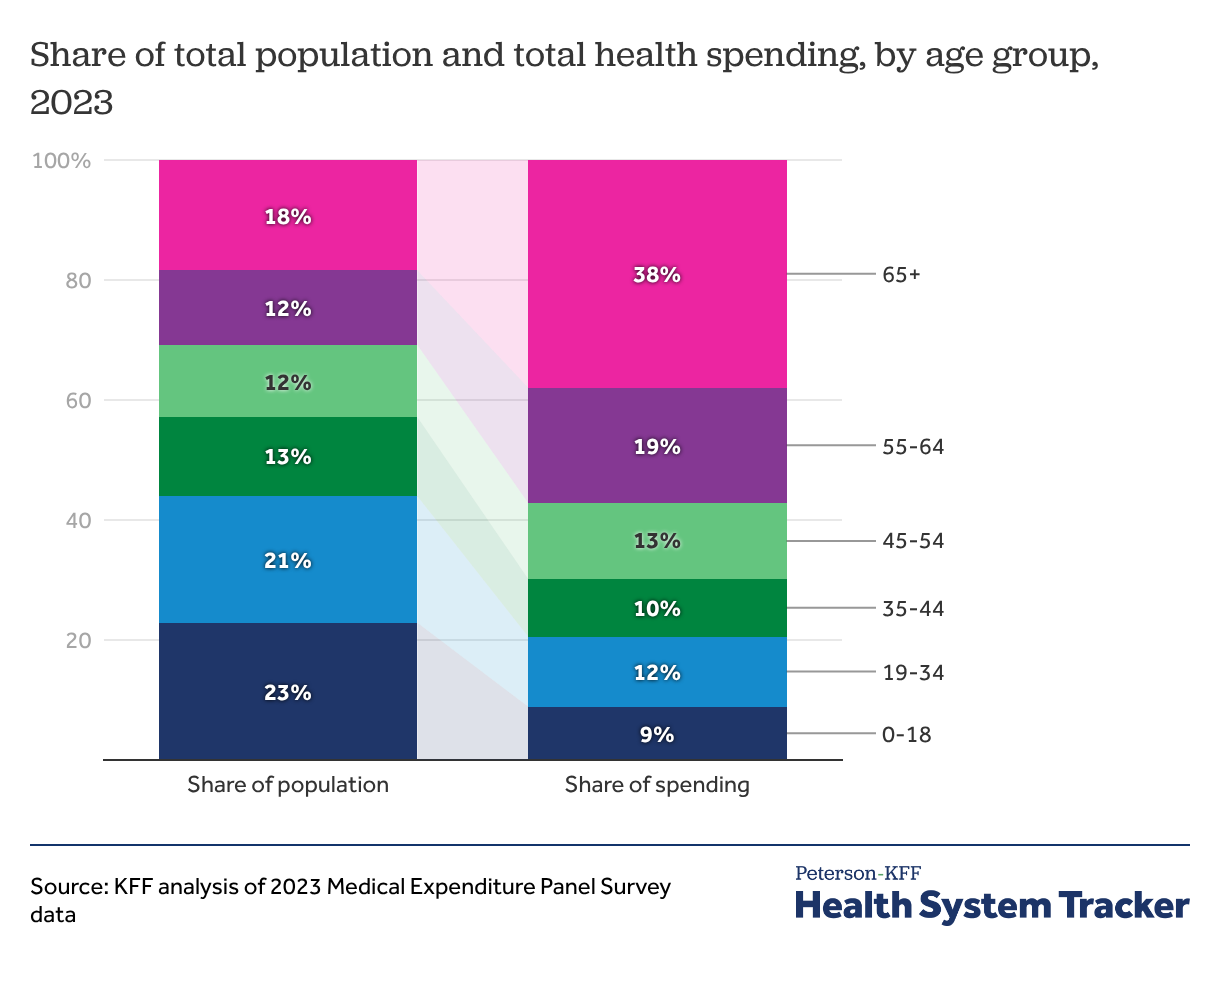
Health spending often increases with age, as we generally have more health conditions and need more care as we grow older. While there are people with high spending at all ages, overall, people age 55 and over accounted for 57% of total health spending in 2023, despite making up only 30% of the population. In contrast, people under age 35 made up 44% of the population but were responsible for only 21% of health spending.
According to MEPS data, in the U.S., most of the population (89%) reported “good” or better health. Only 2% reported being in poor health. As people age, they are more likely to experience health complications and utilize healthcare. Among people 65 and over, 19% report their overall health as “fair” or “poor,” compared to 9% among people under 65.
A small share of the population incurs most health spending, including among older adults and people reporting fair or poor health status
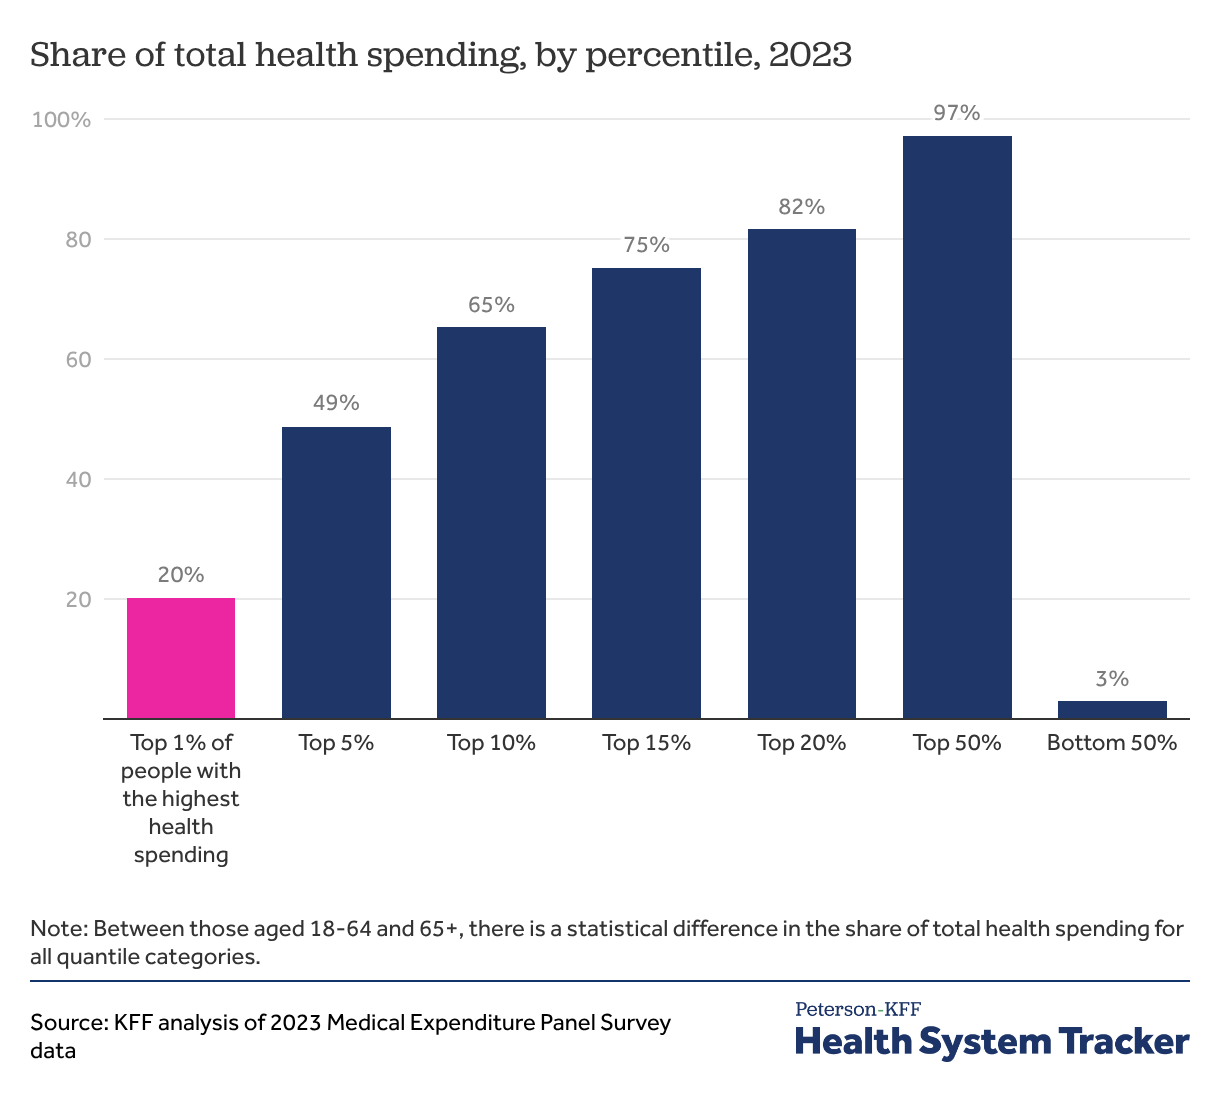
A small portion of the population accounts for a large share of health spending in a year. Although we tend to focus on averages, few people have spending around the average, since individual health needs vary over the life course. Some portions of the population (older adults and those with serious or chronic illnesses) require more and higher-cost healthcare than those who are younger or otherwise typically in need of fewer and less costly types of healthcare.
In 2023, 5% of the population accounted for nearly half of all health spending. The 5% of people with the highest health spending had an average of $72,918 in health expenditures annually; people with health spending in the top 1% had average spending of $150,467 per year. At the other end of the spectrum, the 50% of the population with lowest total health spending accounted for only 3% of all health spending; the average spending for this group was $433. Roughly 14% of the population had $0 in health expenditures in 2023.
Health spending is concentrated even within populations with relatively high average health costs, such as those with the most health conditions. Among people reporting fair or poor health, the top 10% of people with the highest health spending accounted for 54% of total health spending.
Considerable spending variation exists between those who are 65 and over and those under the age of 65, with younger persons experiencing more concentrated health spending. In 2023, half (50%) of all health expenditures among adults ages 18 through 64 was concentrated in people in the top 5% of total health spending while a similar percentage (53%) of all health expenditures among adults 65 or older was concentrated in people in the top 10% of total health spending.
Although health spending for families includes people with higher and lower spending within each family, the distribution of family spending is almost as skewed as for individual spending. In 2023, one percent of all families accounted for 13% of all health spending. Families in the top 5% of health spending accounted for about 35% of all spending.
Related Content:

Out-of-pocket spending is concentrated similarly to overall health spending
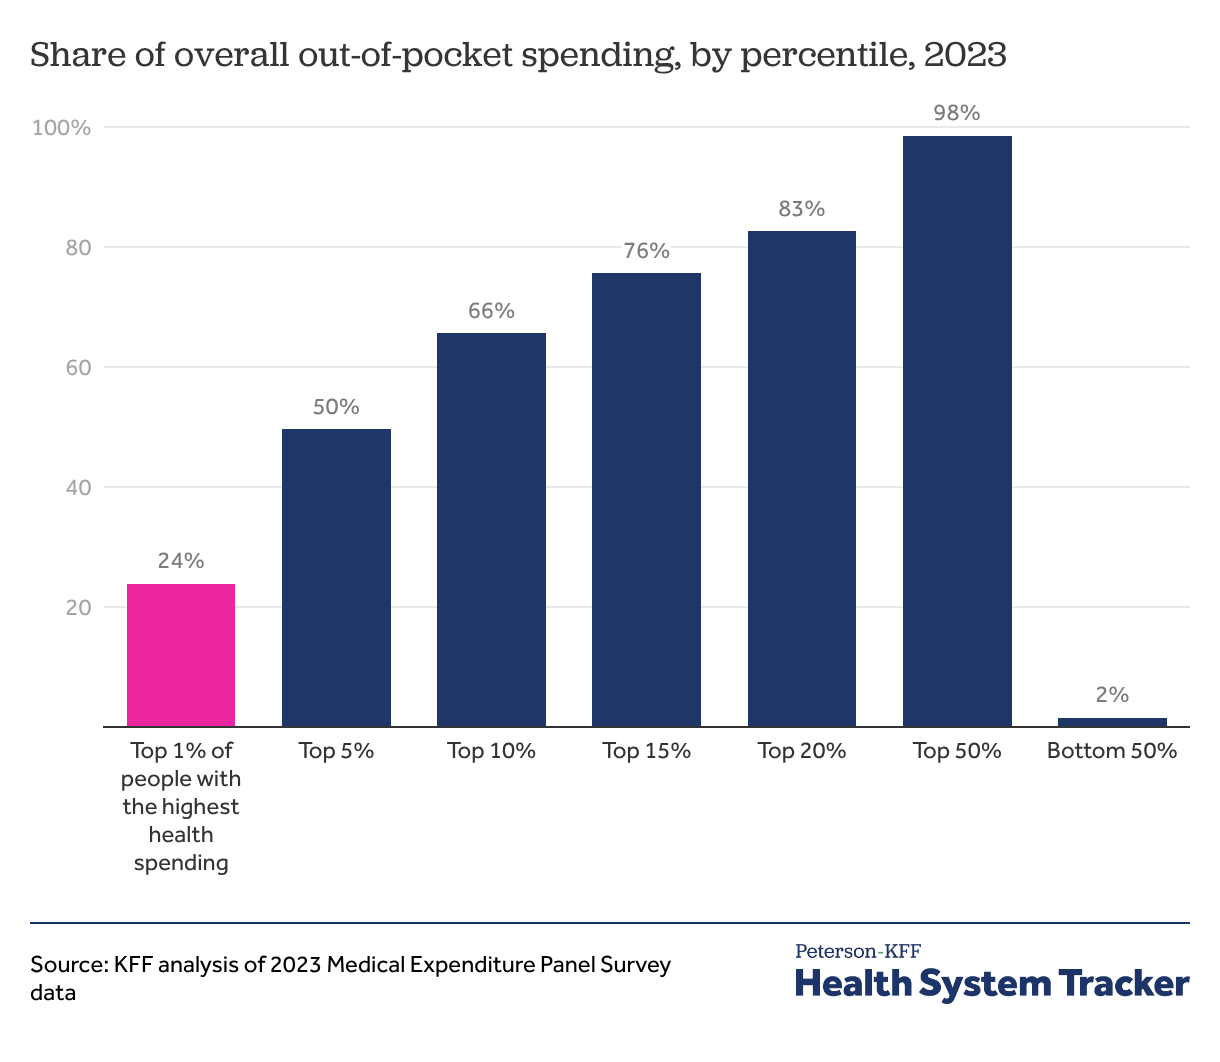
Out-of-pocket spending includes direct payments to providers and cost sharing but does not include out-of-pocket premium payments or contributions towards health coverage. Out-of-pocket health spending is similarly concentrated among high-health-need individuals. This small portion of the population accounts for a substantial share of total out-of-pocket health spending in a year.
Just one percent of the population accounted for 24% of all out-of-pocket spending for healthcare in 2023. People in the top 5% of out-of-pocket health spending accounted for half (50%) of all out-of-pocket spending in the country. At the other end of the spectrum, the half of the population with the lowest out-of-pocket health spending accounted for just 2% of all out-of-pocket spending.
On average, people in the top one percent of out-of-pocket spending paid $23,850 out-of-pocket for healthcare per year, and people in the top 10% spent $6,567 out-of-pocket per year. Many people have little or no out-of-pocket spending on medical care. People who are in the bottom 50% of out-of-pocket spending spent an average of just $31 out-of-pocket in 2023.
On average, patients with high needs have higher spending across all types of healthcare
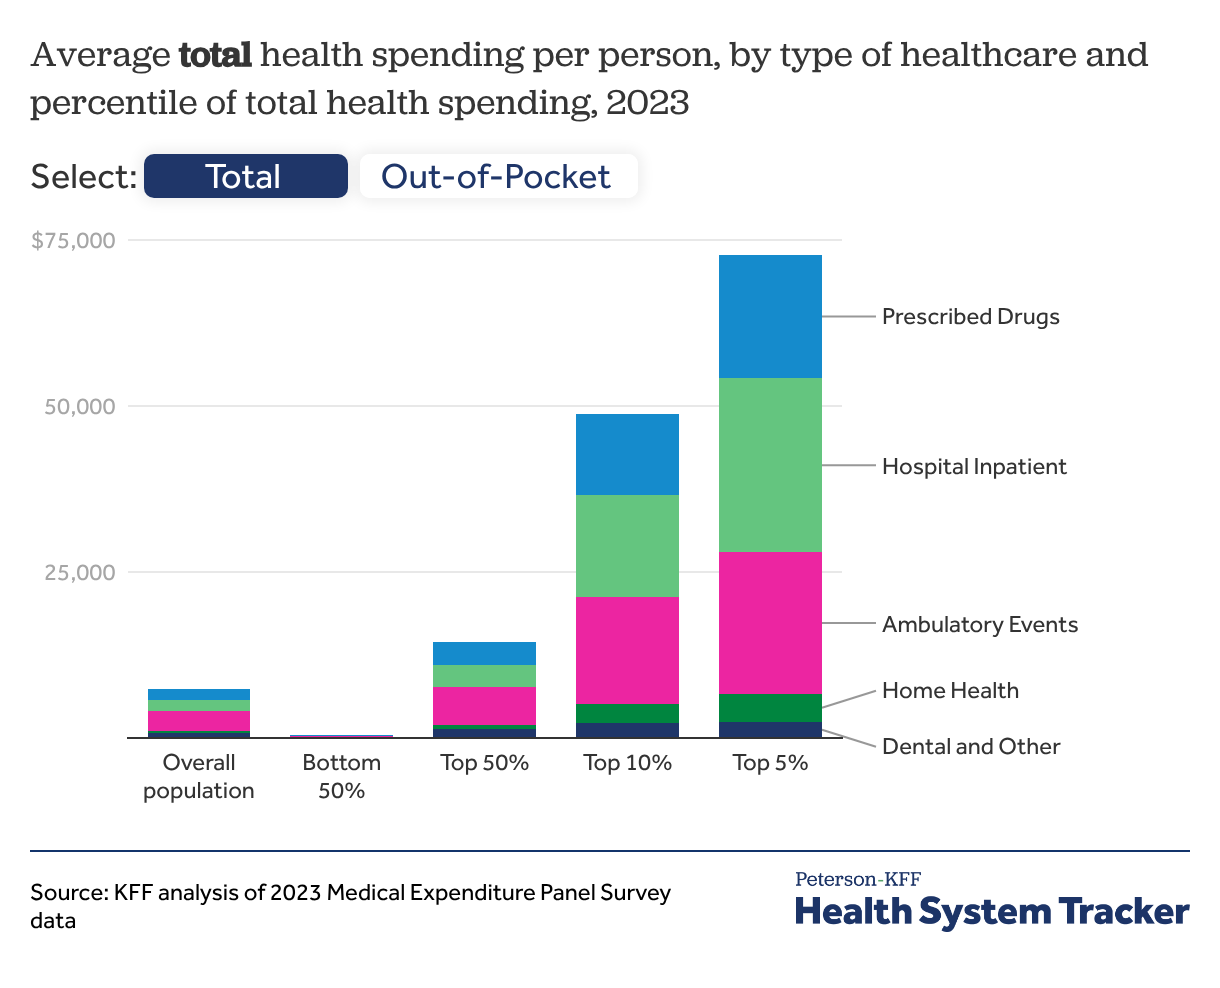
People in the bottom 50% of total health spending had average inpatient expenses of less than one dollar, compared to an average of $26,217 annual inpatient spending for people in the top 5%. The patients with the highest health spending also have higher prescription drug spending: individuals in the top 5% had average health spending of about $18,642 a year, compared to the overall average of $1,702.
Average out-of-pocket spending for all types of healthcare is also concentrated among people with higher spending. In 2023, people in the top 5% of out-of-pocket health spending spent an average of $1,207 for prescription drugs, while people in the bottom 50% spent $9 on average. This concentration of out-of-pocket spending is true for other types of healthcare as well. People in the top 5% of out-of-pocket spending spent on average $1,093 on inpatient stays, while individuals in the bottom 50% had virtually no inpatient stays or inpatient out-of-pocket spending. People in the top 5% of out-of-pocket spending made up 90% of home health out-of-pocket spending, 80% of inpatient out-of-pocket spending, and 51% of all ambulatory out-of-pocket spending.
Individuals in the top 5% of health costs make up the majority of total health spending for specific categories of healthcare expenses. Patients in the top 5% of health spending account for 63% of all home health expenses and 79% of all hospital inpatient expenses. They also account for nearly half of all prescription drug spending. Ambulatory, or outpatient, expenses, however, are more evenly spread across the population overall.
Related Content:
Diagnosis with a serious or chronic health condition is associated with higher health spending
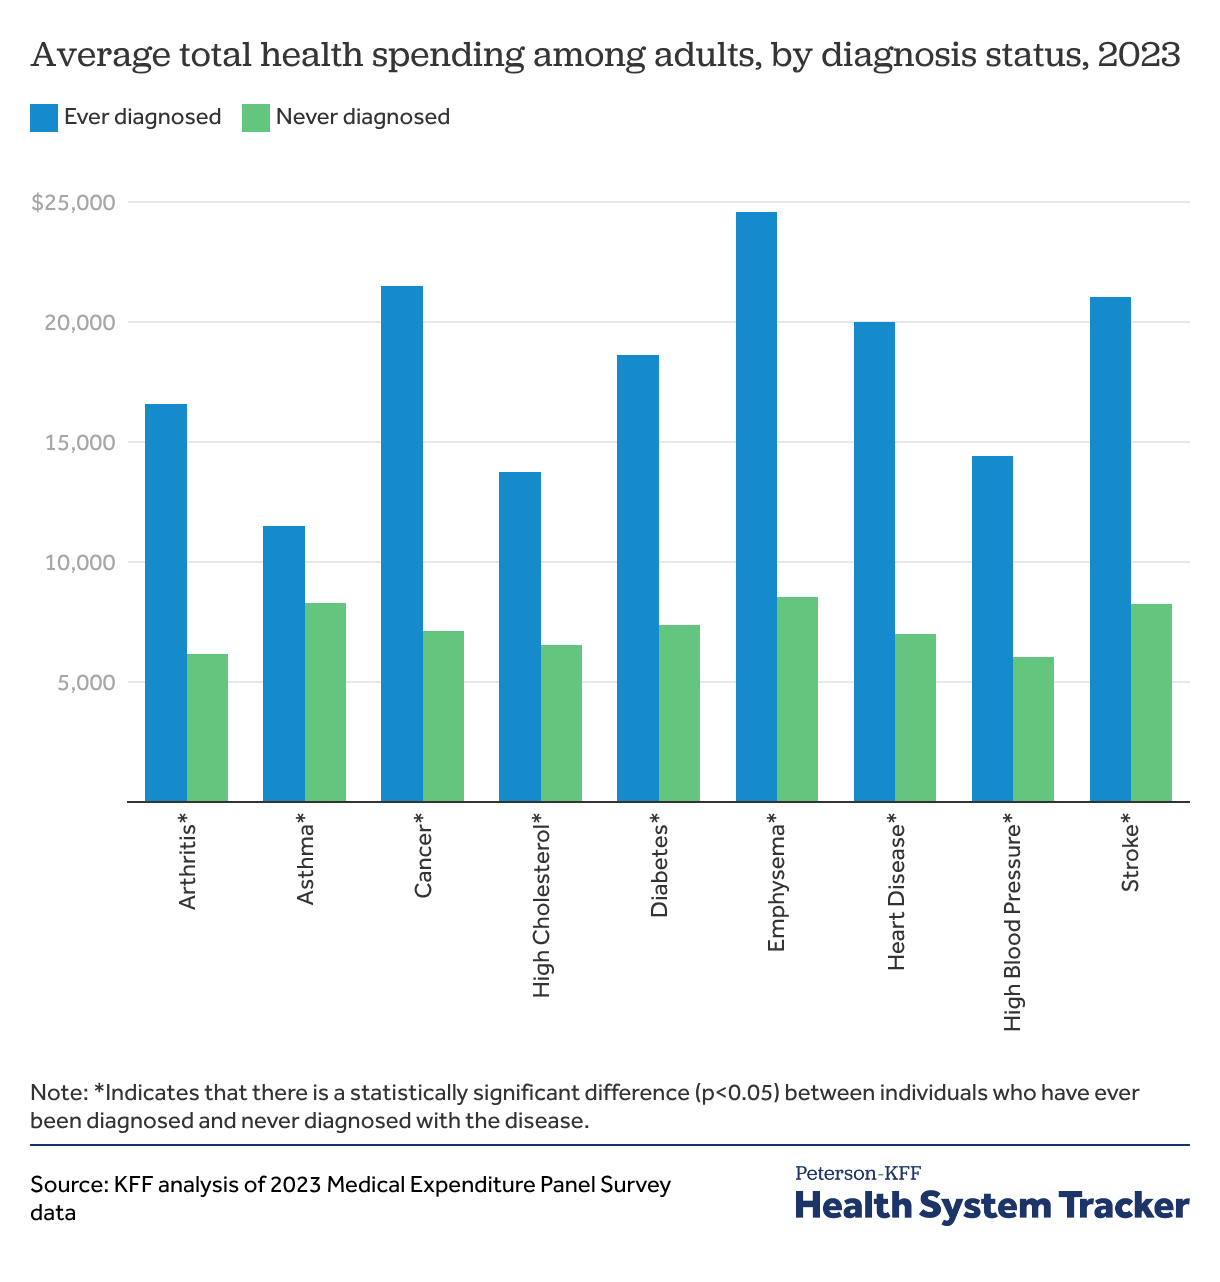
In addition to age and overall health status driving health expenses, adults with a current or prior diagnosis of certain chronic health condition(s) have much higher spending on average than people without these conditions. Among the listed diseases in the chart above, hypertension disease is most prevalent, impacting roughly one in three adults, and for those with hypertension, their average health spending is over two times as much as adults without. Cancer is also prevalent, with around 10% of adults having ever been diagnosed. Having a cancer diagnosis increases average health spending by over three times compared to those without, averaging over $21,000 per year per person.
The chart above shows current health care spending for people who have ever been diagnosed with a given condition (reflecting active treatment, as well as unrelated medical care), and people may have more than one chronic condition.
Diagnosis with a serious or chronic health condition is associated with higher out-of-pocket spending
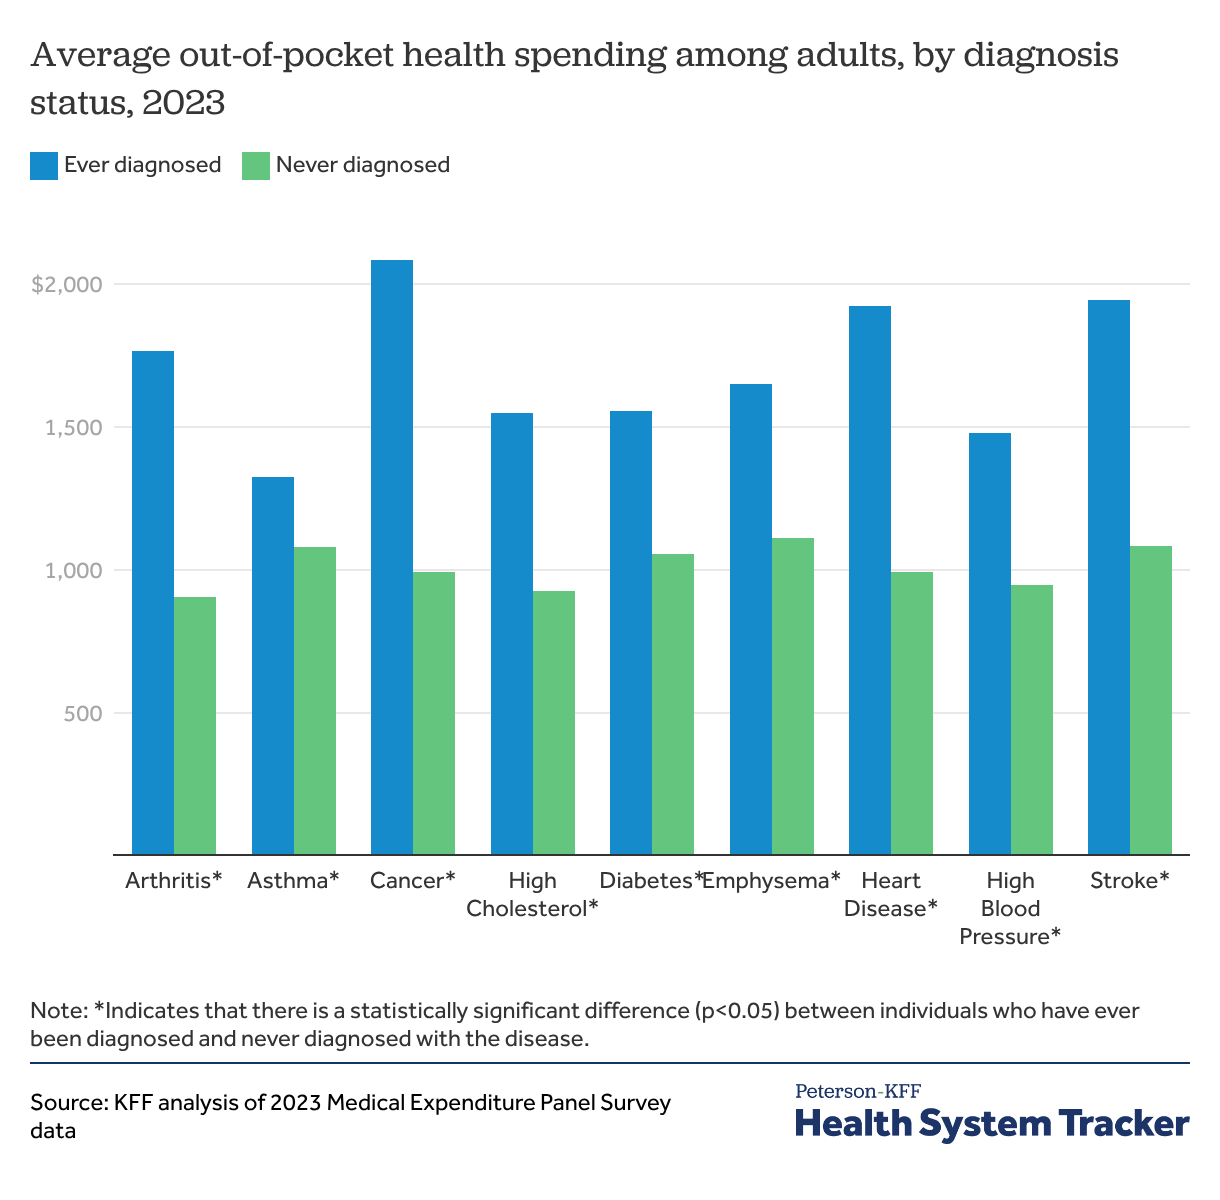
Adults who have been diagnosed with a serious or chronic disease have significantly higher out-of-pocket spending. Among adults, individuals who have been diagnosed with diseases like cancer, heart disease, or arthritis can have out-of-pocket spending twice as high as those who have not been diagnosed.
In addition to the above conditions, compared to people without a mental health diagnosis, privately insured people with depression and/or anxiety spend almost twice as much out-of-pocket.
Women have higher health spending than men, particularly women of reproductive age
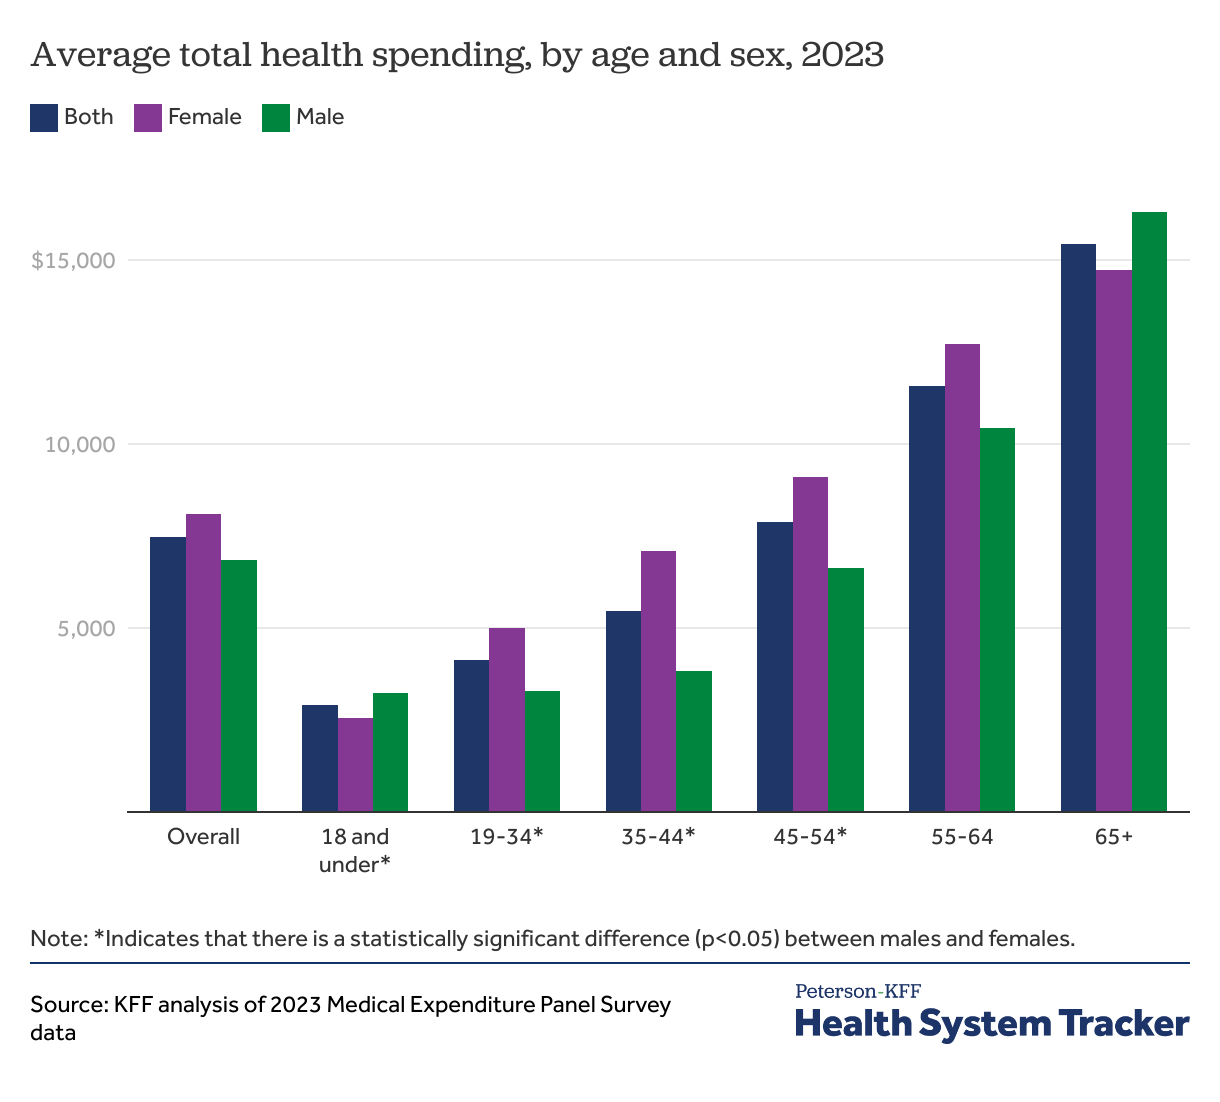
Average health spending increases throughout adulthood for both men and women, but at somewhat different rates. Women have higher health spending than men in their 20s, 30s, and early 40s, largely due to pregnancy and delivery-related care. Spending differences between men and women are not statistically significant in older age groups.
White people in the U.S. have higher health spending than those in other racial and ethnic groups
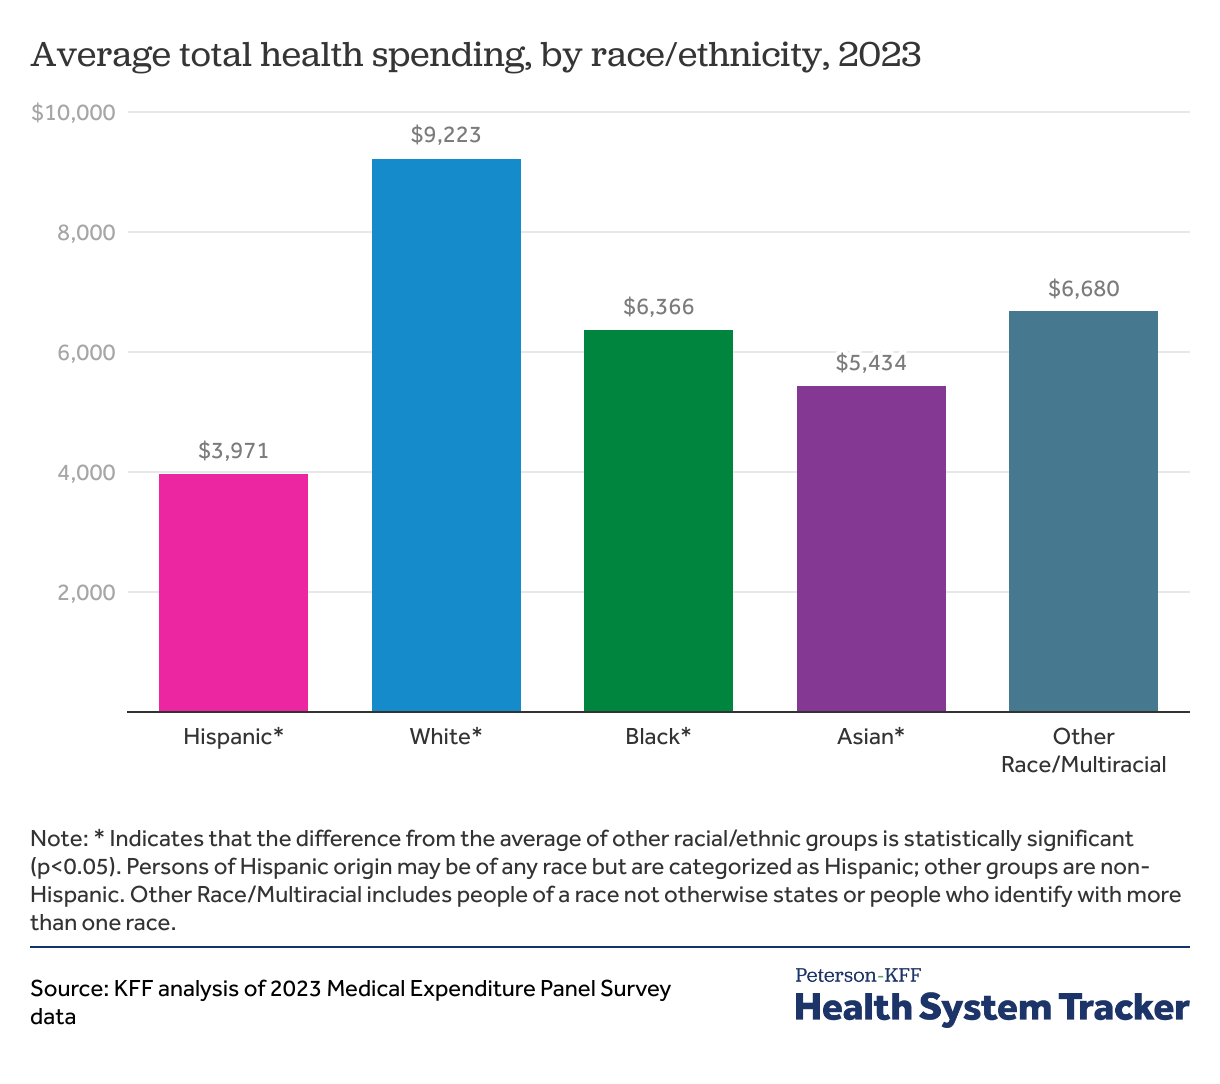
Overall, White people in the U.S. have significantly higher average total health spending than people in other race and ethnic groups. People who identified as either Asian or Hispanic had relatively low average health spending in each adult age category. Differences in health spending by race and ethnicity may be driven by a variety of factors, including health status, insurance coverage status, source of insurance coverage (e.g., public, private), age distribution, and access to care.
People of color are younger, on average, than White people, Hispanic people are more likely to be uninsured, and Hispanic and Black people are more likely to report delaying or going without medical care due to costs.
Private health plans tend to pay higher prices for healthcare than public plans do. About three in four Asian and White people are enrolled in private health plans at some point in a given year, while only about one in two Black and Hispanic people are covered by private plans at some point in a given year.
Immigrants have lower health spending on average than those born in the United States. Hispanic and Asian people make up the largest shares of immigrant populations at about 44% and 27%, respectively.
Methods
This collection of charts is based on the 2023 Medical Expenditure Panel Survey (MEPS) Household Component. MEPS is a nationally representative household survey of the U.S. civilian non-institutionalized population. Estimates account for the MEPS survey design, including the estimation weight, sampling strata, and primary sampling unit. Health spending includes individual out-of-pocket payments and payments made by payers for care provided during the year.
Related Content:
The Peterson Center on Healthcare and KFF are partnering to monitor how well the U.S. healthcare system is performing in terms of quality and cost.