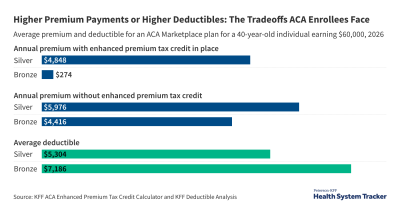
Health plans use cost-sharing (deductibles, copayments, and coinsurance) as incentives for enrollees to use services efficiently and to shop for lower cost options when they do need care. Cost-sharing that is too high, however, can discourage enrollees from getting the care that they need or drive them into financial distress and even bankruptcy. Enrollees in private health insurance plans may have to pay thousands of dollars to meet plan deductibles, coinsurance and copayments. Cost-sharing in private health insurance plans has steadily increased over time. For employer-based coverage in 2021, the average deductibles for single coverage were $2,379 for covered workers at small firms and $1,397 for covered workers in larger firms. Similarly, deductibles in non-group Marketplace plans can be much higher for enrollees not eligible for cost-sharing reductions.
To evaluate whether people can afford to pay cost-sharing amounts common with private insurance plans, we analyzed data from the 2019 Survey of Consumer Finances (SCF). We estimate the share of households with enough savings to meet typical deductibles and out-of-pocket maximums in private health plans. Because cost-sharing requirements are higher in family plans than in single plans, we show results separately for single-person households and households with more than one person. We find that large shares of non-elderly households do not have enough liquid assets to meet typical plan cost-sharing amounts. For example, 45% of single-person non-elderly households could not pay over $2,000 from current liquid assets, and 63% could not pay over $6,000. Lower-income households were much less likely to have the liquid assets to meet typical cost sharing.
How much do households have in assets?
The Survey of Consumer Finances provides a snapshot of household finances, including detailed information on debts, assets, income, and the types of health insurance present in the household. Many households have mixed insurance coverages, with members enrolled in different types of plans. This analysis focuses on non-elderly households, regardless of the types of coverages present. Based on an earlier KFF analysis, we developed two measures of household resources: liquid financial assets and net financial assets. Generally, liquid financial assets are higher than net financial assets (which also reflect debt) and therefore for simplicity, we present liquid financial assets and report net financial assets in the Appendix.
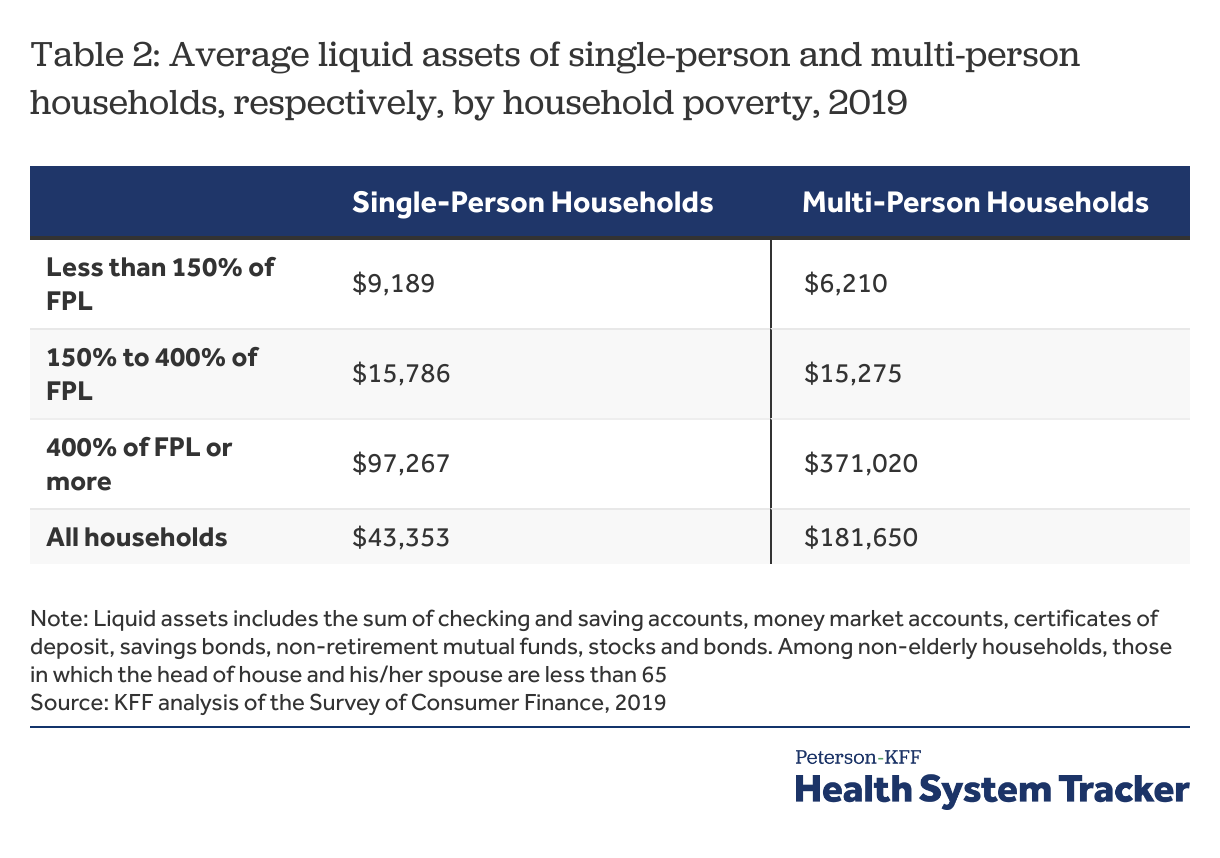
Liquid financial assets are those that are most easily converted to cash, including checking and saving accounts, money market accounts, certificates of deposit, savings bonds, non-retirement mutual funds, stocks and bonds. It excludes the value of dedicated retirement accounts (such as 401k accounts) and the cash value of life insurance. We think of this as the money that a household could bring to bear in a short period.
Most households’ savings are less than the maximum out-of-pocket limit allowed for most private plans
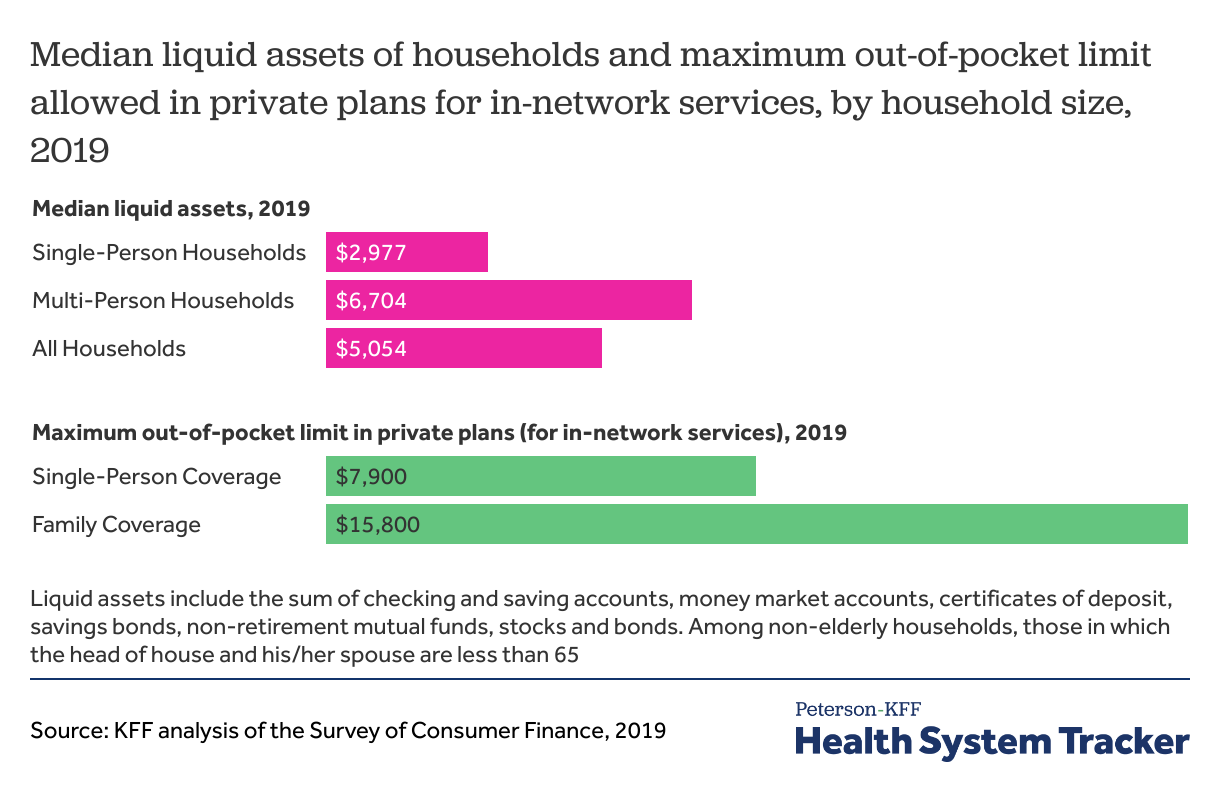
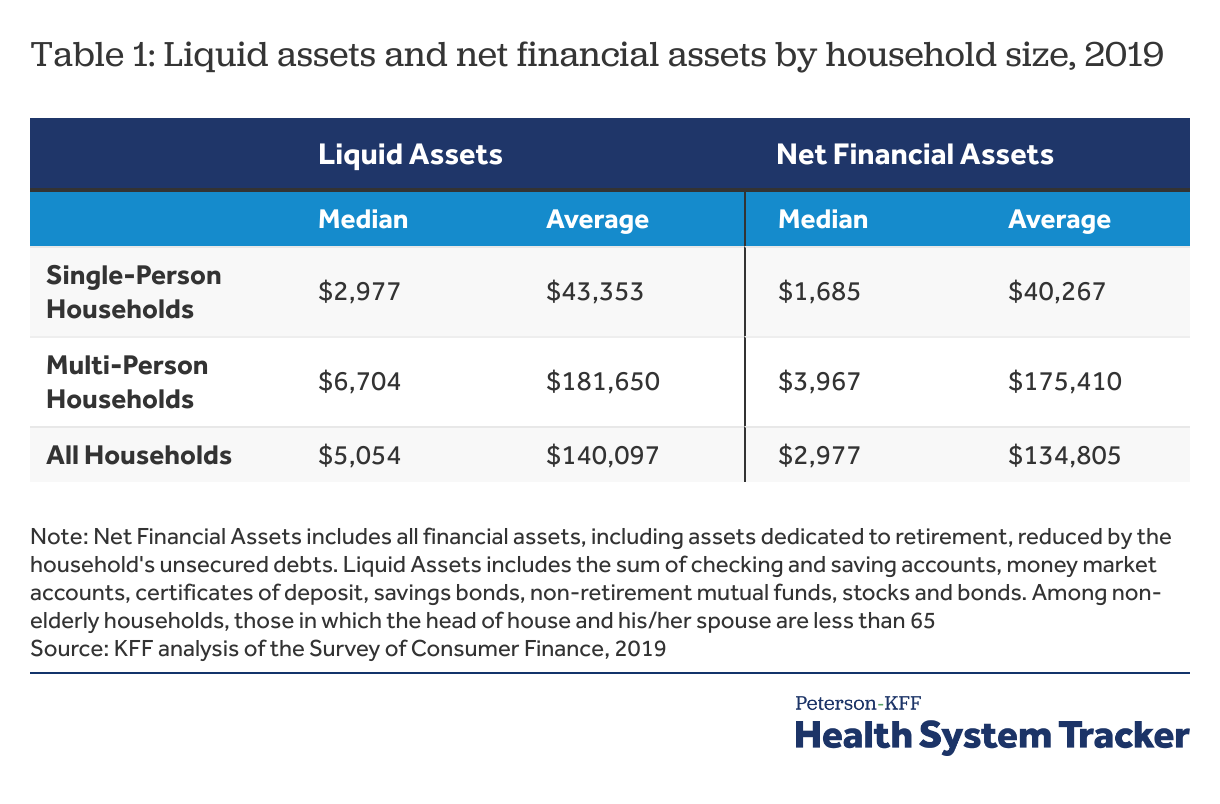
Among non-elderly households in 2019, median liquid assets were $2,977 for single-person non-elderly households and $6,704 for households with more than one person. That means that half of non-elderly people living on their own could contribute $2,977 or less from their liquid assets to cost-sharing and half of multi-person households could contribute $6,704 or less.
Related Content:
Lower-income households have less savings than the typical deductibles seen in employer-plans
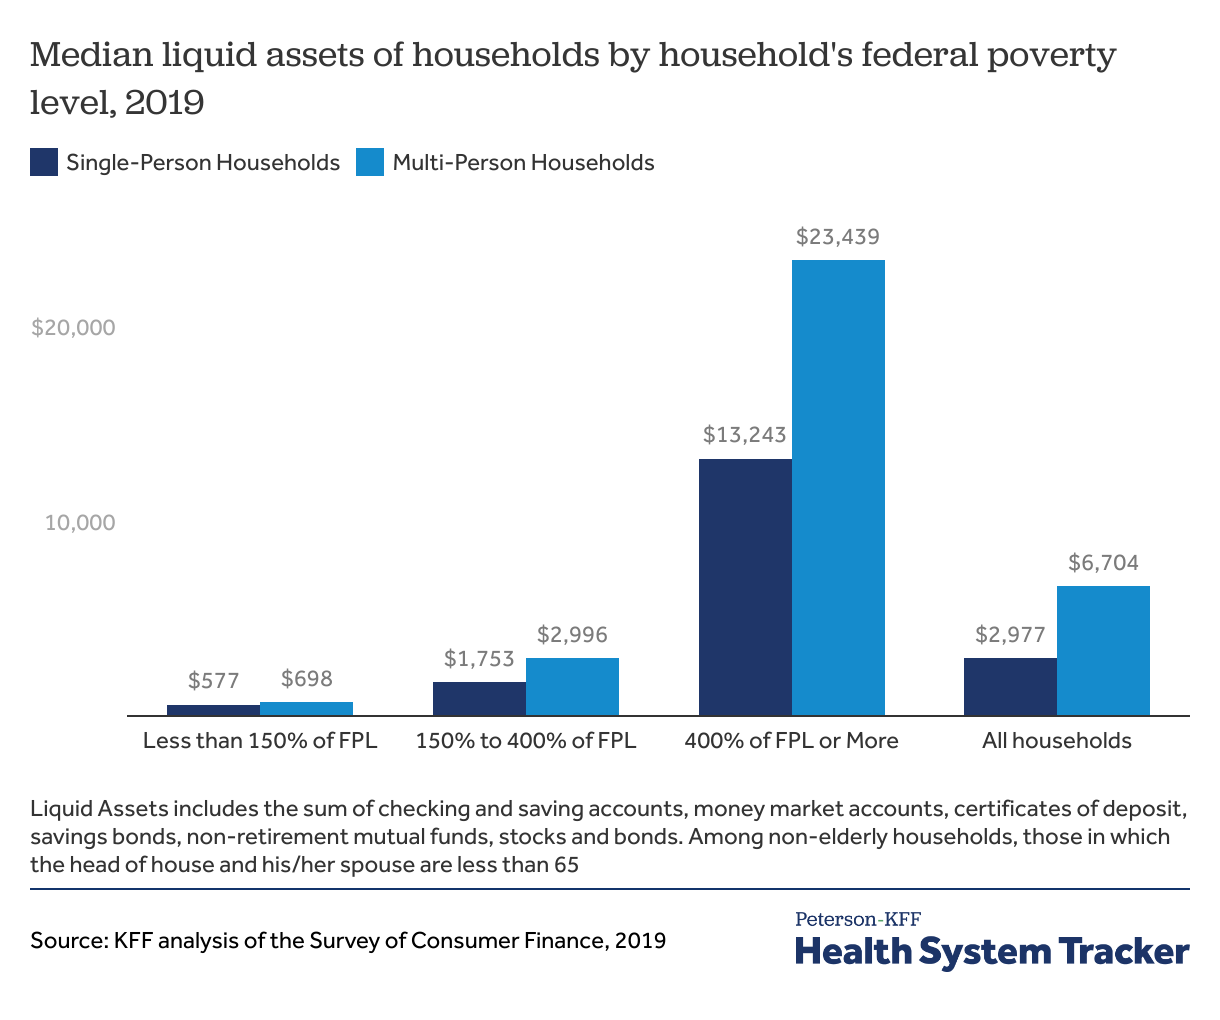
Median assets vary tremendously with household income. Median liquid assets for single-person non-elderly households with incomes below 150% of poverty were $577, compared to $1,753 for those between 150% and 400% of poverty, and $13,243 for those above 400% of poverty. Median liquid assets among multi-person households were $698 in households below 150% of poverty compared to $2,996 for households between 150% and 400% of poverty, and $23,439 for households with incomes of 400% of poverty or more. For reference, a four-person household earning $103,000 would have an income at 400% of the federal poverty level in 2019.
How many households can afford typical cost-sharing amounts?
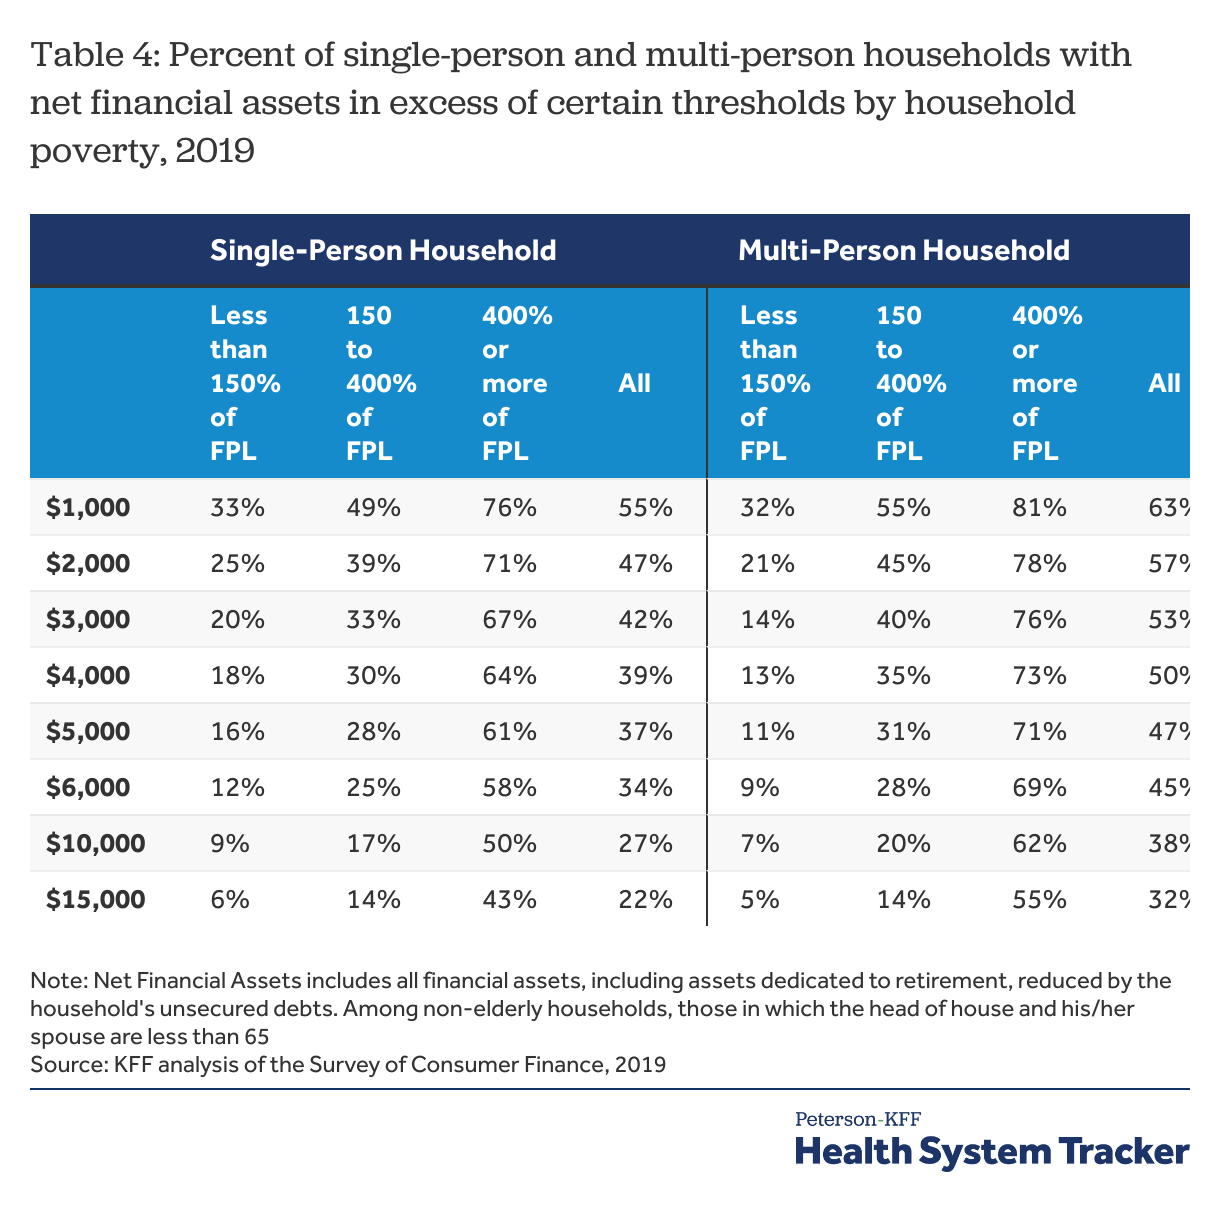
Another way to think about household assets is to look at the percent of households with enough liquid assets to meet different cost-sharing amounts. We focus on two thresholds of savings. The first threshold of $2,000 for single-person households (or $4,000 for multi-person households) represents the mid-range of typical deductibles for employer-based plans. The second threshold of $6,000 for single person households (or $12,000 for multi-person households) is in line with higher deductibles. About 1 in 5 workers in self-only employer-sponsored plans had an out-of-pocket maximum above $6,000, the threshold we use in this analysis.
Many households do not have enough assets to pay typical health plan deductibles and most cannot afford to meet high deductibles
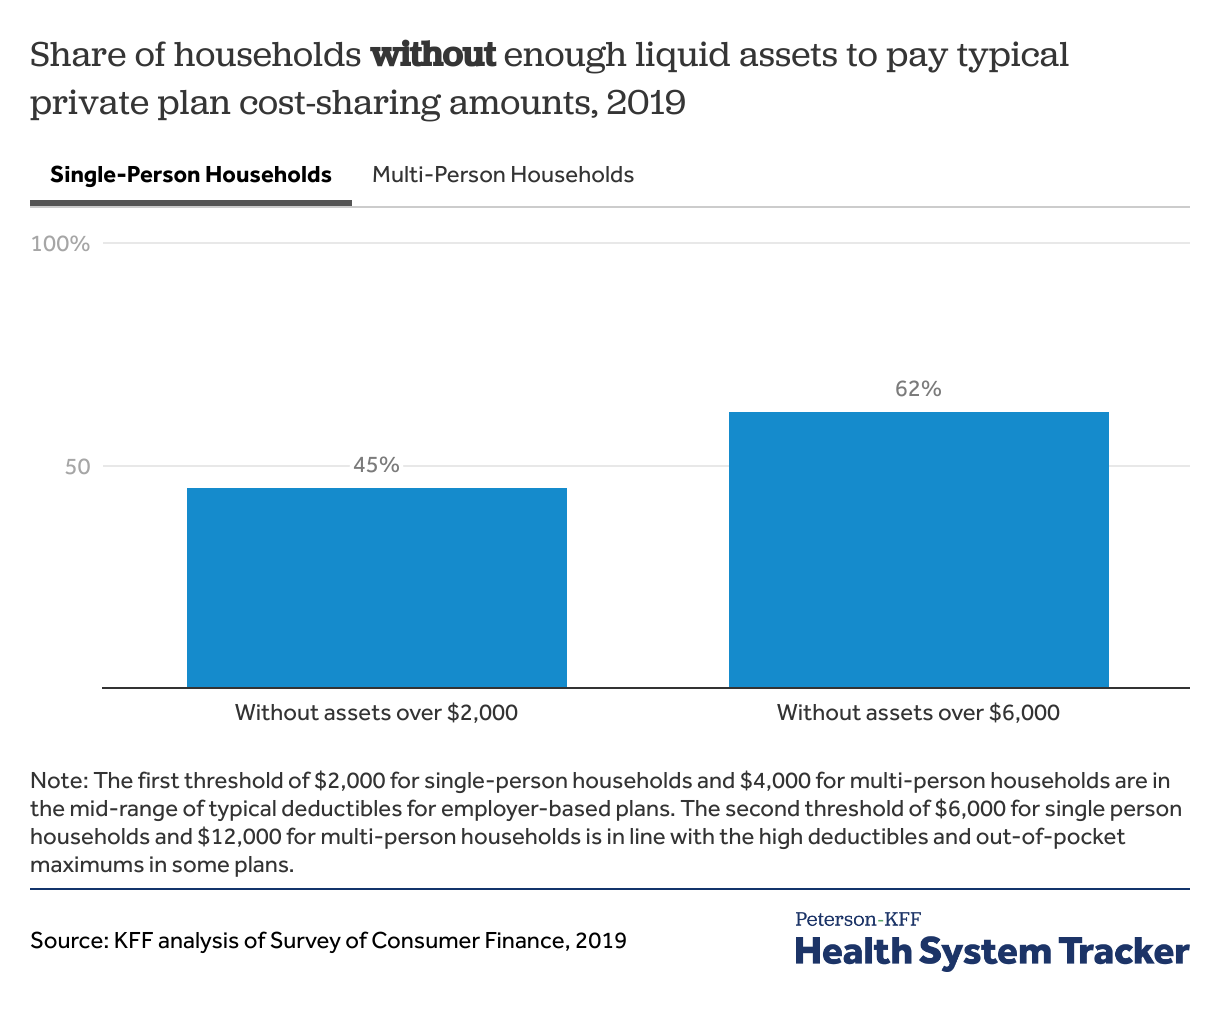
About half of households could not afford a typical employer plan deductible and almost two in three households do not have enough resources to cover a higher-end deductible of private health plans. 45% of single-person non-elderly households could not pay $2,000 from their liquid assets (the typical employer plan single deductible), and 62% could not pay $6,000 (a very high single deductible). Among multi-person households, 42% could not pay $4,000 from their liquid assets (the typical employer plan family deductible), and 61% could pay $12,000 (a very high family deductible).
Most households do not have enough savings to meet a typical out-of-pocket limit allowed in private plans
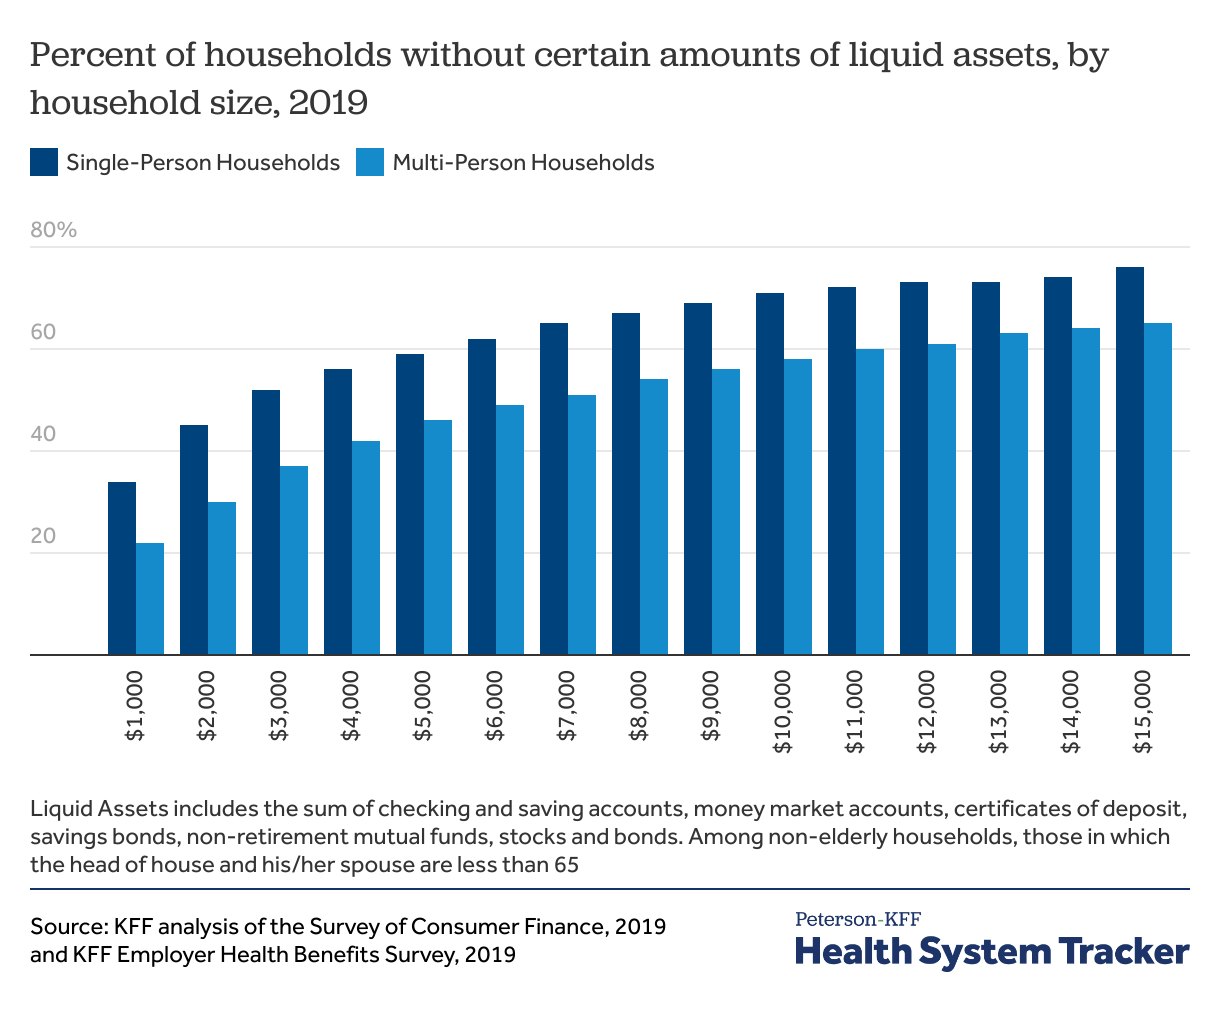
The Affordable Care Act limits out-of-pocket maximums in most private health plans ($8,700 for single coverage and $17,400 for family coverage in 2022), but many plans set lower out-of-pocket maximums. The average out-of-pocket maximum for single coverage was $4,272 in 2021.
Most households do not have enough liquid assets to meet the typical out-of-pocket maximum. In a given year, most people are relatively healthy and would not need to pay these expenses, but a serious illness or accident could potentially expose people to high costs.
How does affordability of cost-sharing vary by income?
Lower-income people are less able to afford costly medical care. Among non-elderly people living on their own with incomes below 150% of poverty, 72% could not pay $2,000 from their liquid assets for cost sharing, compared with 54% of those between 150% and 400% of poverty and only 16% of those above 400% of poverty or more.
Low-wage individuals may have reduced cost-sharing if they are covered through Medicaid or a Marketplace plan, but many are ineligible for these programs. Low-wage workers enrolled in employer plans may struggle to meet plan cost-sharing requirements. Approximately 84% of multi-person households with incomes below 150% of the FPL do not have $4,000 in liquid assets, in addition to 16% of households with incomes above 400% of the FPL and 57% of households in between. While households with higher incomes are more likely to have savings, many still do not have enough to meet typical cost-sharing level, evidenced by the fact that approximately one-in-six multi-person households earning above 400% of poverty have less than $4,000 in liquid assets.
Few lower-income individuals have the assets to meet deductibles typical in employer plans
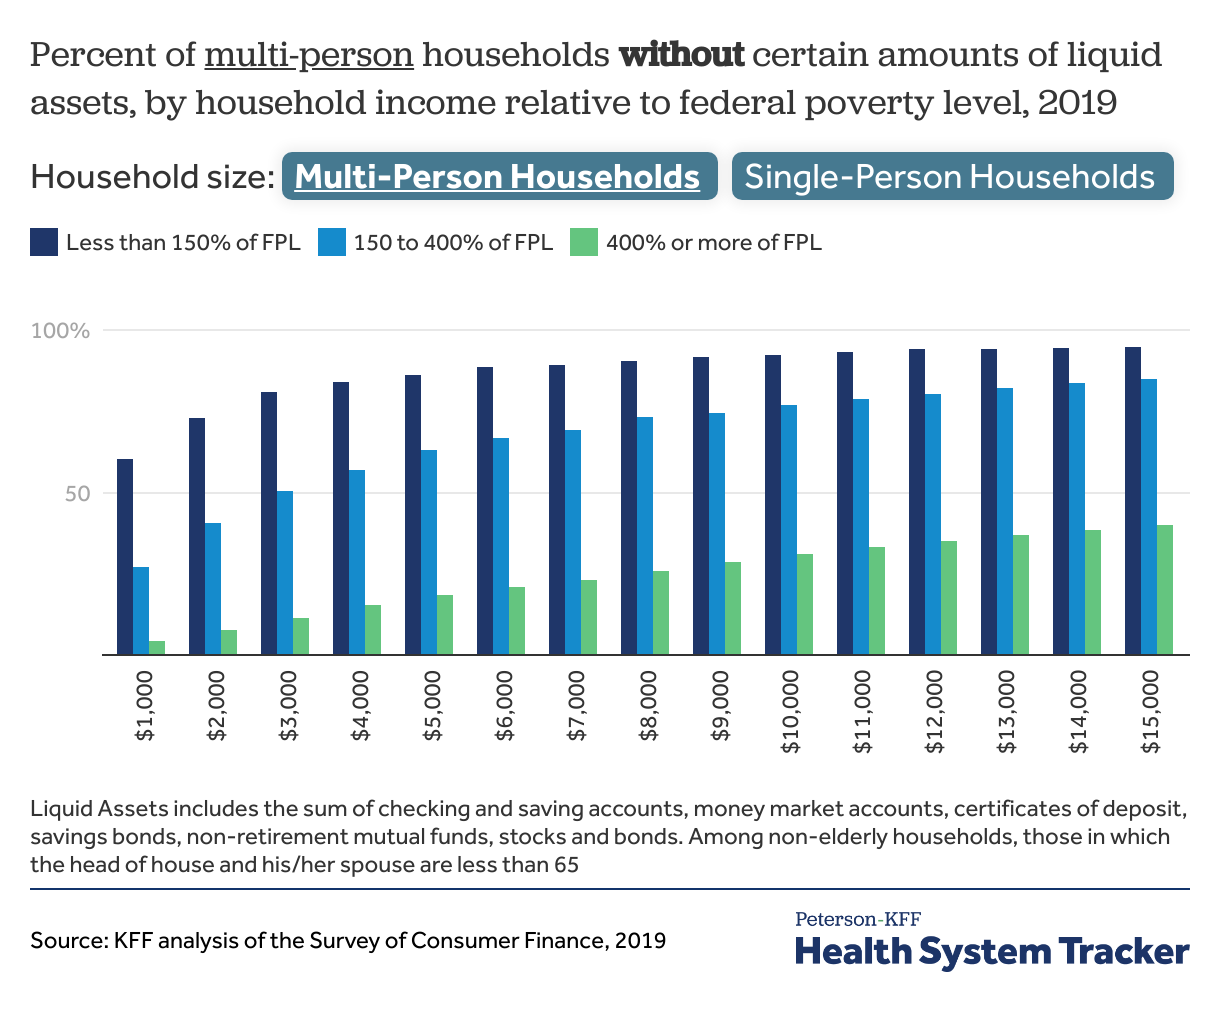
Only 6% of multi-person non-elderly households with incomes below 150% of poverty, 20% with incomes between 150% and 400% of poverty, and 65% with incomes of 400% of poverty or more could pay $12,000 from liquid assets. People with incomes under 138% of poverty are eligible for Medicaid (which typically has little to no cost sharing) if their state expanded the program under the Affordable Care Act.
Affordability also varies based on insurance status and coverage type. Households with someone who is uninsured have particularly low levels of assets. Among single-person non-elderly households without insurance, only 37% could cover a $2,000 expense from liquid assets, and just 18% could pay $6,000. Among multi-person households with at least one uninsured member, 70% could not pay $4,000 from liquid assets and 86% could not pay $12,000.
Nearly a third of households do not have enough savings to pay typical deductibles in employer-based coverage
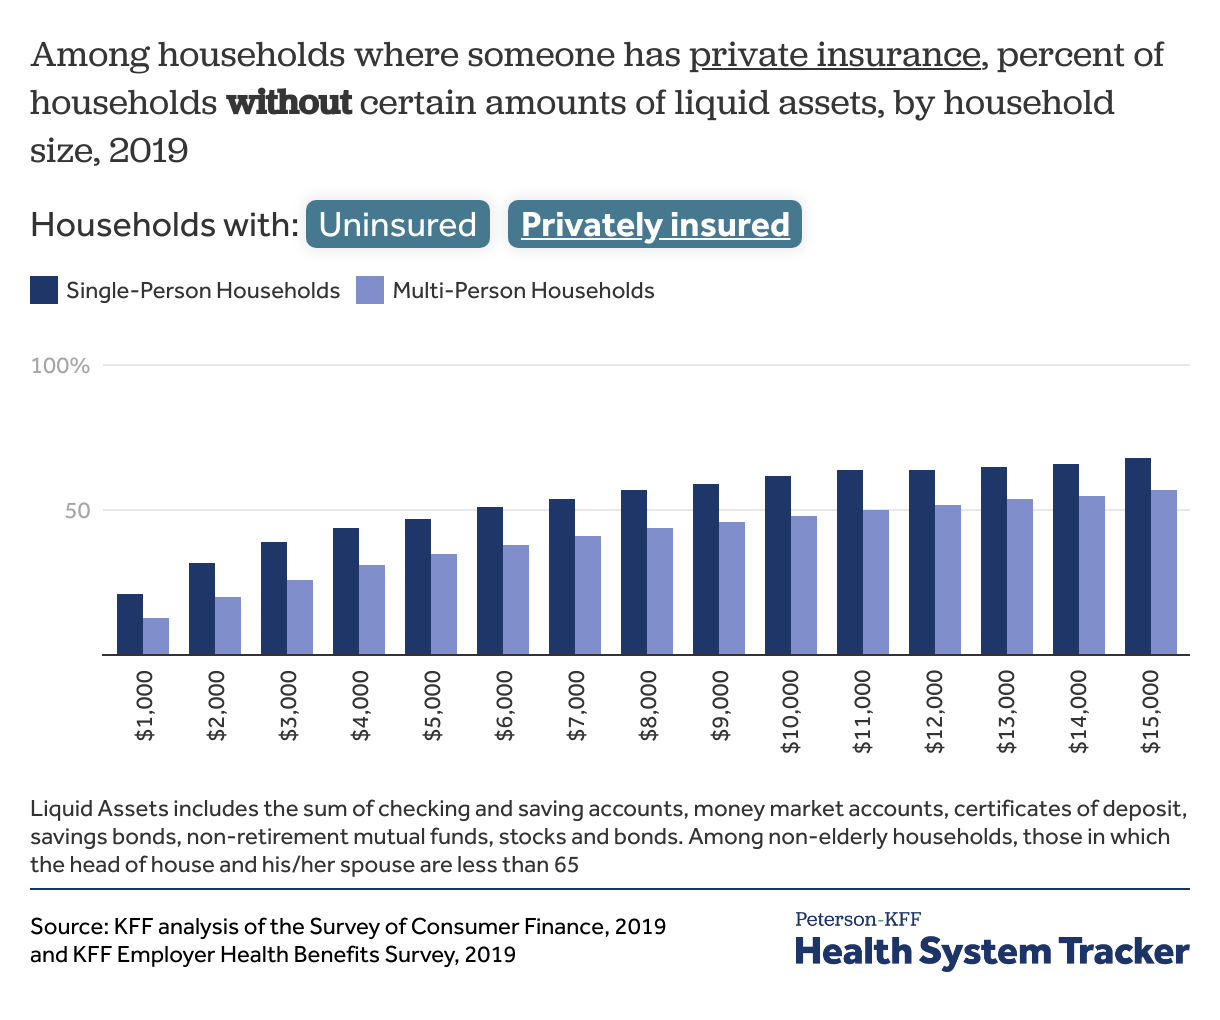
Generally, households where someone has private insurance have higher assets however, a significant share still do not have resources to meet typical cost-sharing expenses. For example, about a third (32%) of single-person households with private insurance in 2019 could not pay a $2,000 bill, and half (51%) could not pay a $6,000 bill. Among multi-person non-elderly households in which at least one person is covered by a private insurance plan, 31% do not have more than $4,000 in liquid assets. This indicates that nearly a third of these households could not pay cost-sharing amounts beyond these amounts with their liquid assets.
How do families cover emergency expenses?
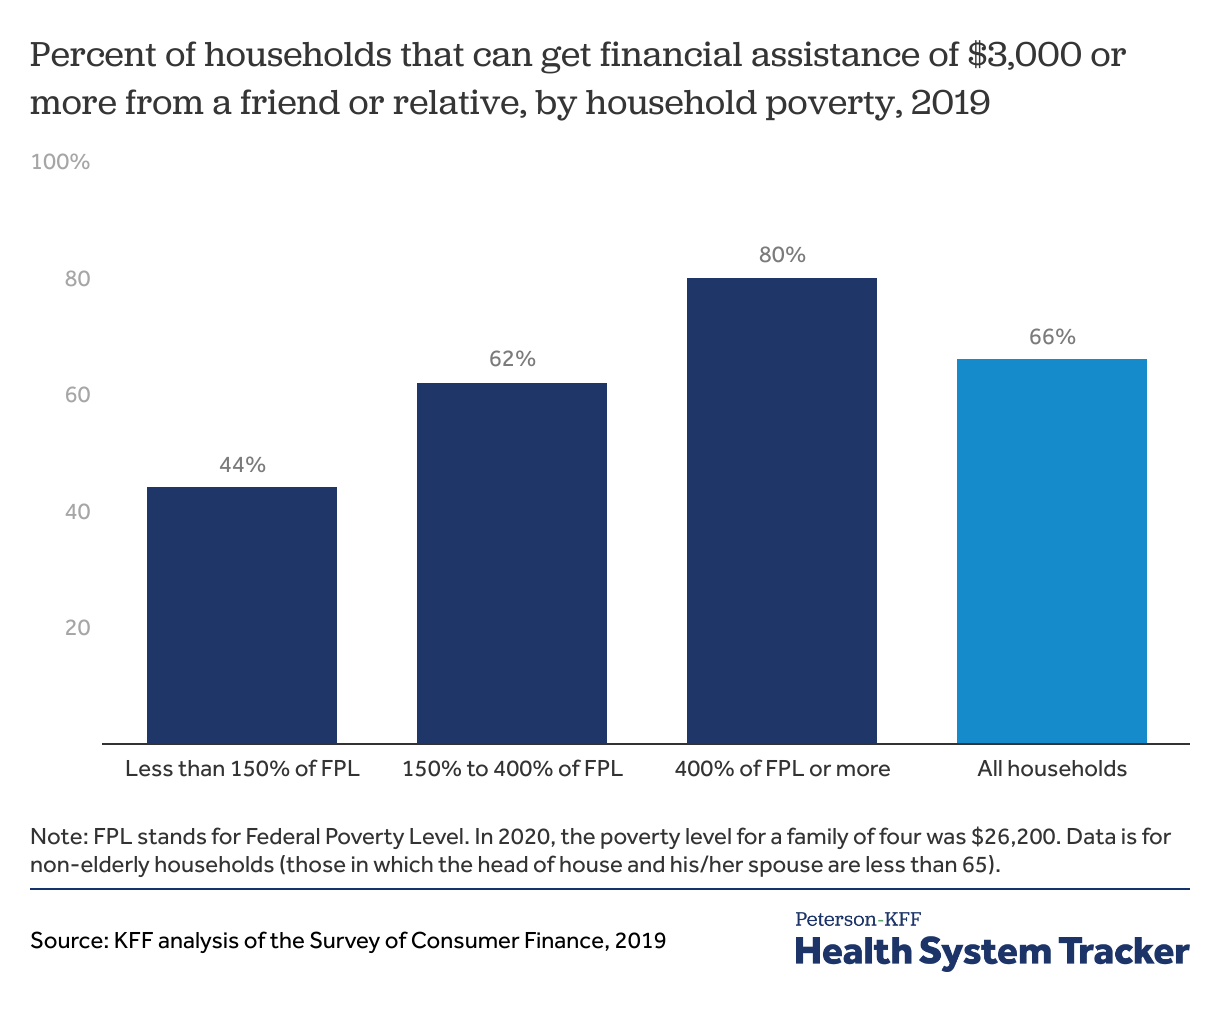
When faced with high medical bills, people may turn to friends and relatives for help. Approximately two-thirds of non-elderly households indicated that, in an emergency, they could obtain $3,000 of financial assistance from friends or relatives. Households with higher incomes are more likely to say this is possible – 80% of households with incomes over 400% of the FPL say they could rely on personal networks to obtain $3,000, compared with 62% of households with incomes between 150% and 400% of the poverty level.
A third of households do not think they could borrow $3,000 from friends or relatives in case of an emergency
KFF’s previous analysis on the subject found that even relatively small medical expenses can lead to persistent debt. The Survey of Household Economics and Decisionmaking (SHED) is an annual survey conducted by the Federal Reserve that asks individuals about their income and how they think about household finances. The 2020 SHED asked respondents how they would cover an emergency expense of $400. A significant share of non-elderly adults enrolled in an employer or non-group health plan indicated that they would not be able to meet this amount from their current savings, including 16% who indicated they would put a $400 emergency expense on their credit card and pay it off over time, 2% who reported that they would take a bank loan and 6% said they would be unable to meet the expenses.
Many people would need to borrow to cover a $400 emergency expense

KFF previously collaborated with the Los Angeles Times to field a national survey concerning the experiences of adults with employer-sponsored health insurance. A significant share of respondents reported affordability challenges, including four in ten (40%) who said that their family had problems paying for medical bills or affording premiums. These challenges were more pronounced among lower-income households. Sixty-five percent of people in households earning less than $40,000, and 51% of people in households with incomes between $40,000 and $75,000, indicated that they found it difficult to afford premiums or care, despite employer-sponsored coverage.
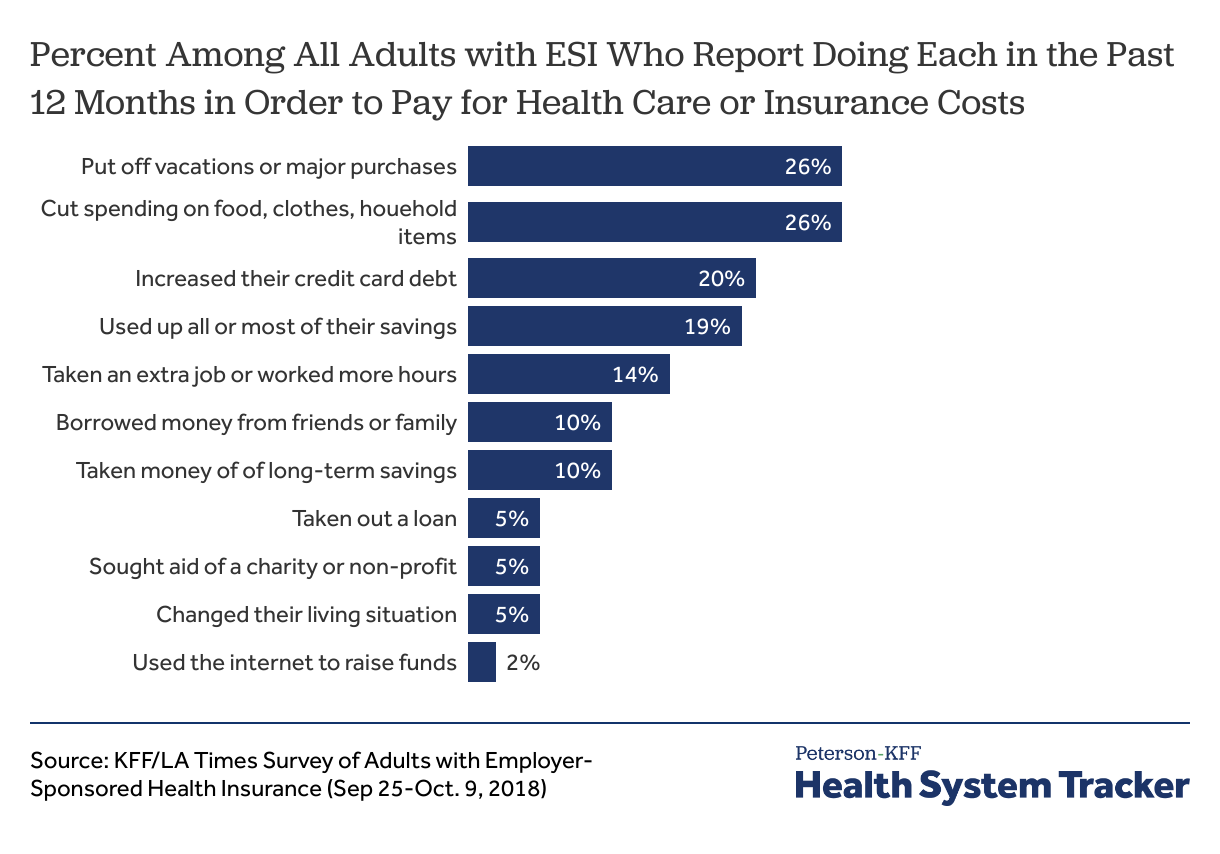
Over half of survey respondents (51%) on an employer plan reported that someone in their household skipped or postponed care or filling a prescription in the past year because of the expense, and 17% said they have had to make difficult sacrifices to pay health costs. During the last year, 26% of adults on an employer plan reported cutting spending on food, clothing, and household items to pay for health-related expenses, and 20% said that they took on additional credit card debt.
Many people with employer coverage report making sacrifices to cover health expenses
Discussion
By shifting a portion of health cost onto people using services, health plan cost-sharing reduces the expense paid by the insurer, thereby potentially lowering the premium. More importantly, requiring consumers to contribute encourages them to carefully consider which services they will use, and, depending on how the cost-sharing is structured, may encourage the use of lower-cost care. While cost-sharing may reduce premiums, evidence suggests it also might discourage people from seeking needed and beneficial care.
As cost-sharing levels have increased, so has concern about cost-related access barriers among people with private coverage. While low-income people enrolled in Medicaid or the Marketplaces face little or no cost-sharing, employer plans generally do not vary cost-sharing based on income. In 2020, just 7% of firms with 50 or more workers had programs to help lower-wage workers meet cost-sharing obligations.
Much of the discussion around affordability of private coverage has centered on premium costs. A broader notion of affordability would focus on the ability of families, particularly low- and middle-income families, to meet potentially high out-of-pocket expenses associated with a chronic or acute illness. In addition to high cost sharing deterring needed health care, it can also create financial instability. In the U.S., nearly 1 in 10 adults owe medical debt.
Methods
The 2019 Survey of Consumer Finances (SCF) is a triennial, nationally representative household survey conducted by the Federal Reserve Board. The survey has a dual frame, with respondents selected from both a national area probability design and a sample of households with high-income tax returns. The poverty levels are defined as $12,490 for a single-person household and $4,420 for every additional person in the household, and are based on the 2019 Poverty Guidelines as defined by the Department of Health and Human Services. The 2019 SCF is based on about 4,100 non-elderly households. Weights were applied to ensure that percentages were representative of the population.
The SCF defines a family as a “primary economic unit (PEU),” or all the individuals living in a household who are financially interdependent with the dominant individual or couple. Income and assets are measured for the PEU in the household. The definitions of the different types of assets and debts are available here. In this analysis, we first look at the median levels of assets of non-elderly households. We look at median assets because the averages are significantly affected by a small number of households with high levels of assets
The SCF provides information about the types of insurance present in each household, and about whether each member had coverage or not. Unlike financial characteristics, insurance questions are asked of all members of a household, including members that are not part of the PEU, which could be a relative who is financially independent or a financially independent non-relative living in the household. This creates some potential ambiguity when we look at households in which someone has private coverage because it is possible that the only people with private coverage are not part of the PEU. Because we have information, about whether or not each person in the household has some coverage or not, we were better able to target the members of the PEU in identifying households where someone was uninsured. We selected only households where the financially dominant individual, his or her spouse or partner, or his or her financially dependent children (regardless of the child’s age) were uninsured. Many households have multiple forms of coverage.
The Survey of Household Economics and Decisionmaking (SHED) is an annual survey of adults conducted by the Federal Reserve Board. The survey is based on the Ipsos KnowledgePanel, a nationally representative probability-based online panel. Ipsos selected respondents for KnowledgePanel based on address-based sampling (ABS). The questions asked of the panel are intended to gather information from the individual about how they make household economic decisions. The SHED survey finishes data collection in October and then releases the report and public use file in May of the following year.
Appendix
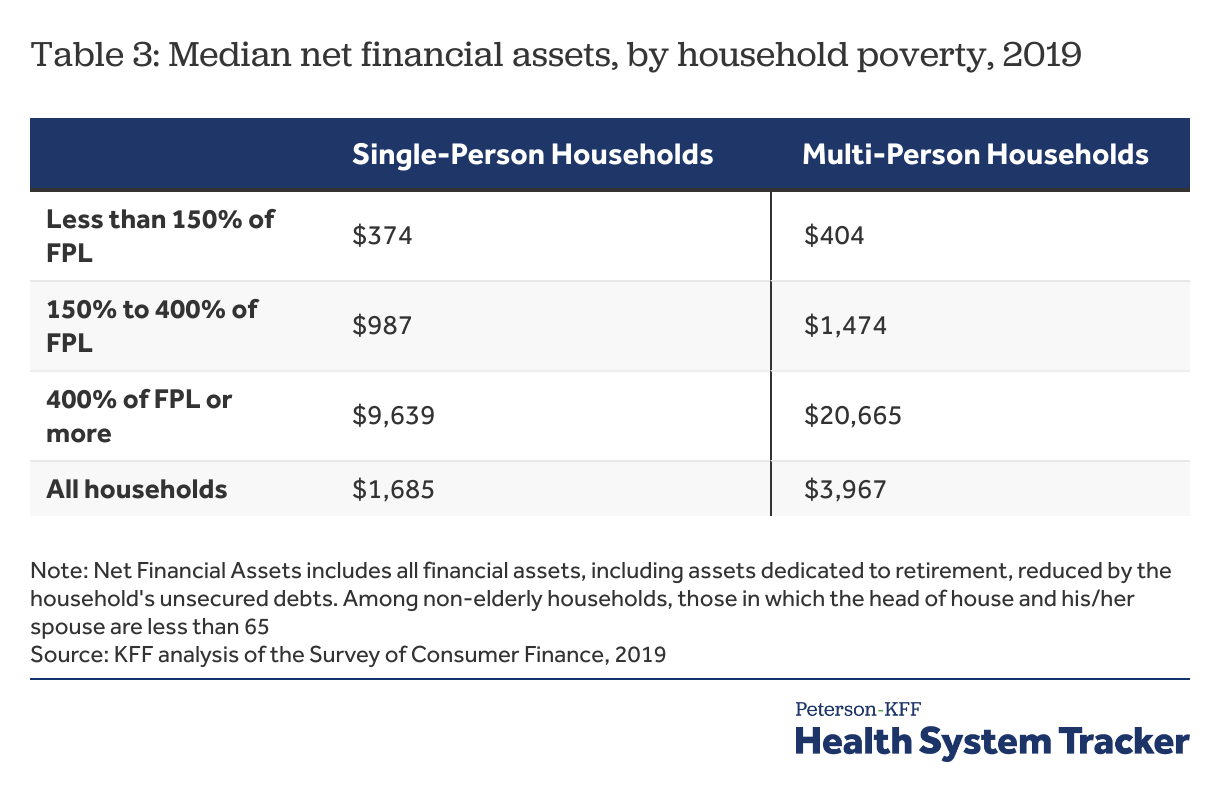
The Survey of Consumer Finances provides a snapshot of household finances, including detailed information on households’ debts, assets, income and the types of health insurance present in the household. Based on an earlier KFF analysis, we developed two measures of household resources: liquid financial assets and net financial assets. Both measures are conservative, since they assume a household can use all of their savings to pay one year’s cost-sharing total. This would leave a household with no additional assets to meet other non-health emergencies or health expenses in the following year. Generally, liquid financial assets are higher than net financial assets (which also reflect debt) and therefore, for simplicity, we presented the analysis using liquid financial assets, and included information on net financial assets in this appendix.
Net financial assets, is a broader measure of the household’s total resources. This category includes all financial assets (including assets dedicated to retirement) reduced by the household’s unsecured debts. For this measure, the value of assets is reduced by credit-card debt and other unsecured loans, but debts secured by real property (such as mortgage debt) and loans for vehicles and education are not counted against assets. This category measures how much money a household has available to pay medical expenses after meeting some debt obligations, although the money may not be easily accessible in all cases.
The Peterson Center on Healthcare and KFF are partnering to monitor how well the U.S. healthcare system is performing in terms of quality and cost.