In this brief and the accompanying Health System Dashboard, we look across over a hundred data points to assess the performance of the health system in the United States. This year, the coronavirus pandemic has upended lives and economies and fundamentally challenged health systems across the globe. At the time of this publication, the U.S. leads in the total number of cases and deaths due to COVID-19 and has a higher per capita death rate than many similarly wealthy countries (Organisation for Economic Co-operation and Development (OECD) nations with above median gross domestic product (GDP) and median GDP per capita).
COVID-19 is now the third leading cause of death in the U.S., but that is not the case in many similarly wealthy countries. Before the pandemic, mortality and disease burden rates were already worse in the U.S. than in peer countries. Because the U.S. has one of the highest rates of all-cause excess mortality in 2020 among this group of similar countries, the COVID-19 pandemic will likely widen the gap in health outcomes between the U.S. and its peers. Further, communities of color in the U.S. face a disproportionate impact from COVID-19. Black, Hispanic, and Native Americans have the highest rates of death from COVID-19, indicating the pandemic will also worsen health disparities.
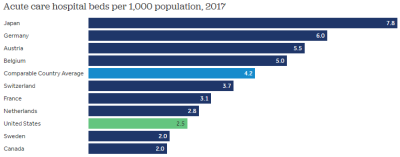
The unmitigated spread of COVID-19 has further exposed gaps in the U.S. health system. A surge in cases has strained hospital capacity in hotspot regions throughout the U.S. To better allocate healthcare resources and attempt to contain community spread of the virus, routine or non-essential health services were generally cancelled or postponed early in the pandemic. These changes contributed to historic declines in health services revenue and employment. Before the pandemic, the U.S. already lagged behind peer countries across a number of measures of health system resources, including in the number of hospitals, acute care beds, and hospital healthcare workers.
With plunging demand for non-COVID care in the spring of 2020, health service providers experienced historic declines in revenue in the U.S. At its low point in April, annualized spending on health services had fallen by 32%. Total health services revenue began to rebound in the summer and fall compared to earlier in the pandemic, driven mostly by resumed hospitalizations and increased COVID-19 testing at laboratories. Year-to-date spending on health services is down by about 2% in 2020 relative to the same time in 2019. Adding in prescription drug revenue, which has increased in 2020 over last year, total health spending is down by about 0.5% on an annualized basis, as of October. Meanwhile, the U.S. GDP has fallen by 1.8% as of the third quarter, suggesting that, despite falling as well, health spending may represent a somewhat larger share of the economy in 2020 than it did in 2019.
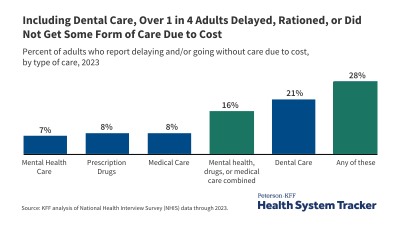
The decline in health spending reflects forgone and delayed medical care, which could have long-term implications for health outcomes and costs. Rates of cancer screenings abruptly dropped early on in the pandemic, and office visits for newly diagnosed cancer patients have not returned to baseline levels thus far. In November 2020, about one in four people (24%) reported that, due to the pandemic, they did not get needed medical care for something unrelated to the coronavirus.
Related Content:
Time will tell how the COVID-19 pandemic has affected costs, quality, and outcomes in the U.S. health system. Most of the data we track to assess the functioning of the health system lag by one to two years, and we still do not have a complete understanding of how the post-pandemic economy has affected the uninsured rate (though it appears to have not changed much). Based on data available through 2019 or earlier years, the following findings highlight recent trends across 10 key indicators of health system performance and outline potential effects of the pandemic and economic downturn. Where possible, we compare trends in the U.S. and similarly wealthy countries. Visit the Health System Dashboard for more in-depth exploration of these and other telling analyses.
HEALTH OUTCOMES
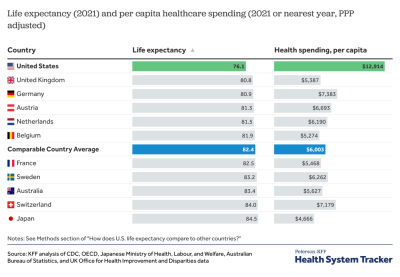
1. COVID-19 reached the third leading cause of death in the U.S. in 2020, and will almost surely shorten life expectancy in the U.S. and in other hard-hit countries. Life expectancy in the U.S. had increased by 5 years over the past 4 decades, although there have been declines in recent years driven by increased mortality rates from certain causes including drug overdoses and suicides. On average, people in comparable countries have a life expectancy of 82.4 years – nearly four years longer than the U.S. life expectancy of 78.7 years – and the gap could grow. As our earlier analysis found, the pandemic has caused a widening gap in mortality rates between the U.S. and its peers. The pandemic has also exacerbated racial inequalities in health outcomes. Black, Hispanic, and Native American and Native Alaskan populations in the U.S. are roughly 5 times as likely as White people to be hospitalized due to COVID-19. They are also more likely to die from COVID-19 compared to White people.
2. Disease burden, a measure that accounts for both longevity and quality of life, had generally improved over the past quarter century, with particular improvement for circulatory diseases. However, in the past few years, disease burden has worsened in the U.S. (driven by substance use disorders and an uptick in injuries) while continuing to improve in similar countries. Although disease burden is likely to increase in all countries due to the pandemic, length of life may decrease more in the U.S. than in peer countries. Not only has the U.S. had higher excess deaths and cases from the coronavirus, it also has more excess deaths among younger people than peer countries. Premature deaths were already higher in the U.S. compared to peer countries, and the pandemic will likely increase this disparity. Additionally, the U.S. has relatively high rates of disease burden attributable to some of the health conditions that put people at high risk of serious illness from COVID-19: cardiovascular diseases, chronic respiratory diseases, and diabetes. The pandemic has also raised concerns about long-term mental health outcomes, as an unprecedented share of U.S. adults (43% as of November 2020) have reported experiencing symptoms of anxiety and/or depression since the crisis began. Prior to the pandemic, disease burden due to mental health and substance use disorders combined (4,374 DALYs per 100,000) already well surpassed disease burden due to any other health condition.
HEALTH SPENDING
3. The pandemic led to a historic decline in health spending. As of October 2020, spending on health services and prescription drugs was down 0.5% from 2019, on an annualized basis. Any drop in health spending is historic, but health costs remain high. Per person health spending was $11,172 in 2018, about double that of peer countries. This spending differential is primarily because of higher prices for healthcare in the U.S., as utilization is similar – and in some cases lower – in the U.S. For the last decade, however, per capita spending in the U.S. has grown at an average rate of 3.6% per year, which is similar to that of comparable countries.
4. With GDP declining by 1.8% as of the third quarter of 2020 (on an annualized basis) and spending on health services and prescription drugs spending falling about 0.5% as of October 2020 (also on an annualized basis), it appears that health spending may represent a somewhat larger share of the economy in 2020 than it did in 2019. Health spending has historically grown faster than the economy, but the difference has moderated in recent years. The U.S. health consumption expenditures accounted for 18% of GDP in 2018 – much more than comparable countries, where health spending averages 10% of GDP.
ACCESS & AFFORDABILITY
5. The pandemic has caused tremendous healthcare access problems in the U.S. In November 2020, 24% of adults reported that because of the pandemic, they did not get needed medical care for something other than coronavirus. Telemedicine use has substantially increased and offset some of the drop in in-person care, but not enough to return to normal levels of care.
6. Pandemic-related job losses threaten to increase the number of people uninsured in the U.S., as people may lose or have lost their job-based health coverage. However, reliable data on the uninsured rate in 2020 is not yet available. Early data do not indicate large drops in employer coverage as of mid-year, suggesting many employers may have kept furloughed workers covered, at least temporarily. Prior to the pandemic, health coverage rates increased in the U.S. under the Affordable Care Act. The uninsured rate among the non-elderly adults was 10.9% in the U.S. in 2019. The U.S. coverage rate is still the lowest among comparable countries, all of which have universal coverage.
7. Before the pandemic, there had been improvements in the share of Americans reporting problems paying medical bills. From 2011 to 2018, the share of people reporting difficulty paying medical bills dropped by more than a quarter. Still, in 2019, 15% of non-elderly adults reported having difficulty paying medical bills, and over half of adults worried about their ability to pay medical bills if they were to get sick or have an accident. Legislation early in the pandemic made COVID-19 testing free at the point of service, and many insurers have waived cost sharing for COVID-19 treatment. However, medical bills remain a top concern for many Americans, and this could worsen with the pandemic given the strain in financial security as many individuals contend with job or income loss.
QUALITY OF CARE
8. In December 2020, U.S. federal officials warned states that patient care might suffer as hospitalizations continue surging and health care staffing capacity reaches its limits across the U.S. As health care resources are strained to meet surging COVID-19 pandemic demand, quality of care might suffer. Other comparable countries might also have worsened quality of care due to the pandemic. Prior to the pandemic, the U.S. had the highest rate of medical errors.
9. The occurrence of hospital-acquired conditions (e.g., surgical infections or medication errors) has improved, declining 13% from 2014 to 2017. It is not clear if the pandemic will impact the rate of hospital-acquired conditions. With strained hospital resources, hospital-acquired conditions could also deteriorate. Additionally, the pandemic poses a coronavirus infection risk for patients and staff in the hospital itself.
10. The increase in delayed or forgone care during 2020 is likely to worsen treatable and preventable death rates in the U.S. and comparable countries. In 2017, the U.S. had the highest rate of treatable deaths (those that could have been avoided through timely and effective care) and preventable deaths (those that could have be avoided through primary prevention) among peer countries. Compared to the average of comparable countries, potentially preventable hospital admissions rates are higher in the U.S. for several diseases that could possibly be prevented or treated in a non-emergency setting, including for congestive heart failure (88% higher), asthma (8% higher), and diabetes (53% higher). Hypertension is an exception, as U.S. admission rates are 12% lower than the comparable country average.
DISPARITIES IN HEALTH SYSTEM PERFORMANCE
Health disparities in the U.S. are likely to worsen due to the pandemic. COVID-19 related hospitalizations and mortality have disproportionately impacted Black, Native American and Alaska Native, Hispanic, and low-income people in the U.S. Although the U.S. health system’s performance has generally improved over time across many indicators, many disparities have persisted across racial or ethnic groups and by gender, age, health status, and income level. In 2017, life expectancy for Black Americans was 3.7 years shorter than the average across all races in the U.S. Black Americans tend to have higher cardiovascular disease death rates than White Americans. Black women tend to experience higher rates of cesarean sections for low-risk births than other groups.
Poorer outcomes are affected by interactions – or lack thereof – with the health system, along with other social determinants of health. Data on access to care further highlight disparities across racial and ethnic groups. Hispanic populations have almost twice higher uninsured rates than other populations in the U.S. In 2019, 21% of Black non-elderly adults had difficulty paying medical bills compared to 15% of all non-elderly adults, and 63% Hispanic individuals worried about their ability to pay medical bills compared to 51% of all non-elderly adults.
CONCLUSION
The pandemic has abruptly shifted trends in health outcomes, spending, and access to healthcare. Although it will take years to analyze the pandemic’s effect on the U.S. health system, early data show an unprecedented downward effect on health spending in 2020 and further widening of the gap in health outcomes between the U.S. and its peers. COVID-19 will likely have both a direct and indirect effect on health outcomes and costs due to postponed or delayed care. The pandemic is highlighting the gaps in the U.S. health system, providing an opportunity to assess and redress the U.S. health system performance and resilience.
Visit the Health System Dashboard to explore more data on these trends and additional indicators of health system performance.
Methods
Where possible, we compare the U.S. to other similarly large and wealthy countries as measured by median GDP and median GDP per capita. These countries are Australia, Austria, Belgium, Canada, France, Germany, Japan, the Netherlands, Sweden, Switzerland, and the United Kingdom.
Data were collected and analyzed by researchers at KFF using a variety of data sources (which can be found for specific indicators on the indicator page on the dashboard). The dashboard includes more than 50 indicators of health system performance, organized into four domains – a structure based largely on the framework put forth in the National Academy of Medicine’s 2015 Vital Signs: Core Metrics for Health and Health Care Progress. Indicators on the dashboard were selected through consultation with other experts in the field and a review of various additional sources of data on quality and outcomes measurement, including: National Quality Forum; Healthcare Effectiveness Data and Information Set (HEDIS); Consumer Assessment of Healthcare Providers and Systems (CAHPS); America’s Health Rankings; Medicare Access and CHIP Reauthorization Act of 2015 (MACRA); CMS Hospital Compare; US News and World Report; America’s Health Insurance Plans (AHIP)/CMS Core Quality Measures Collaborative; Commonwealth Fund; as well as a review of sources for data on health spending, such as the Bureau of Economic Analysis (BEA), National Health Expenditure Accounts (NHEA), and the Medical Expenditure Panel Survey (MEPS). The Healthcare Quality and Access (HAQ) Index is a metric developed by the Institute for Health Metrics and Evaluation and based on the Global Burden of Disease (GBD) study.
The dashboard is limited to some extent by what data are available at the health system level, particularly for indicators of health system quality (see our in-depth discussion here). While health spending, access, and health status data are more readily available and standardized, some indicators of quality of care are less standardized and often only available nationally for the Medicare population. The quality measures included in the dashboard were selected through consultation with a number of experts in the field and present a comprehensive look at treatment outcomes, patient safety, appropriateness of treatments, use of preventive services, and health system resources.
The Peterson Center on Healthcare and KFF are partnering to monitor how well the U.S. healthcare system is performing in terms of quality and cost.