Jeffrey Selberg is a Senior Advisor with the Peterson Center on Healthcare. Bradley Sawyer, Cynthia Cox, Marco Ramirez, Gary Claxton, and Larry Levitt are with the Kaiser Family Foundation.
Measuring the value of the U.S. healthcare system – and particularly assessing whether it has improved or worsened – is not a straightforward task. The evaluation would be reasonably easy if there were better outcomes at the same or less cost, or, vice versa, if we are paying more and generating the same or worse outcomes. The complexity arises when better outcomes are generated at a much higher level of spend, as is the case in this evaluation. As a result, at what point is the increase in spending not justified by the improvement in outcomes?
The Peterson-Kaiser Health System Tracker includes a “Dashboard” of indicators that can be used to describe, evaluate and compare changes in the value of U.S. healthcare over time. With many measures spanning 25 years, or approximately a generation, the Dashboard can help answer the following questions:
- Is the U.S. generating better value now than in the past?
- Has the value of U.S. healthcare improved relative to other advanced OECD countries?
- How do factors other than healthcare affect how health outcomes vary across countries?
In this analysis, we use the information presented on the Dashboard to assess whether the value of the U.S. health system has improved or worsened from 1991 – 2016, or the most recent year of available data.
The Results
Our approach was to measure the level of improvement in health outcomes, and the incremental costs the healthcare system incurred at the same time. Between 1991 and 2016, life expectancy increased by 3.1 years to 78.6, representing a 4% improvement. In the same time, disease burden (as measured by the total number of disability adjusted life years, or DALYs) improved by 12%.
Related Content:
Disease burden is comprised of two factors: years of life lost to premature death, which improved by 22%, and years living with disability, which worsened by 2%. The improvement in overall years of life lost was driven by a remarkable 36% reduction in years lost due to premature death from diseases of the circulatory system.
At the same time, the worsening of years living in disability was led largely by an increase in substance use disorders. Moreover, substance use is one of the primary contributors to the slight decline in life expectancy in 2015 and 2016, the first time life expectancy has dropped two years in a row in several decades. Another critical outlier where outcomes have worsened in the U.S. (and not other comparable countries) is maternal mortality, which has gone up significantly from 14 deaths per 100,000 live births in 1991 to nearly 31 in 2016.
Despite some noteworthy exceptions, health outcomes have generally improved in the U.S. over the past 25 years as measured by life expectancy and disease burden. However, since value is a function of outcomes and cost, one must also take into account the increase in the spend within the same time frame. In 1991, the GDP attributable to healthcare was 12.8% or $788 billion. In 2016, healthcare consumed 17.9% of GDP or $3.3 Trillion. Is the 4% improvement in life expectancy and 12% reduction in disease burden enough to warrant a 40% increase in GDP consumption over the past 25 years? What does this portend for future access and affordability?
Peer countries generated greater health gains than the United States, while the rate of growth in healthcare’s share of GDP was similar
Much has been written with regard to the economic value of a quality adjusted life year with no consensus on how such a benchmark should be used in the U.S. to determine value, allocate resources, or specifically determine the course of care for an individual. Much more analysis and discussion, beyond the scope of this paper, would be necessary to make such a judgement. What the Dashboard shows is improved performance at a high cost. Without putting a value on human life, a direct measure of the value of our healthcare system is not possible. The assessment would be subjective and in the eye of beholder.
Over the past 25 years, peer countries generated greater health gains than the United States, while health spending growth was similar Share on XAnother approach to the value question, however, is to compare measures of health outcomes and spending metrics to those of other high-income countries within the same time frame. Has the value of the U.S. health system improved or worsened relative to other countries?
Over the past 25 years, similarly sizable and wealthy nations generated an average increase in life expectancy of 5.2 years, or 7%, compared to the U.S.’s 3.1 years, or 4% improvement. In these countries, disease burden improved by 22%, compared to the U.S.’s 12%. By these indicators, peer countries generated greater gains than the U.S., while the rate of growth in healthcare’s share of GDP was similar on a percentage basis. On average, comparable countries spend under two thirds (60%) of what the U.S. spends on healthcare relative to GDP, while the per capita spending growth has been similar over the last three decades. As a result, one could conclude that the comparable OECD countries’ value improvement was greater, even though they started at a higher threshold in terms of better outcomes and a lower percentage of GDP consumed to achieve it.
Does the U.S. Have Greater Barriers to Overcome?
Clearly, while the U.S. has improved, we have lost ground to other countries. Is the U.S. health system’s relatively lower value really the fault of the healthcare system, or does the U.S. have greater socioeconomic factors to overcome?
The Dashboard suggests the latter. The disease burden in the U.S. is appreciably higher at 24,235 versus 18,605 disability adjusted life years per 100,000 population—a difference of 30%. Factors external to the system with regard to social determinants and lower social service support may be affecting performance. The 2016 U.S. rate of obesity is over twice that of other high-income countries (40% versus 17%). According to the OECD’s 2016 measure of poverty (which can be applied across countries more easily than the U.S. federal poverty level), 18% of people in the US are living below poverty, versus 10% in comparable OECD countries.
When combined, public and private spending on social services and healthcare is fairly similar across these countries (30.5%) and the U.S. (32.6%), but the distribution is very different in the U.S., where we spent much more than average on health (16.3% vs 10.5% of GDP) and less than average on public social services (16.3% vs 20.0% of GDP) in 2013, the most recent year of available data on social services spending internationally.
The United States spends less on social services and more on healthcare, but has worse health outcomes than similar countries
What do the Intermediate Indicators Portend for Future Performance?
How has healthcare improved in terms of the intermediate indicators within the dimensions of access, affordability, capacity, and quality?
In terms of access and affordability, 16.4% of non-elderly American residents were uninsured in 1991. By 2016, 10.3% of the non-elderly were uninsured and the rate for the total population was 8.8%. Meanwhile, 0% to 1% of the populations in other high-income countries are uninsured. In the U.S., uninsured people are much more likely than the insured to be without a usual source of medical care. Even so, insurance in the U.S. is moving to high deductible plans with 38% of employees enrolled in a plan with a single coverage deductible of $1,000 or more. Premium contributions combined with out-of-pocket spending consumed about 5% of U.S. household budgets in 1991 and that share has grown to 8% as of 2016.
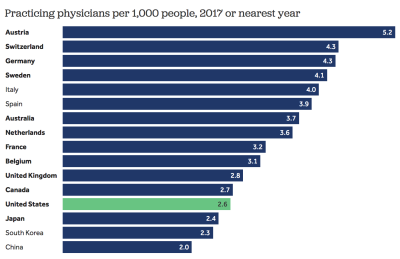
In terms of capacity, the U.S. has 2.6 physicians per thousand population while the comparable country average is 3.5. Other high-income countries have more hospital beds at 5.4 versus 2.8 beds per thousand people. The share of adults who reported seeing a provider on the same or next day without an appointment the last time they needed medical care was similar to in the U.S. (58%) than in other high-income countries (60%).
The U.S. has improved in use of technology in healthcare. In 2008, only 9% of hospitals had electronic medical records. By 2015, 84% of hospitals had EMRs, which is similar to other countries on average.
Quality in the U.S. has improved but it continues to lag behind other OECD countries. Many areas of quality have improved within the U.S. With regard to patient safety, potentially avoidable adult hospitalizations have decreased by 23% from 2005 to 2013 and adverse drug events in hospitals fell by 29% between 2010 and 2015. Mortality amenable to healthcare (the rate of death that might be prevented by access to high quality healthcare) has improved in recent years. However, as of 2014 it remained 58% above that of other high-income countries, on average. As of 2016, the U.S. also still underperformed relative to other high-income countries in terms of numbers of patients who have experienced errors while being cared for: 19% versus 12%.
Based on this brief overview, there is improved access to insurance coverage in the U.S., but it still falls short when compared to other countries. Insurance in the U.S. covers a greater percentage of the total cost of care than it did a generation ago, but, with rapidly rising health costs, out-of-pocket expenses on a dollar basis for the individual have continued to grow and health costs generally consume a larger share of household budgets. This is because growth in premiums and deductibles have far outpaced wage growth in the U.S., a trend that may foretell less affordability in the future. It is difficult to compare affordability to other countries because considerations must be made for the relative tax burdens.
Conclusions
The outcomes generated by U.S. healthcare as measured by life expectancy, mortality amenable to healthcare, and years lost to premature death have improved significantly over the past quarter century. At the same time, the total years living in disability has increased marginally with mental health and substance use issues as the leading contributors to the increase. If the total spend had remained constant at 12.8% of GDP, one could easily conclude that the value proposition had improved dramatically. Unfortunately, healthcare spending in 2016 consumed 17.9% of the nation’s wealth, which is a 40% increase from 1991.
While there are a variety of factors other than healthcare spending that influence mortality and health, it is reasonable to ask the question: Was this increase in spending overall justified by the improvement generated? To those whose lives were saved and to their loved ones, no cost is too much. In terms of an equitable deployment of a nation’s resources among other social services, education, and infrastructure investment – all of which can affect health outcomes — healthcare appears to take a disproportionate share. This is the dilemma of trying to define and ultimately quantify value in healthcare.
One framing question that could help us address this dilemma: Did improvement need to cost this much, and if it did not, what else might we have achieved with the savings? The answer to the first question is clearly no. Other countries are not spending at the level of the U.S. and are getting better results in terms of both outcomes and intermediate measures. Interestingly, price appears to be the major factor in the total spend, since utilization patterns among the U.S. and other countries in aggregate is similar if not lower in the U.S. We also know that there is significant variation in performance within the U.S. in virtually every indicator, representing a significant opportunity for improvement by adopting and spreading best practices. However, while reductions in health spending – or, more realistically, reductions in the rate of growth over time – seem possible when looking at variation within the U.S. or across countries, those changes would have to be made carefully to avoid worse outcomes.
Looking at other country comparisons and analyzing variation within the U.S., there appears to be significant opportunity to be more efficient and effective in improving life expectancy and reducing the burden of disease. Whether improvements in efficiency would result in an actual reduction in spending – or at least a flattening of the spend curve – depends on a combination of utilization rates and a corresponding downward pressure on pricing. To date, total health spending growth has been unencumbered, as rapidly rising prices have overcome slow growth in utilization.
The data appear to support the contention that U.S. healthcare does have a higher threshold to overcome with regard to socioeconomic factors and lower investment in social services. This analysis suggests that there may be greater leverage in making more investments in these areas than in continuing what some would consider to be a disproportionate investment in the medical model.
The Peterson Center on Healthcare and KFF are partnering to monitor how well the U.S. healthcare system is performing in terms of quality and cost.