Despite spending nearly twice as much per capita on healthcare compared to similarly large and wealthy nations, the United States has a lower life expectancy than peer nations and the gap has grown for some measures since the COVID-19 pandemic.
This chart collection combines various measures of quality of care in the United States and other large, high-income nations (based on total and per capita GDP) to show how the U.S. stacks up against its peers and how that has changed over time. Australia, Austria, Belgium, Canada, France, Germany, Japan, the Netherlands, Sweden, Switzerland, and the UK are included in this analysis.
Generally, the U.S. performs worse in long-term health outcomes measures (such as life expectancy), certain treatment outcomes (such as maternal mortality and congestive heart failure hospital admissions), some patient safety measures (such as obstetric trauma with instrument), and health system capacity (such as rate of general practitioners). The U.S. performs similarly to or better than peer nations in other measures of treatment outcomes (such as mortality rates within 30 days of acute hospital treatment) and some patient safety measures (such as post-operative complications).
The U.S. health system appears to perform worse than peer nations on more indicators than it does better. However, inconsistent and imperfect metrics make it difficult to firmly assess system-wide health quality. Some measures of quality – especially long-term measures, like life expectancy – are not only reflective of the health system itself, but also of differences in socioeconomic conditions and population behaviors that are largely outside of the domain of the health system.
Related Content:
Long-Term Health Outcomes
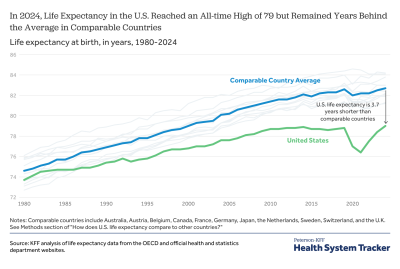
Life expectancy in the U.S. has rebounded to nearly pre-pandemic levels , but remains far below peer countries
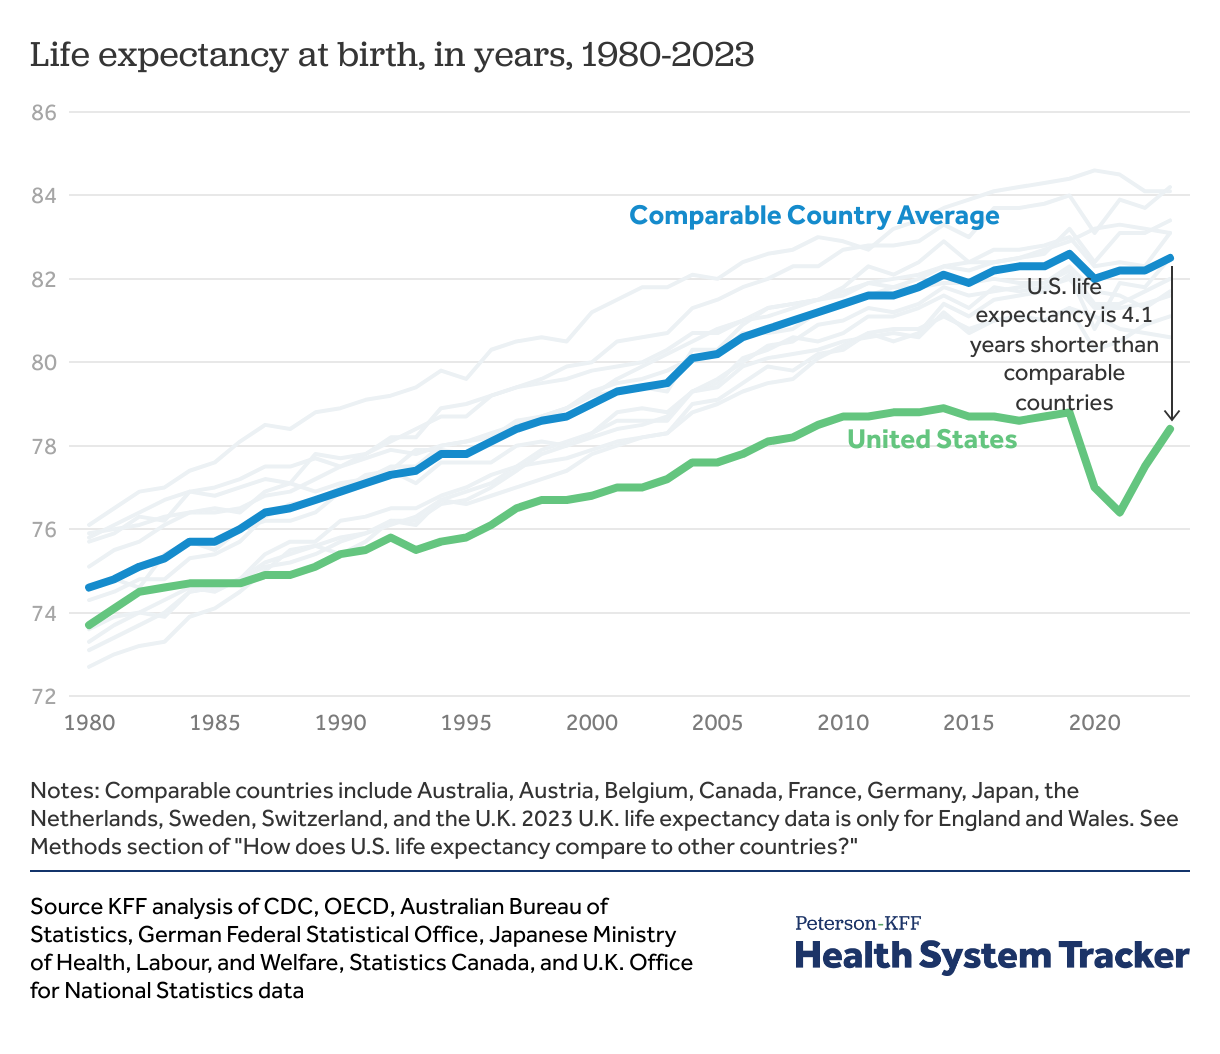
Life expectancy at birth was similar in the U.S. and peer countries on average in 1980 (73.7 and 74.6 years, respectively), but the gap has grown substantially in the following decades as peer nations saw more rapid improvement in life expectancy. The COVID-19 pandemic further widened this gap, and life expectancy in 2023 was nearly 4 years shorter in the U.S. than in peer countries (78.4 years in the U.S. versus 82.5 years in comparable countries, on average).
The above data reflect period life expectancy estimates, based on excess mortality observed in each year. The period life expectancy at birth represents the average age a cohort is hypothetically expected to live if current conditions persisted into the future, not the mortality experience of a birth cohort.
Treatment Outcomes
30-day mortality rates for heart attacks and strokes are lower in the U.S. and peer nations, on average
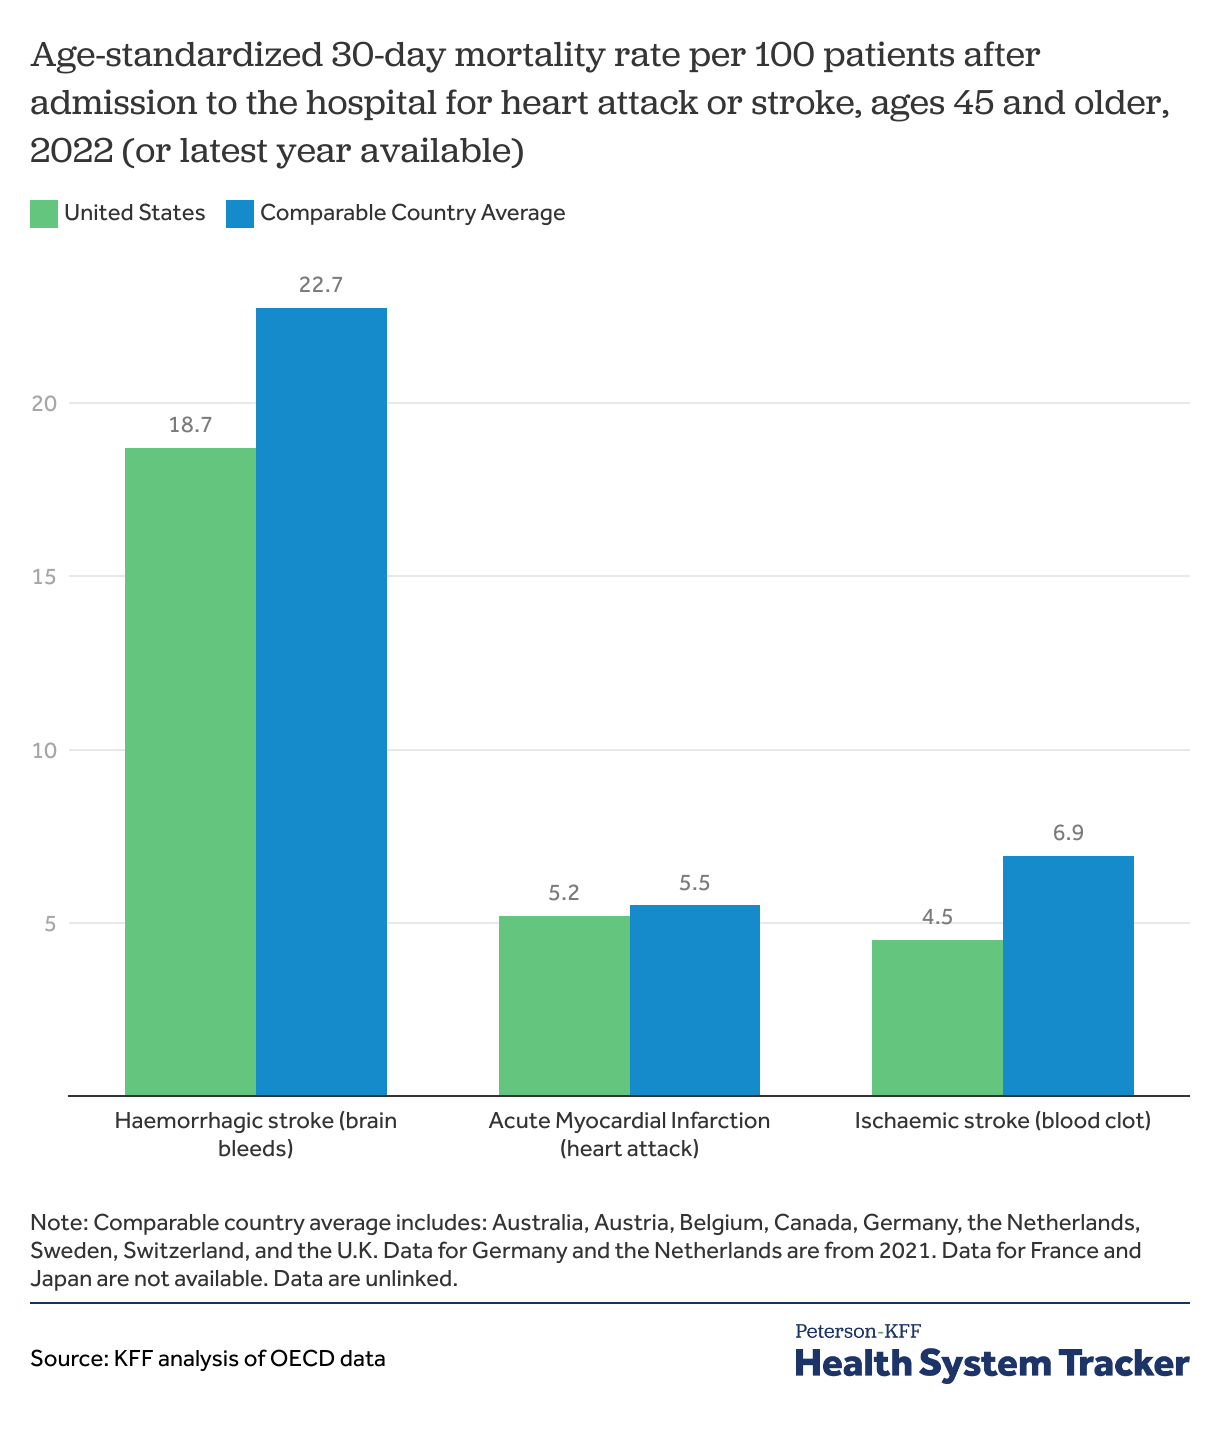
Mortality within 30 days of being admitted to a hospital is not entirely preventable, but high quality of care can reduce the mortality rate for certain diagnoses. In 2022, the 30-day mortality rates after hospital admissions for heart attacks (acute myocardial infarction), hemorrhagic stroke (caused by bleeding), and ischemic strokes (strokes caused by blood clots) are lower in the U.S. than comparable countries on average. It is important to note that several individual peer nations have lower mortality rates than the U.S.
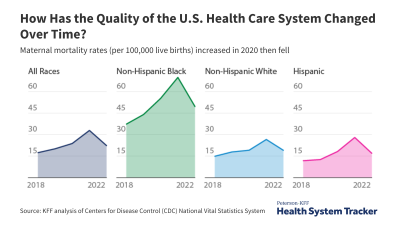
Maternal mortality rates in the U.S. are much higher than in peer countries
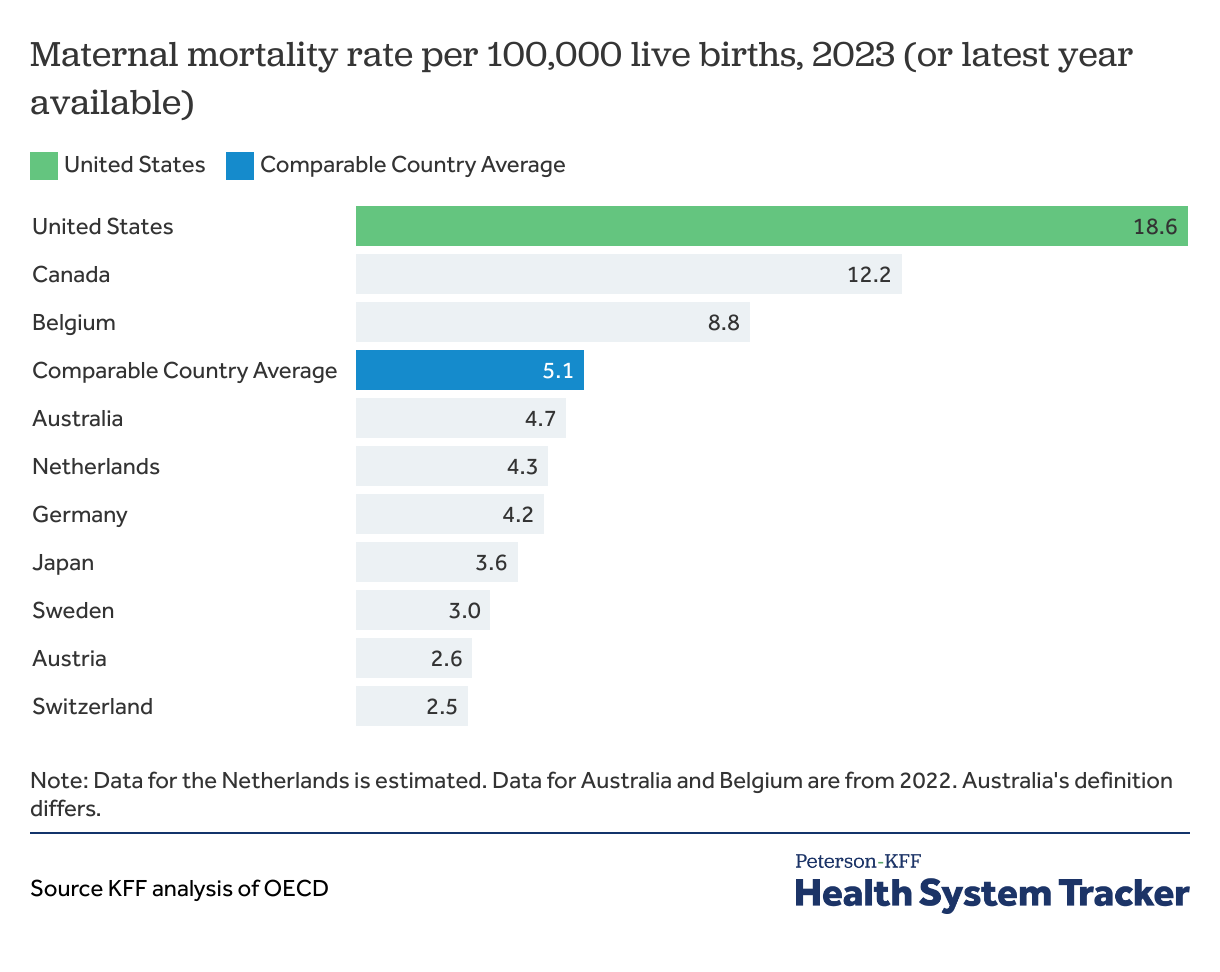
While wealth and economic prosperity are highly correlated with maternal mortality rates, the U.S. is an outlier with the highest rate of maternal deaths (18.6 deaths per 100,000 live births in 2023) when compared to peer countries (5.1 deaths per 100,000 live births, on average).
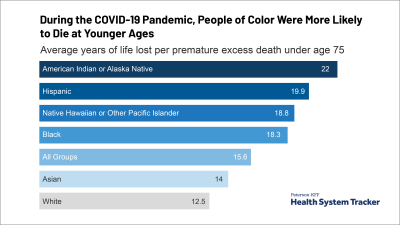
Within the U.S., there are significant racial disparities in maternal mortality rates. The maternal mortality rate for Black mothers is significantly higher than the rate for White mothers — a disparity that persists across age and socioeconomic groups. However, every racial, ethnic, socioeconomic, and age group in the United States sees higher maternal mortality rates than the average in comparable countries.
Hospital admissions for congestive heart failure and diabetes were more frequent in the U.S. than in comparable countries, on average
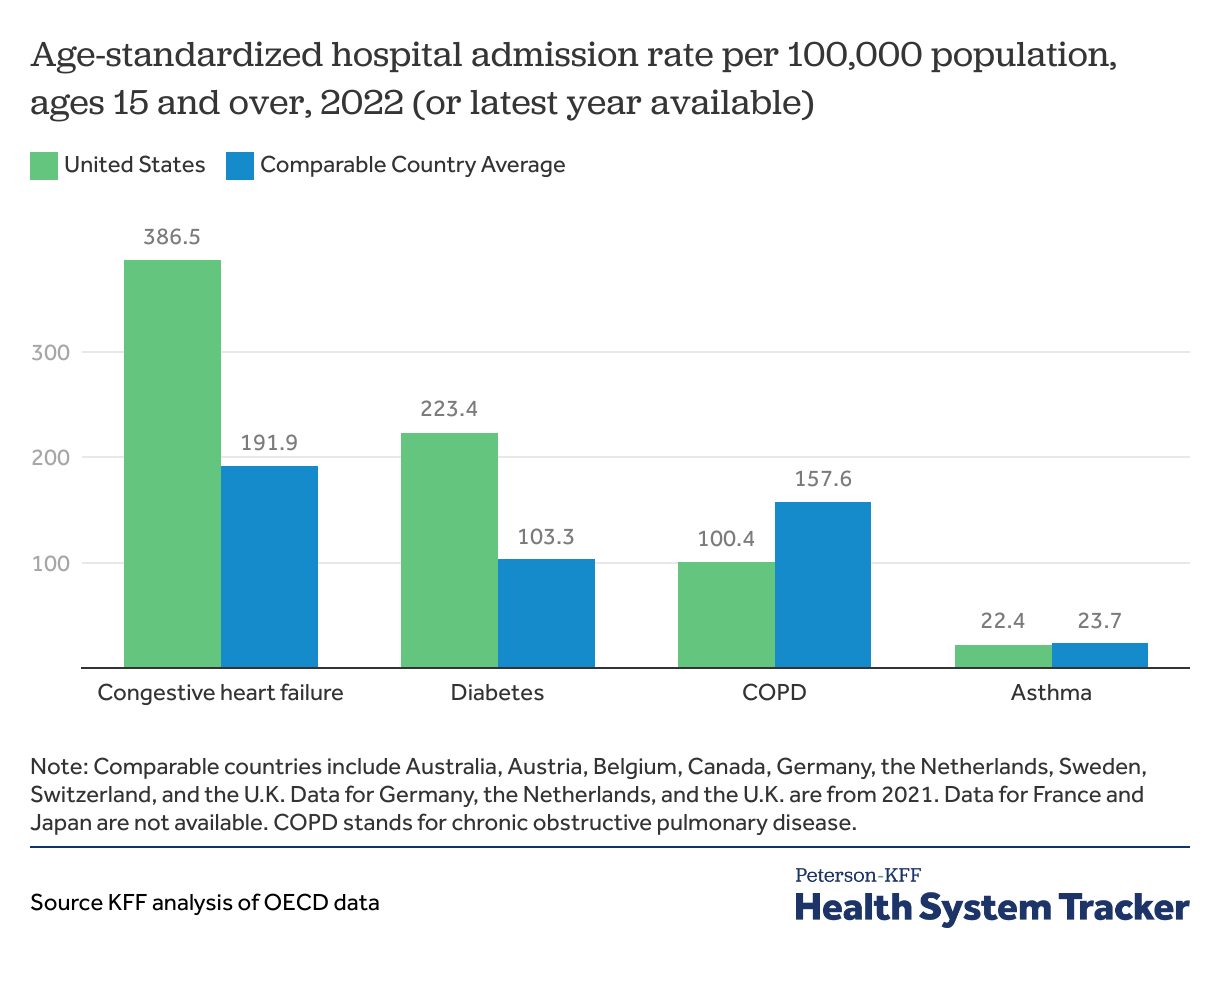
Hospital admission rates in the U.S. are higher than in comparable countries for congestive heart failure and complications due to diabetes, and lower than comparable countries for COPD. Access to and use of primary care and preventive services can play a role in preventing some hospital admissions.
Related Content:
More cesarean sections are performed in the U.S. than in comparable countries
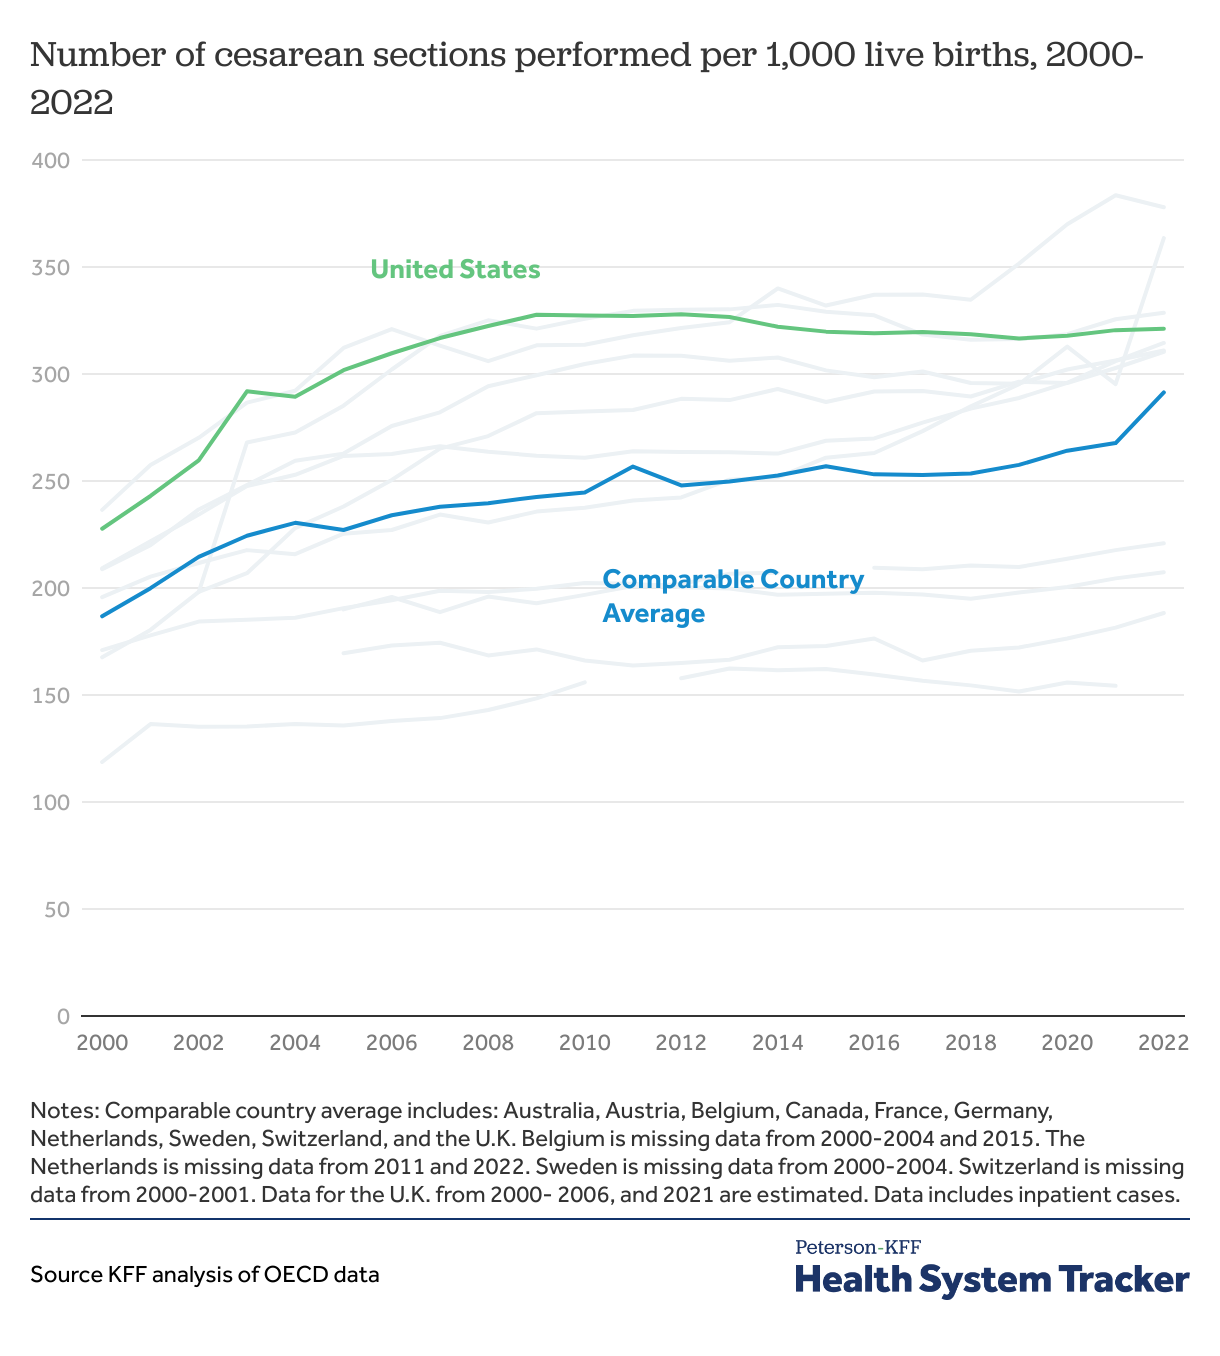
Cesarean sections are one of the most commonly performed surgical procedures in the U.S. and have become a key indicator of quality of care in maternal health. Cesarean sections can be lifesaving. However, when not medically indicated, they can pose unnecessary risks for mothers, including an increased chance of blood clots, infections, and other complications that require further surgery.
The U.S. has consistently had higher cesarean section rates than most of its peers, though rates have plateaued slightly in recent years. In 2021, the rate of cesarean sections per 1,000 live births was 321 in the U.S. and an average of 242 in comparable countries.
Patient Safety
Obstetric trauma during vaginal delivery is more common in the U.S. than in most comparable countries, especially when medical instruments are involved
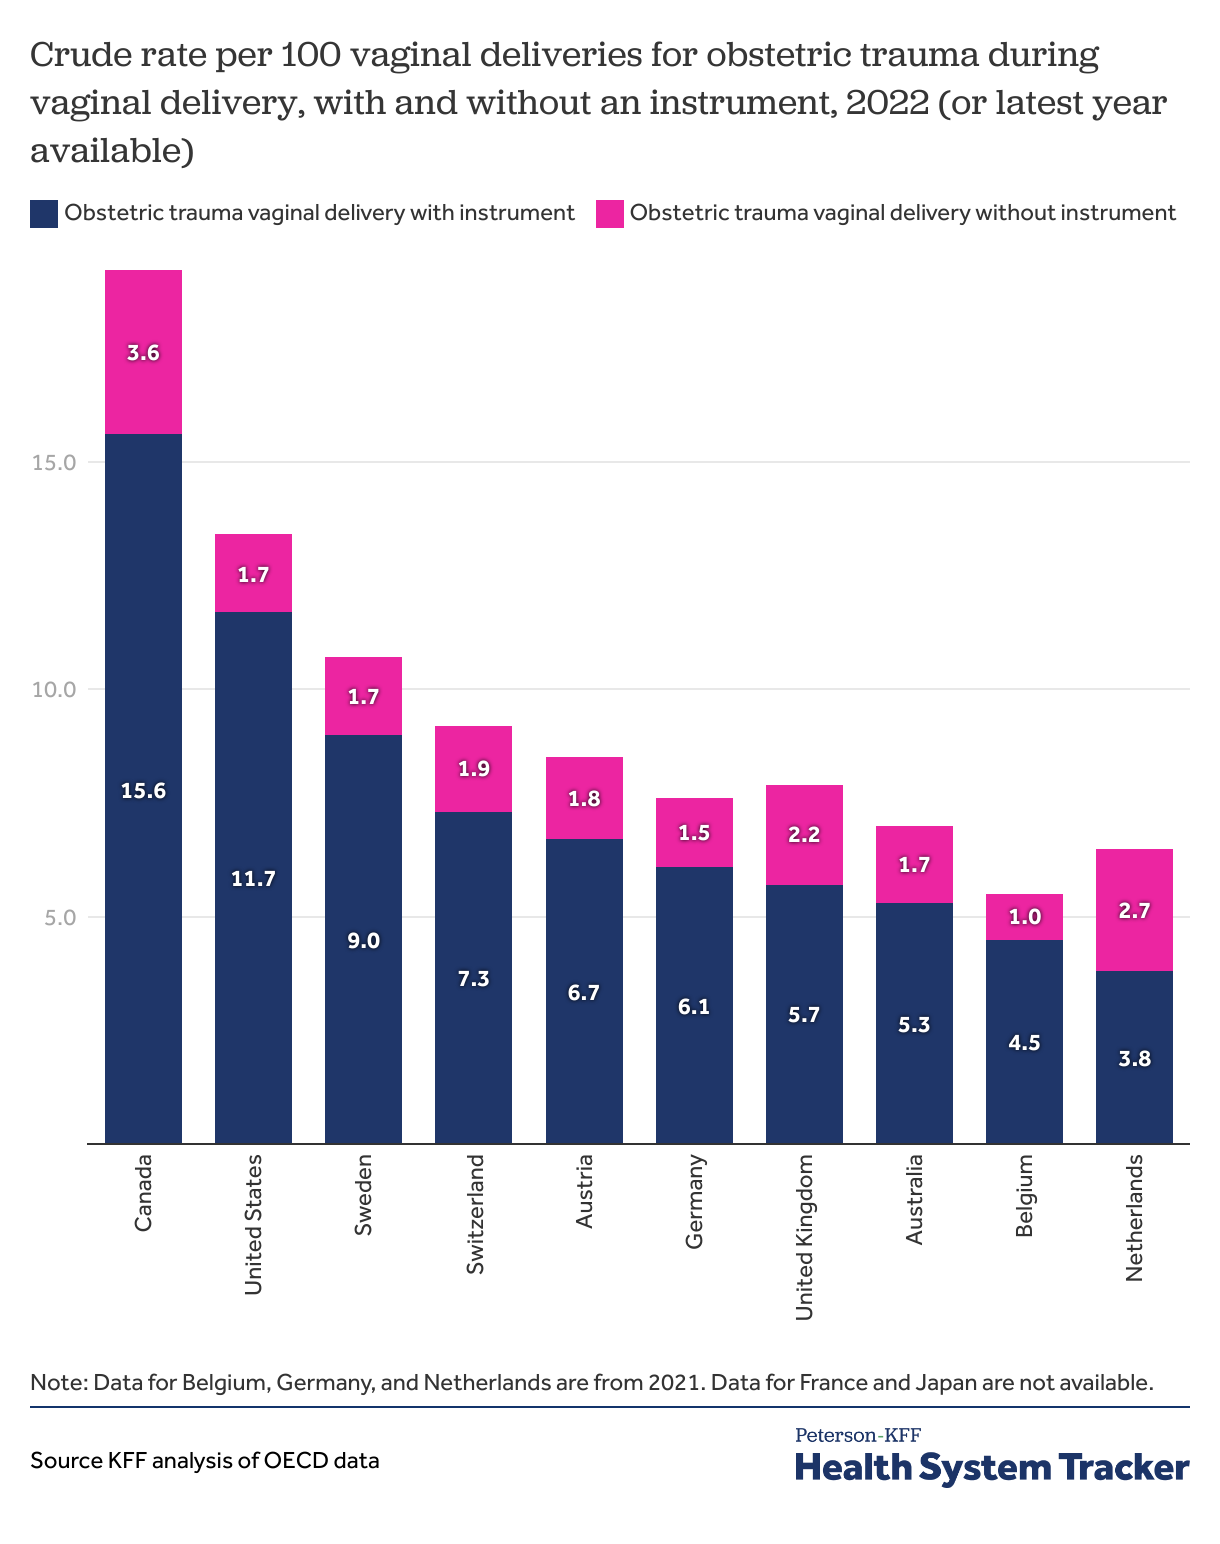
Obstetric trauma is more likely to occur in deliveries where medical instruments are utilized (i.e., forceps). The rate of obstetric trauma during deliveries with an instrument in the U.S. was 11.7 per 100 vaginal deliveries in 2022, higher than most comparable countries with available data. The rate of obstetric trauma during deliveries without an instrument in the U.S. was 1.7 per 100 vaginal deliveries in 2022, on the lower end among comparable countries with available data.
Post-operative complications – such as pulmonary embolism – are less common in the U.S. than most peer countries
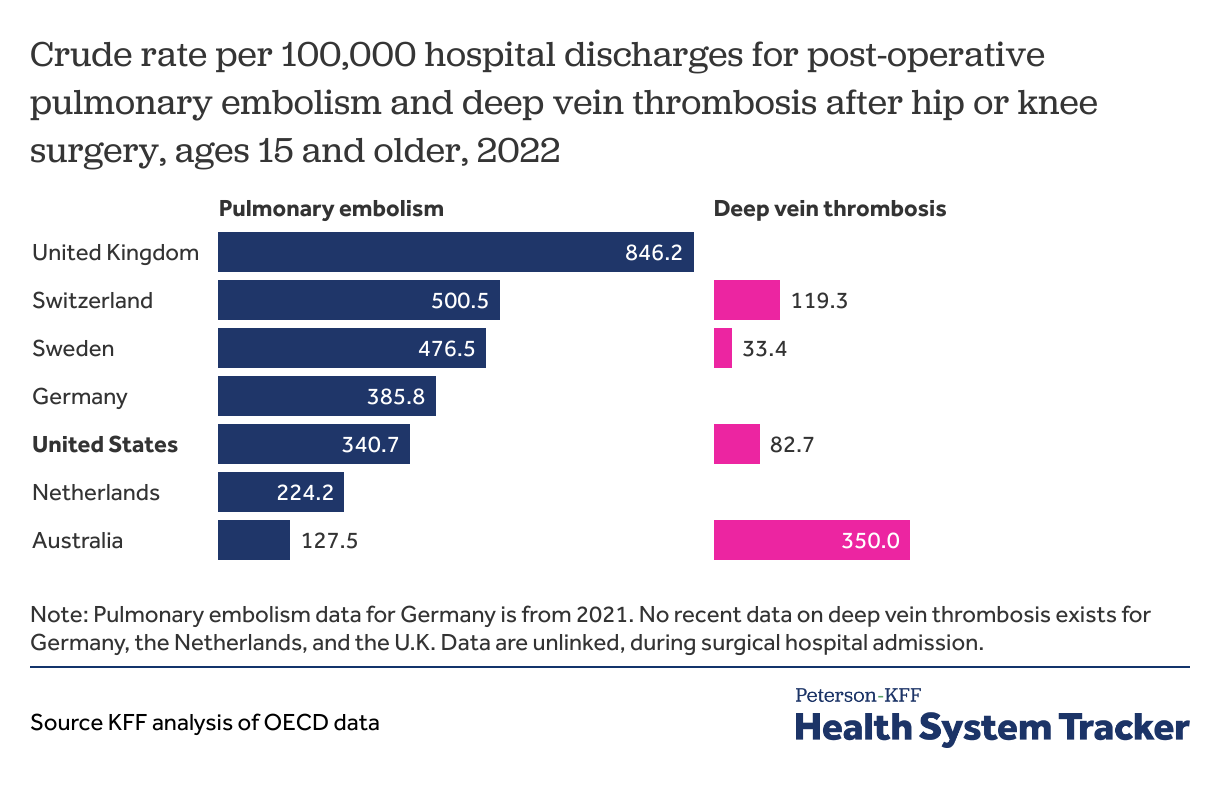
Rates of post-operative complications are an important measure of hospital safety. Pulmonary embolisms and deep vein thrombosis can arise as complications from surgeries or extended hospital stays. The U.S. has the third lowest rate of pulmonary embolisms following hip or knee surgery in 2022 compared to peer countries.
Preventive Services
Americans are less likely to have a regular place of care than peer countries, on average
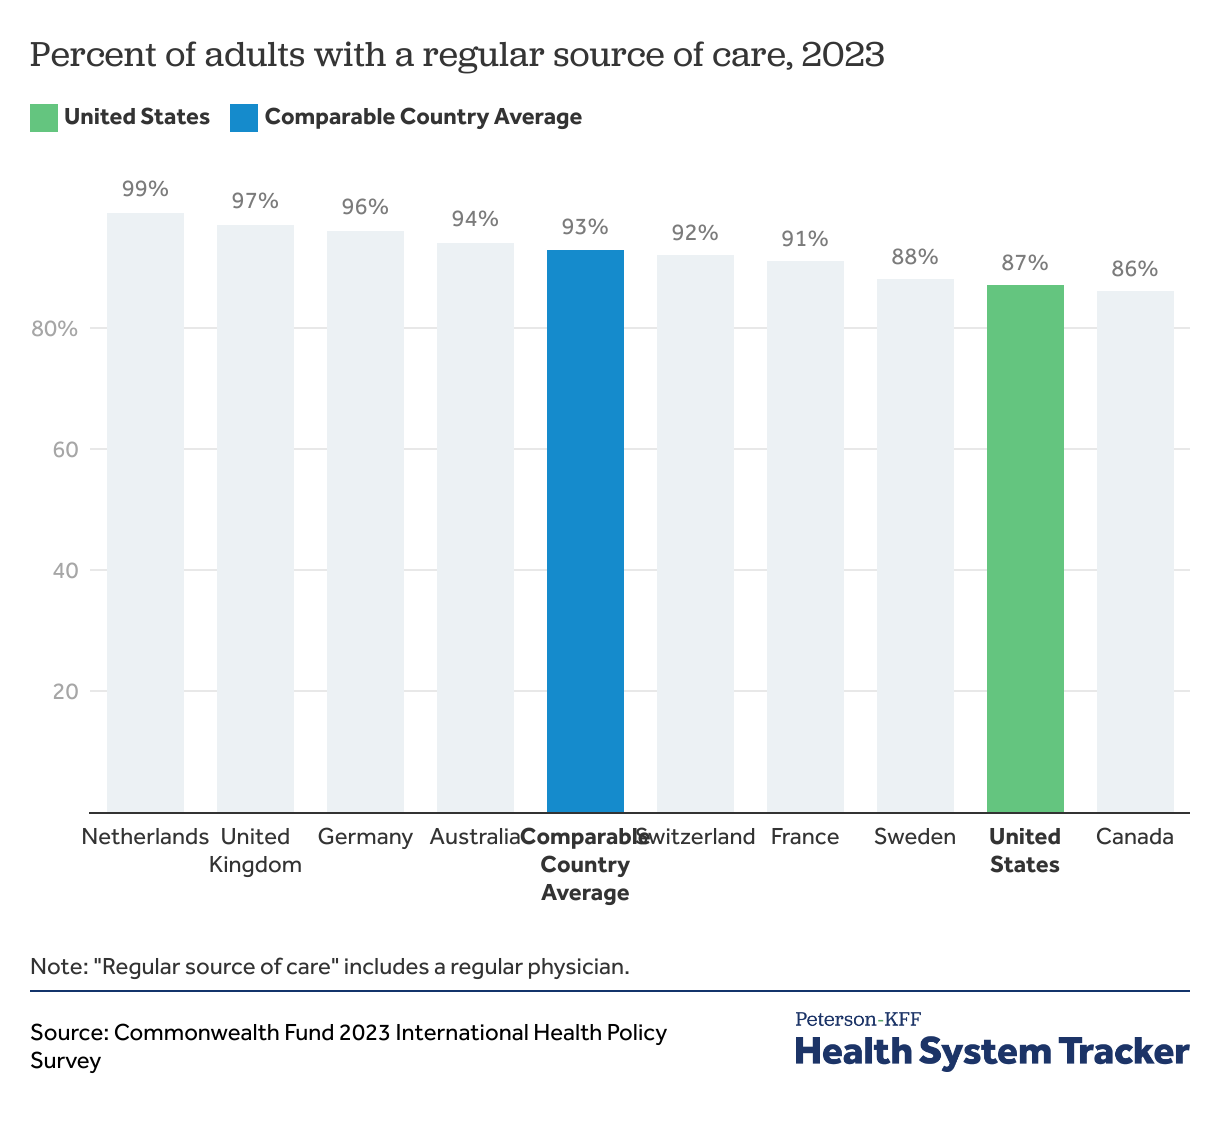
A regular source of care includes medical facilities where a patient usually goes for medical advice. Continuous care is an important measure of health system quality as it facilitates better health outcomes. Within the United States, different demographic groups have varied rates of usual sources of care, with young adults being the least likely to have one.
On average, adults in the U.S. are less likely than peer nations to have a regular doctor or place of care in 2023.
Americans are more likely, on average, to use the ER for non-urgent conditions
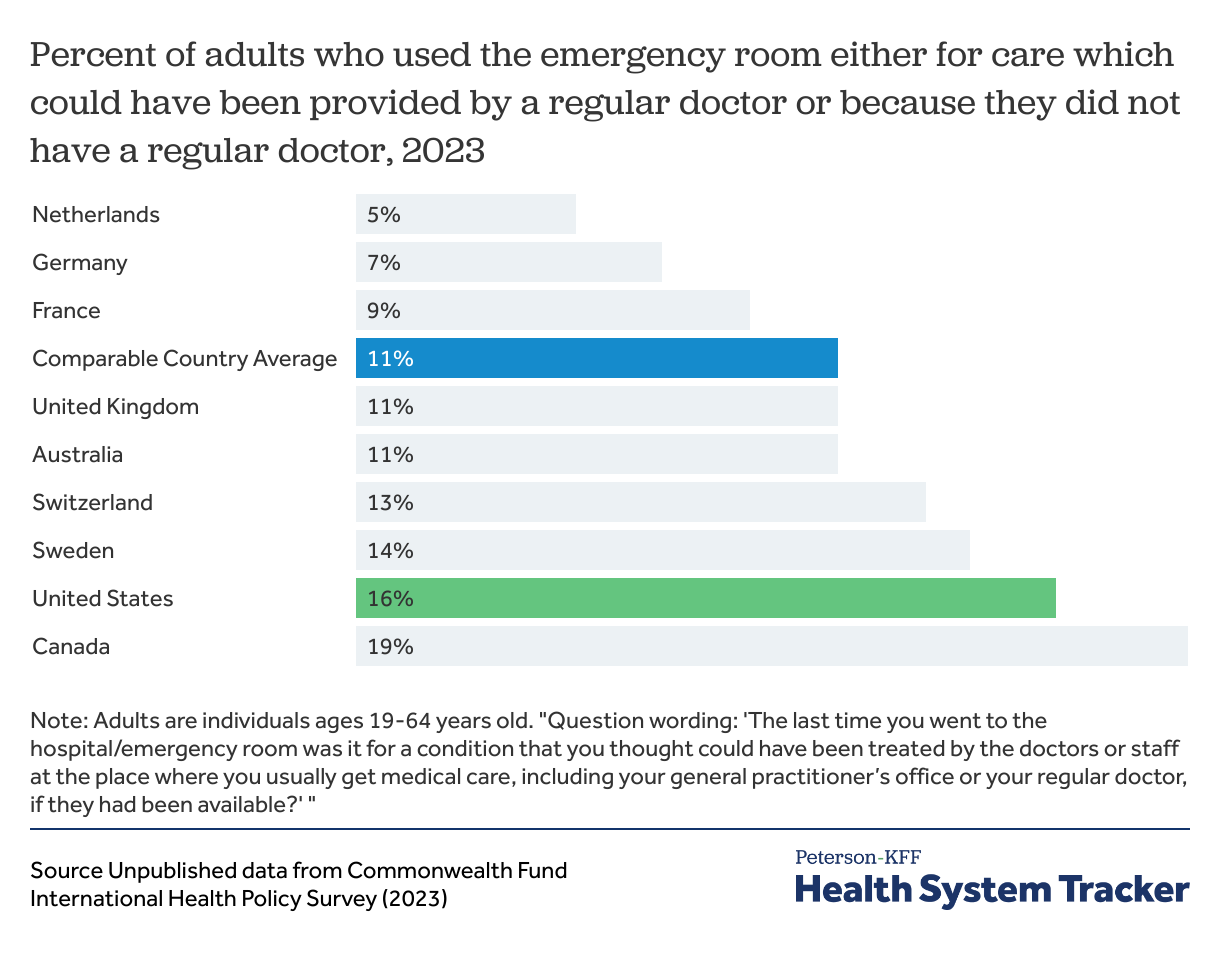
Emergency room visits for conditions that could have been treated in a primary care setting may indicate poor access to outpatient care. In the U.S. about 20% of young and middle-aged adults report experiencing non-cost related barriers to receiving healthcare including lack of appointment availability and inability to find a provider during regular hours. In addition, potentially avoidable ED visits are costly and can contribute to ER overcrowding.
In 2023, 16% of adults ages 19-64 years old in the U.S. used an ER for care that could have been provided by a regular doctor or because they did not have a regular doctor (compared to 11% of adults 19-64 years old on average in peer countries).
Health System Capacity
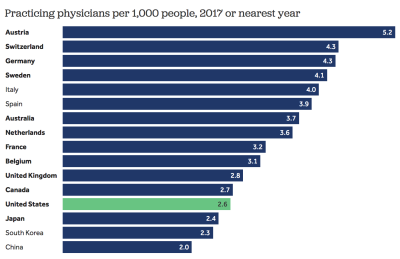
The U.S. has fewer general health practitioners than most peer nations
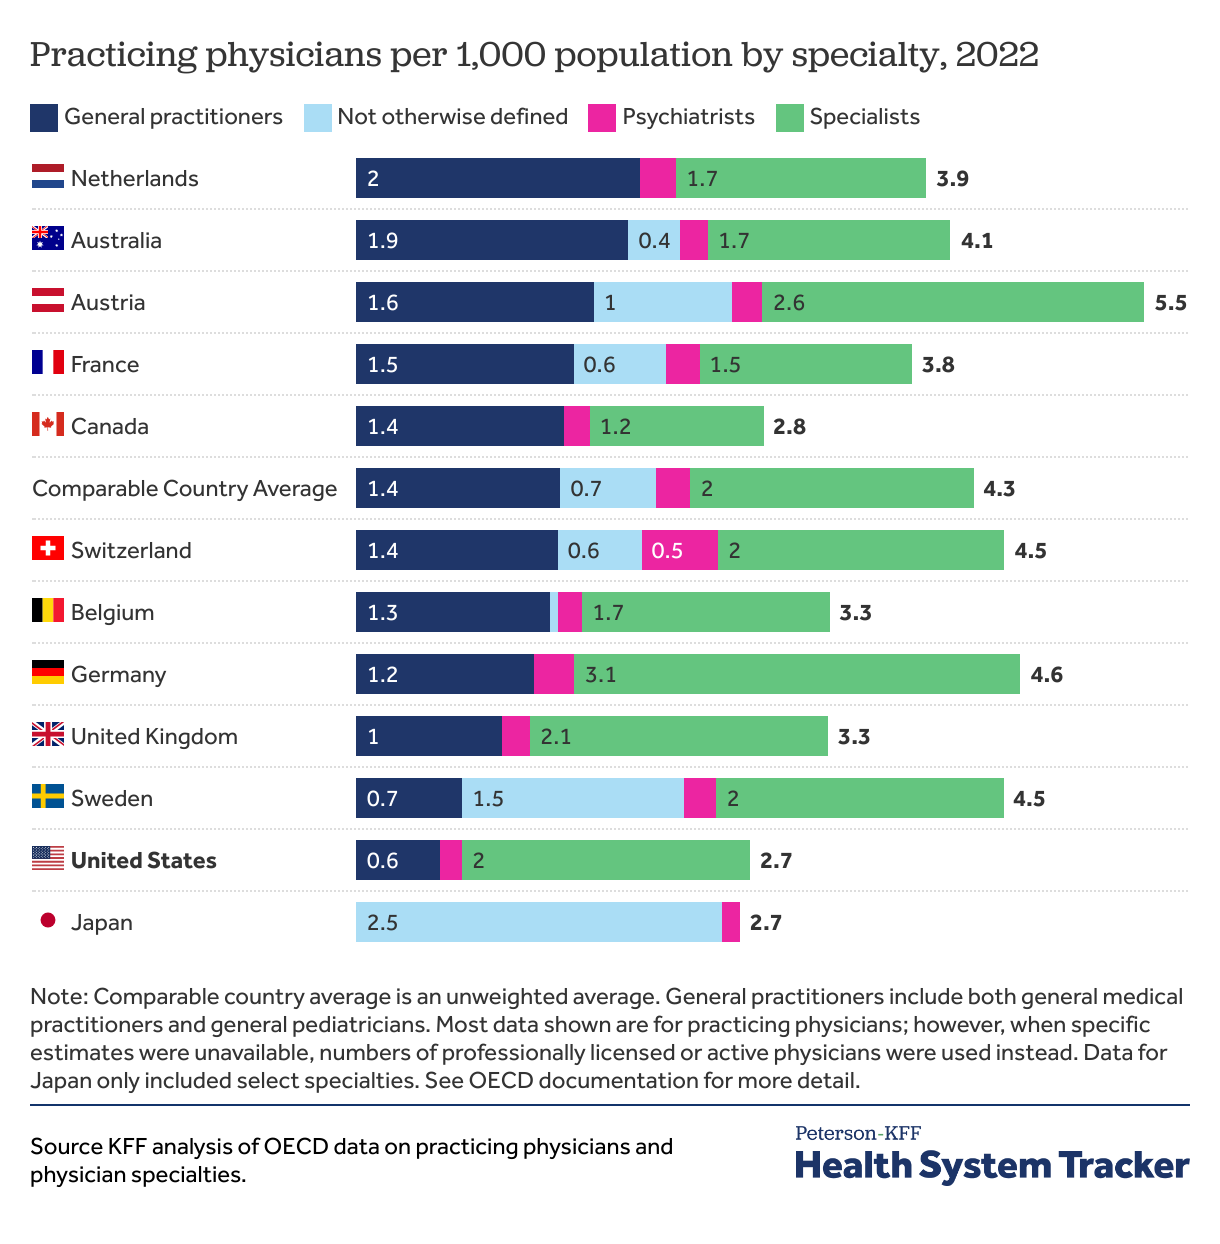
The U.S. has faced a growing physician shortage since the early 2000s. This shortage is particularly notable among general practitioners, including primary care providers. As of 2024, 53% of the U.S. population lived in areas that have been designated as not having enough primary care providers for the population.
In 2022, the U.S. had 0.6 general practitioners per 1,000 individuals while peer nations had an average of 1.3 general practitioners per 1,000 individuals (about 74% difference).
The Peterson Center on Healthcare and KFF are partnering to monitor how well the U.S. healthcare system is performing in terms of quality and cost.