Measuring quality in health care is complex: a vast number of metrics are used to monitor health system performance since there is no singular definition of quality, and data is often limited and delayed.
This chart collection examines five types of indicators: outcomes of treatment, provision of appropriate treatment, patient safety, preventive services, and health system capacity and workforce shortages. While no single indicator represents overall quality, identifying common trends can help determine whether the U.S. health care system is improving or declining over time and identify areas for improvement. Looking at measures on average across the entire U.S. population may obscure systematic disparities across various groups of people, so this chart collection considers demographic breakouts where available.
Health care quality indicators related to hospital readmissions and vaccinations have improved or remained steady over the past two decades. Yet worsening outcomes, including in-hospital mortality, reveal areas where the U.S. health system could improve.
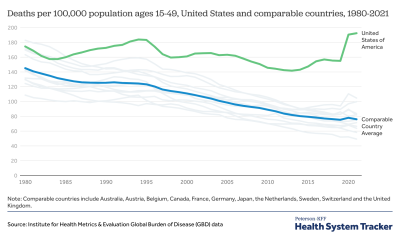
A related chart collection compares the U.S. internationally to its peer countries in the quality of health care provided and health outcomes.
Treatment Outcomes
Treatment-related quality of care metrics measure health outcomes of people receiving care for specific conditions. Well-functioning health systems maximize desirable outcomes through medical interventions while minimizing avoidable mortality and morbidity both during and after treatment. While isolating treatment outcomes for a population can be challenging due to the many factors at play, mortality rates related to care can provide some insight into quality of care. Treatable mortality, in-hospital mortality, and maternal mortality can reflect the effectiveness of medical interventions, the quality of care, and the ability of health systems to manage severe conditions. These charts illustrate how treatment outcomes have changed over the past few years.
Related Content:

Treatable deaths have remained steady for the last decade.
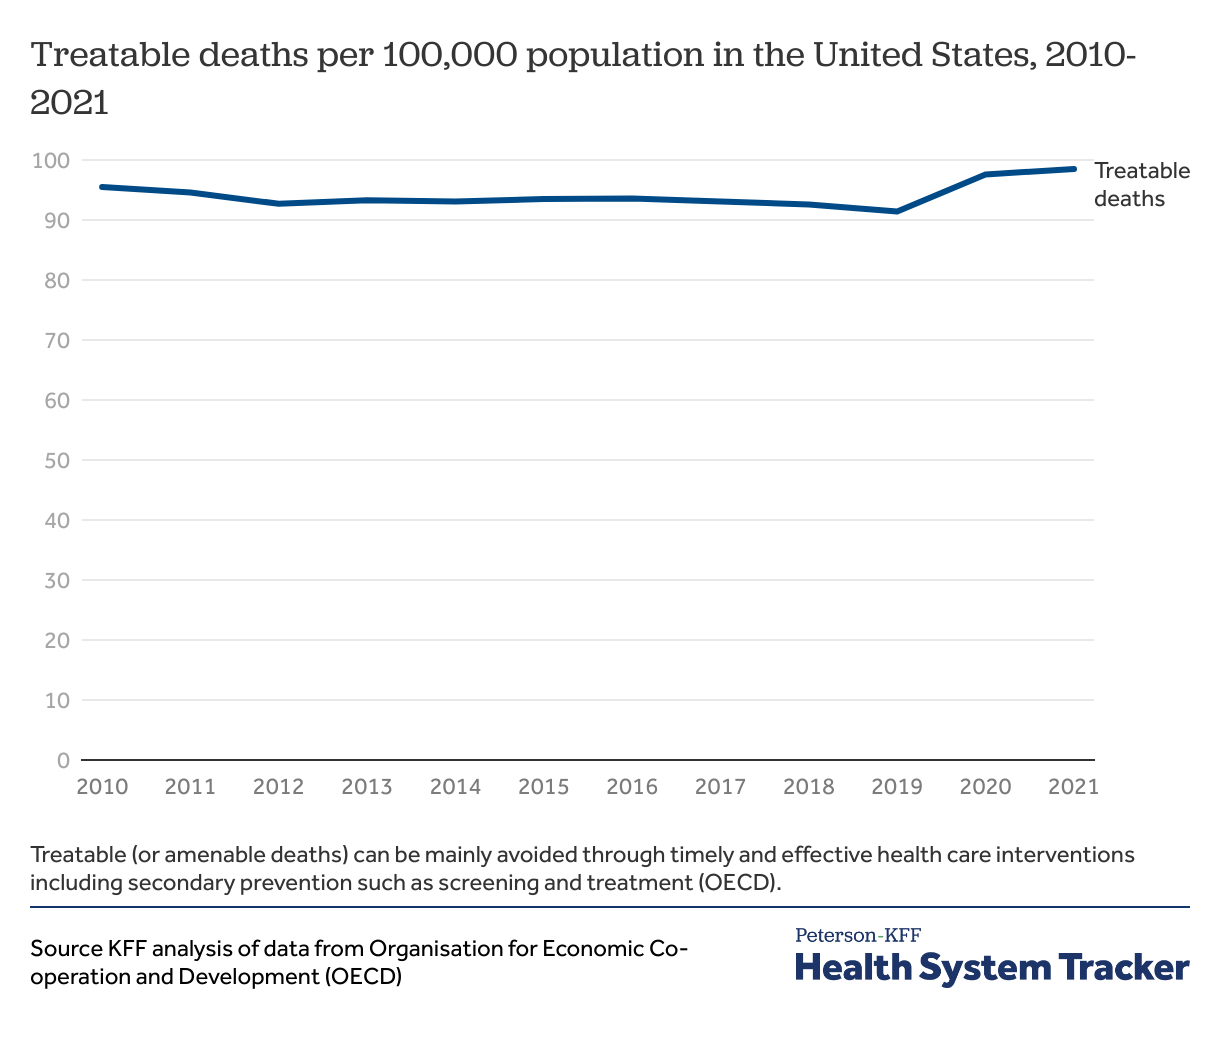
Some deaths result from medical conditions for which there are preventive or health care interventions. These deaths are categorized by the OECD as treatable deaths. While from 2000 to 2020 treatable deaths in the U.S. have steadily declined, there was an uptick in 2020.
Rates of in-hospital mortality were relatively stable before sharply rising
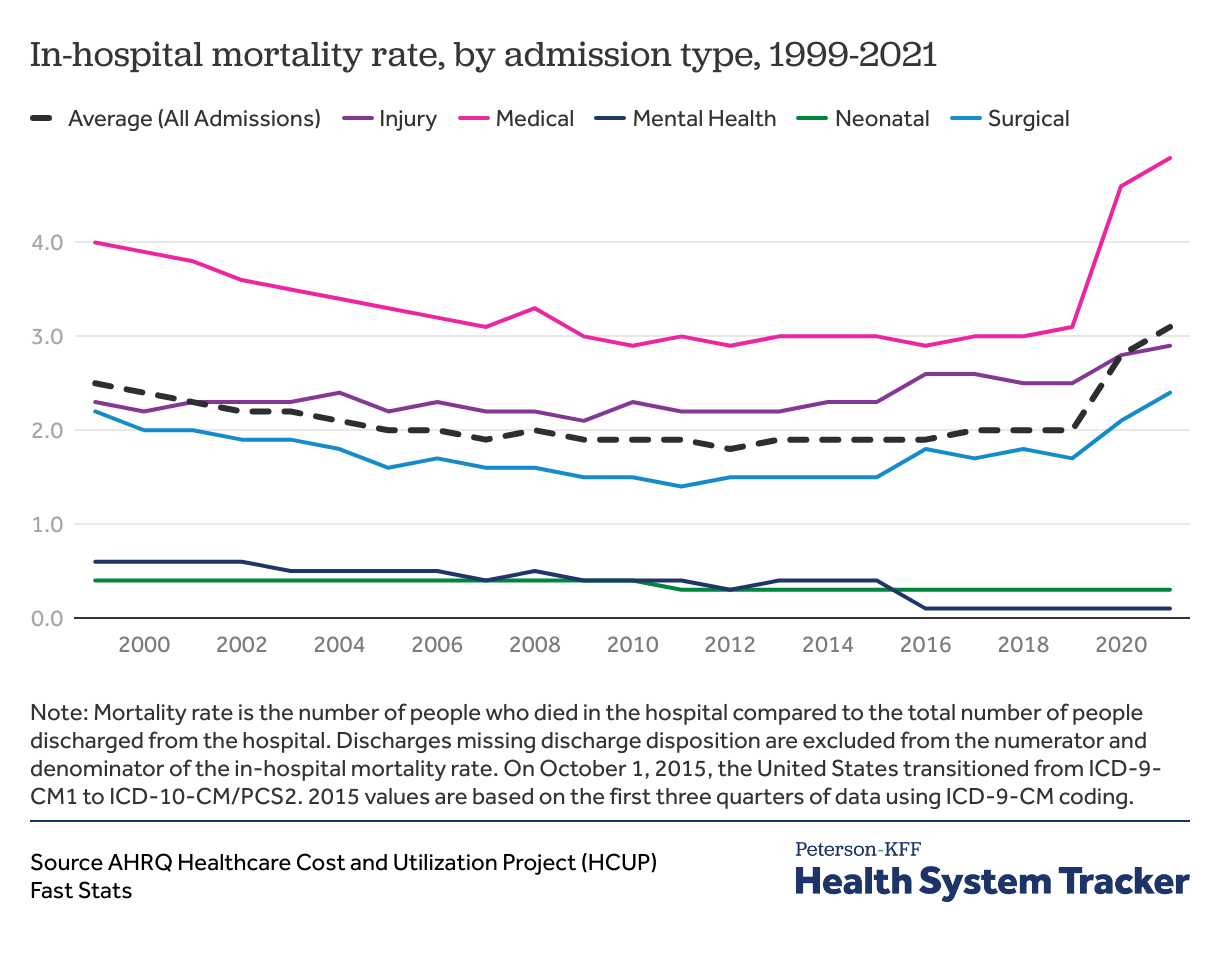
In-hospital mortality rates increased overall during the COVID-19 pandemic, from 2.0% of discharges in 2019 to 3.1% in 2021. AHRQ categorizes in-hospital mortality rates into hospitalization types: neonatal, mental health/substance use, injury, surgical, medical, and maternal (shown below), which are based on the principal diagnosis of the hospitalization stay. As in-hospital mortality rose for medical, surgical, and injury hospitalizations, neonatal rates remained steady in 2021 while mental health in-hospital mortality rates decreased slightly. It’s not clear to what extent the increase in in-hospital mortality rates represented a change in quality of care, or instead was a direct product COVID-19 illness and an indirect product of its strain on resources.
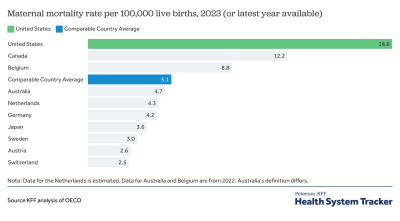
Maternal mortality rates decreased in 2022, but disparities remain
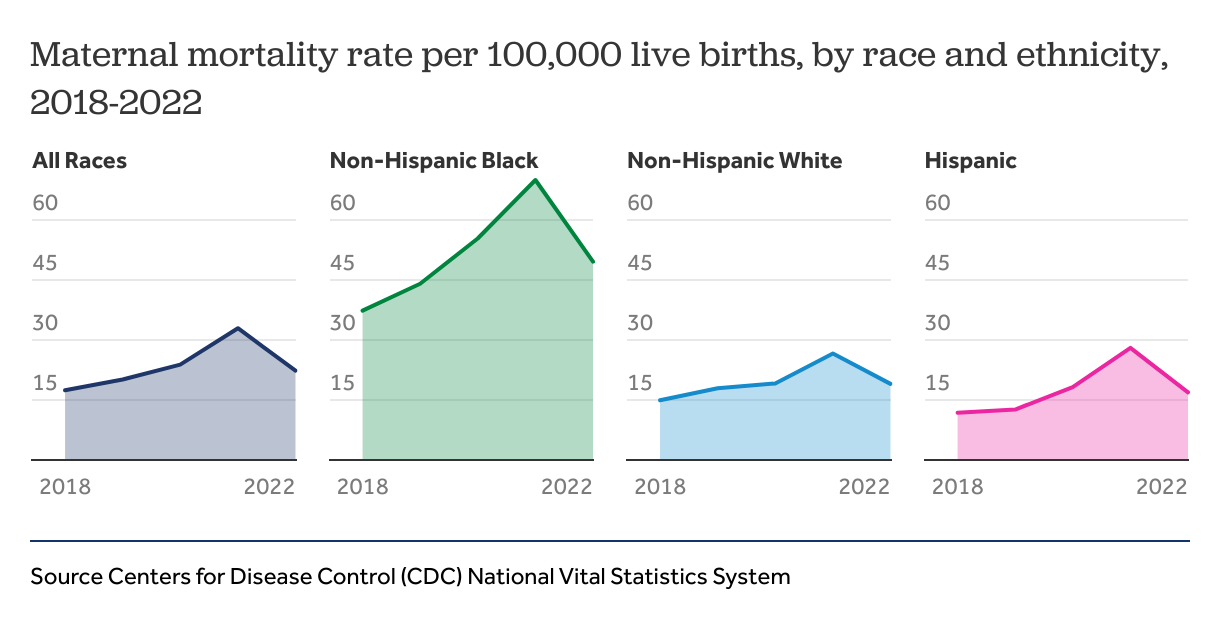
Maternal mortality has been of growing concern in the past decade. Maternal morbidity, including hypertension and gestational diabetes, and death rates, acutely increased during the during the COVID-19 pandemic as access and use of normal health care and prenatal care declined. U.S. maternal deaths have declined from their peak in 2021 from 32.9 deaths per 100,000 live births, or 1,205 deaths, to 22.3 deaths per 100,000 live births in 2022, a total of 817 deaths. However, racial and ethnic disparities in maternal mortality linger. Black women were more than twice as likely to die due to pregnancy related complications compared to White or Hispanic women. Additionally, in 2021, maternal mortality was also significantly higher for women over the age of 40 (138.5 deaths per 100,000 live births) compared to the national average (32.9 deaths per 100,000 live births).
Appropriate Treatment
Measures of appropriate treatment assess whether patients receive timely, suitable care and whether a more intensive level of treatment could have been avoided. These measures are challenging to evaluate at the population level because clinical treatment decisions are complex and often individualized.
Metrics include emergency department visits or hospital admissions that may have been preventable and indicate a lack of appropriate outpatient care. Asthma, diabetes, and heart failure are examples of conditions for which many hospitalizations could have been prevented if patients were monitored and managed appropriately in the outpatient setting. Such conditions are considered ambulatory care-sensitive conditions (ACSCs), and they have been decreasing overall.
After a hospitalization, complex medical conditions require effective discharge planning, including care coordination, scheduling follow-up visits, addressing social and home health care needs. Readmission after discharge from hospital can occur for many reasons, but may indicate inappropriate discharge, poor discharge planning, or lack of follow-up care to manage complications.
Readmissions and hospitalizations for potentially preventable conditions are steady
Related Content:
The percentage of inpatient readmissions within 30 days of an acute hospital stay among Medicare beneficiaries 65 and older have remained relatively stable, around 17% of admissions, in the last decade. While readmission rates initially decreased with the implementation of the Hospital Readmissions Reduction Program provisioned in the Affordable Care Act, they have since stabilized. The broader effects of CMS Innovation Models to impact readmission remains to be seen as adoption increases.
While overall readmission rates are useful metrics, variations in clinical characteristics make comparisons difficult across different conditions and age groups. The National Quality Forum catalogs metrics targeting specific clinical conditions. For example, based on KFF analysis of Merative Marketscan Commercial Database for adults with employer-sponsored insurance, the 30-day unplanned readmission rate for cancer hospitalizations remained steady between 15-16% from 2016 to 2021. For pediatric patients, the 30-day unplanned readmission rate remained steady between 27-28% from 2016-2021.
Among older adults with Medicare, hospital admissions for ACSCs decreased from 52.1 per 1,000 beneficiaries in 2012 to 28.6 per 1,000 in 2021. Potentially avoidable emergency department visits remained steady from 2012 to 2019, before decreasing during the COVID-19 pandemic in 2020. For adults under 65 with employer-sponsored insurance, hospital admissions for ACSCs remained steady around 3 per 1,000 employer-coverage enrollees from 2015 to 2021, while potentially avoidable emergency department visits decreased about 16% during that period. While hospitalizations for ACSCs have decreased overall, specific diseases have seen an increase.
Complications from diabetes remain steady
Diabetes, a disease in 1 in 10 Americans, is one of the top 10 leading causes of death, and potentially treatable hospitalizations for people with diabetes remain steady.
For diabetes, appropriate treatment, such as use of medications, monitoring, and effective management of blood glucose levels can reduce the risk of serious complications, such as cardiovascular disease, kidney damage, and nerve problems. High adherence rates may reflect effective patient education and communication, and the affordability of treatments. This often correlates with better health outcomes.
Related Content:
Black adults with diabetes experienced slower growth in rate of hospitalization for lower extremity amputation while White adults have seen increasing rates
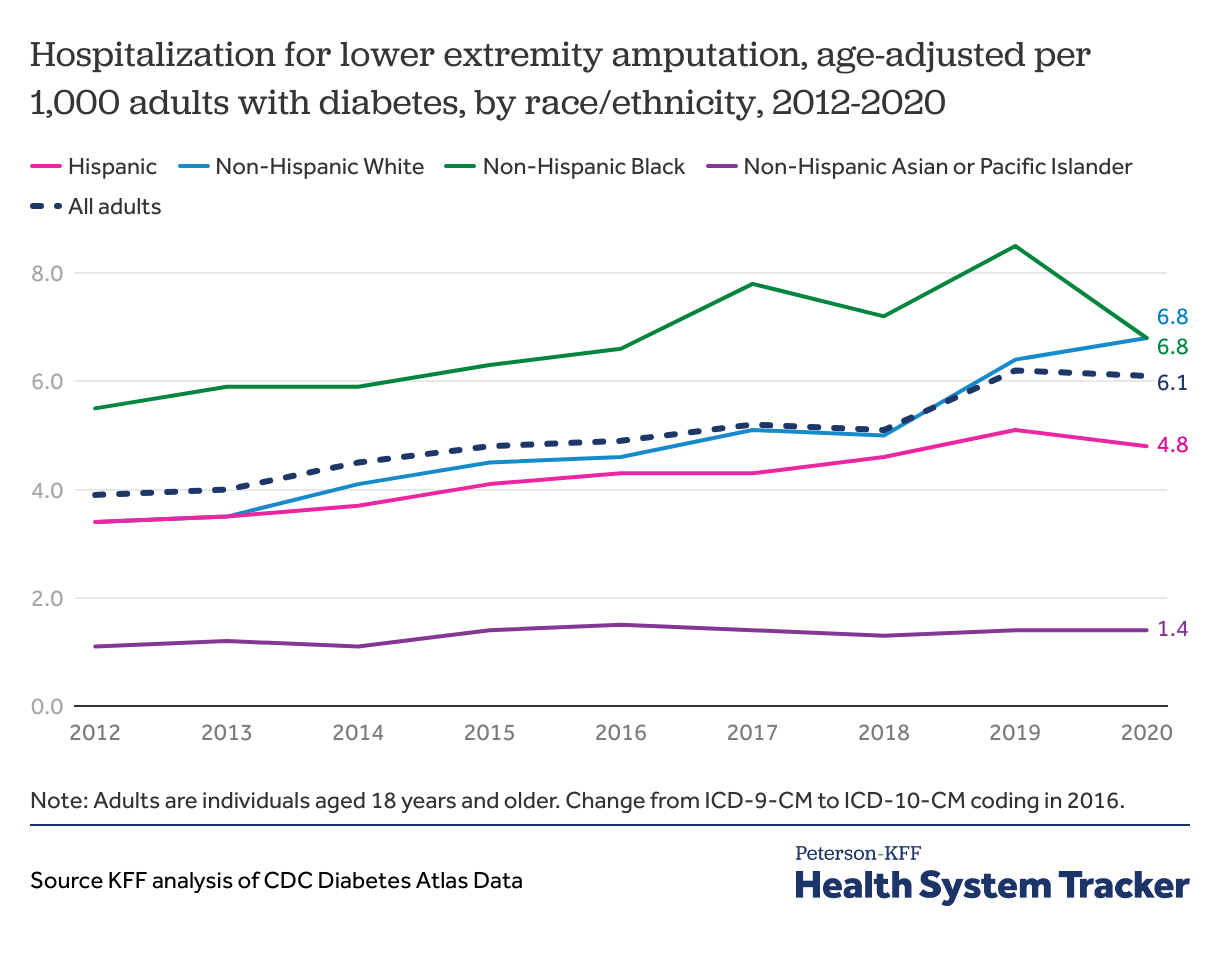
A quality healthcare system would aim to reduce preventable emergency care and negative outcomes for patients with diabetes through appropriate treatment and monitoring. From 2012 to 2020 hospitalizations for lower extremity amputation increased slightly from 3.4 per 1,000 adults with diabetes to 5.0 per 1,000 adults with diabetes respectively. Before 2020, non-Hispanic Black adults with diabetes were more likely to be hospitalized for lower extremity amputation than adults of any other race or ethnicity. By 2020, both non-Hispanic Black and non-Hispanic White adults with diabetes had hospitalization rates of 6.8 per 1,000, higher than the overall average of 5.0 per 1,000 among adults with diabetes in that year.
Hospital visits for hyperglycemia, another complication of poor glycemic control, increased slightly from 21.8 per 1,000 adults with diabetes in 2012 to 26.1 per 1,000 in 2020. Most recent data show rates of hyperglycemia remain highest among Black populations (35.1 per 1,000), which is 2.5 times higher compared to the lowest rate among Hispanic populations (14.5 per 1,000).
Recently there has been a surge in use of GLP-1 receptor agonists to treat diabetes due to their proven effectiveness in improving blood sugar control. However, the long-term impacts of these drugs as a glycemic control remain to be seen.
Patient Safety
Measures of patient safety assess neglect or harm to patient health when they receive medical care. Examples of low-quality care include medication errors, diagnostic errors, and healthcare-associated infections that can adversely impact health outcomes. The economic impact of medical errors in the United States has been estimated at over $17 billion annually and is estimated to contribute to over 200,000 deaths per year. While human error is impossible to eliminate entirely, well-designed health systems implement organizational features and procedures to minimize medical errors, such as reducing hospital-acquired infections, and providing timely and relevant communication with patients.
Most healthcare-associated infections increased in 2021, particularly ventilator associated infections, but infection rates are now decreasing
Related Content:
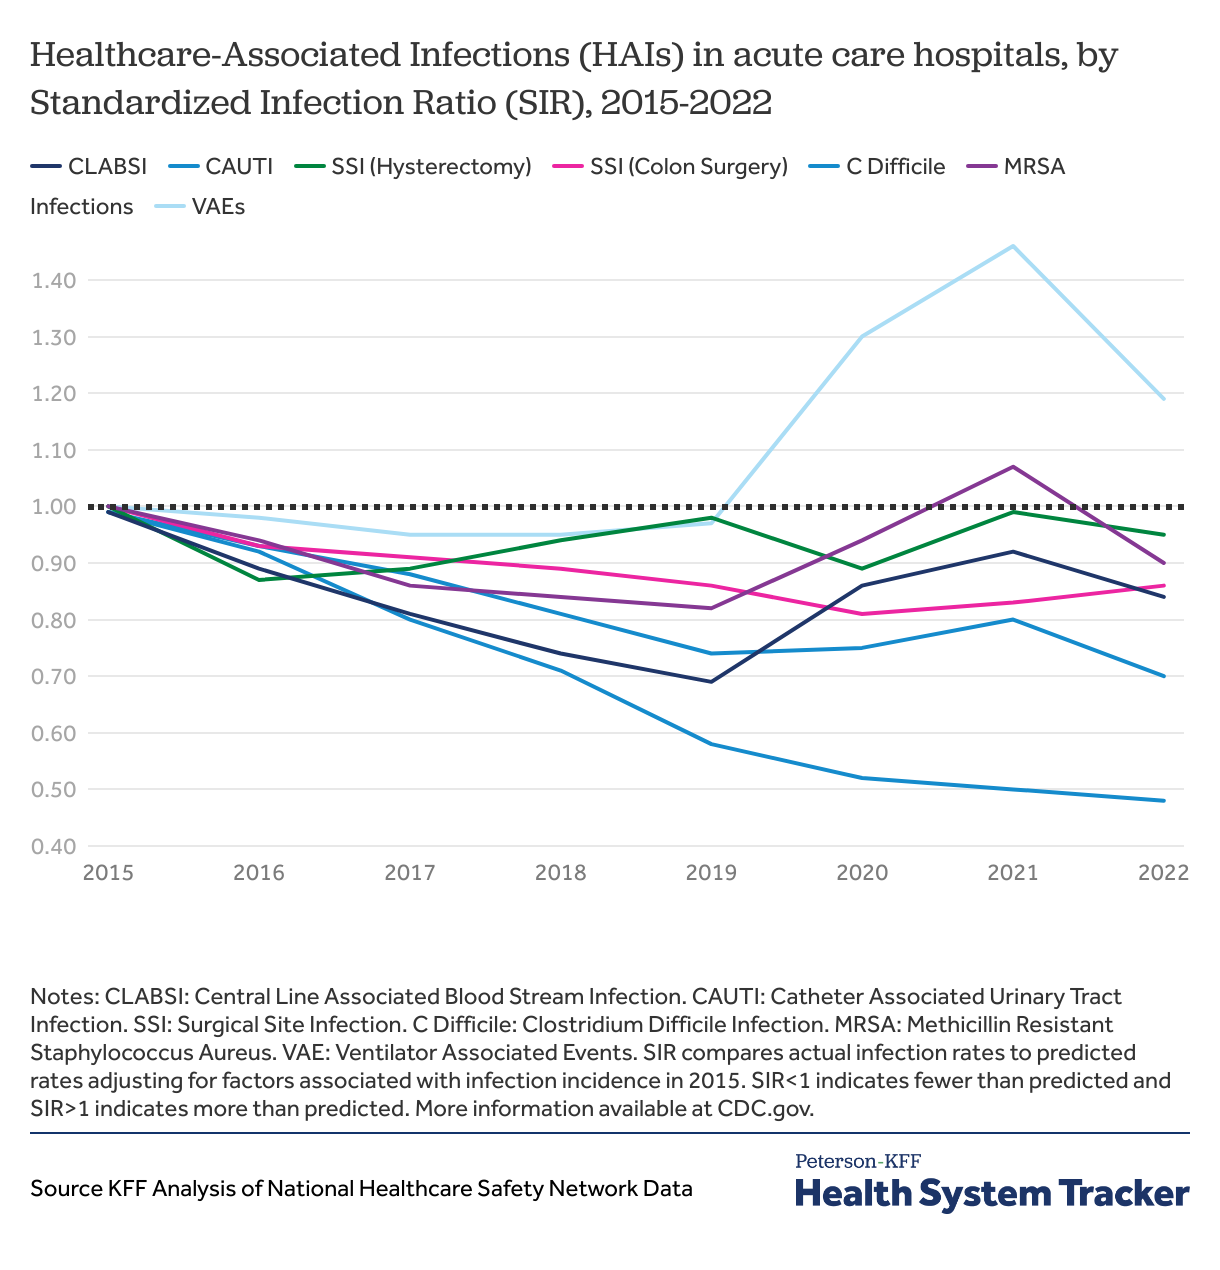
Acute care hospitals in the United States have varying performance regarding hospital-associated infections (HAIs), but most have improved since 2015. The Standardized Infection Ratio (SIR) adjust the hospital infection rate to account for hospital infrastructure and patient acuity, allowing for comparisons between hospitals and over time. Prior to the COVID-19 pandemic, most HAIs were on the decline. However, during the pandemic, rates of catheter associated urinary tract infections (CAUTI), central line associated bloodstream infection (CLABSI), methicillin-resistant Staphylococcus aureus (MRSA) infections increased slightly. Ventilator-associated events (VAEs) increased during the pandemic and have remained high. In contrast, rates of Clostridium difficile infections, a gastrointestinal infection associated with contaminated surfaces, have steadily decreased and remained steady throughout the pandemic.
Effective communication between patients and their healthcare providers is another crucial component of patient safety. This communication can take various forms, including the provision of discharge information, clarification of medications, and responsiveness of hospital staff. In 2022, among Medicare patients, 86% reported that hospital staff “always” communicated well regarding discharge information, 65% regarding hospital staff responsiveness, and 62% regarding medication clarification.
Preventive Services
Preventive services can help avoid negative outcomes associated with preventable and treatable diseases, so high completion rates for these services can be seen as indicators of healthcare quality. Utilization rates of preventive services are commonly calculated quality metrics for primary care providers. The Affordable Care Act (ACA) required insurers to cover a set of evidence-based preventive services without cost to patients. Among people with private insurance, about 6 in 10 receive at least one ACA preventive service in a given year and overall, a minority of patients in the United States receive all recommended preventive services. This care gap was exacerbated by the COVID-19 pandemic, when many people went without routine medical care. The U.S. Preventive Service Task Force provides guidelines on which preventive services are most beneficial, and vaccinations to appropriate populations consistently rank as highly important.
The COVID-19 pandemic triggered a conversation over vaccinations as Americans expressed worry over newly developed vaccines, fueled by misinformation. These concerns spilled over into hesitancy for other vaccinations as well. Routine vaccination rates among kindergarten children in the U.S. are steadily declining, while the number of exemptions from school vaccination requirements is on the rise. The U.S. mounted several large public health campaigns to address these concerns and encourage vaccines for eligible populations but racial and ethnic disparities remain.
Over half of adults receive appropriate cancer screening
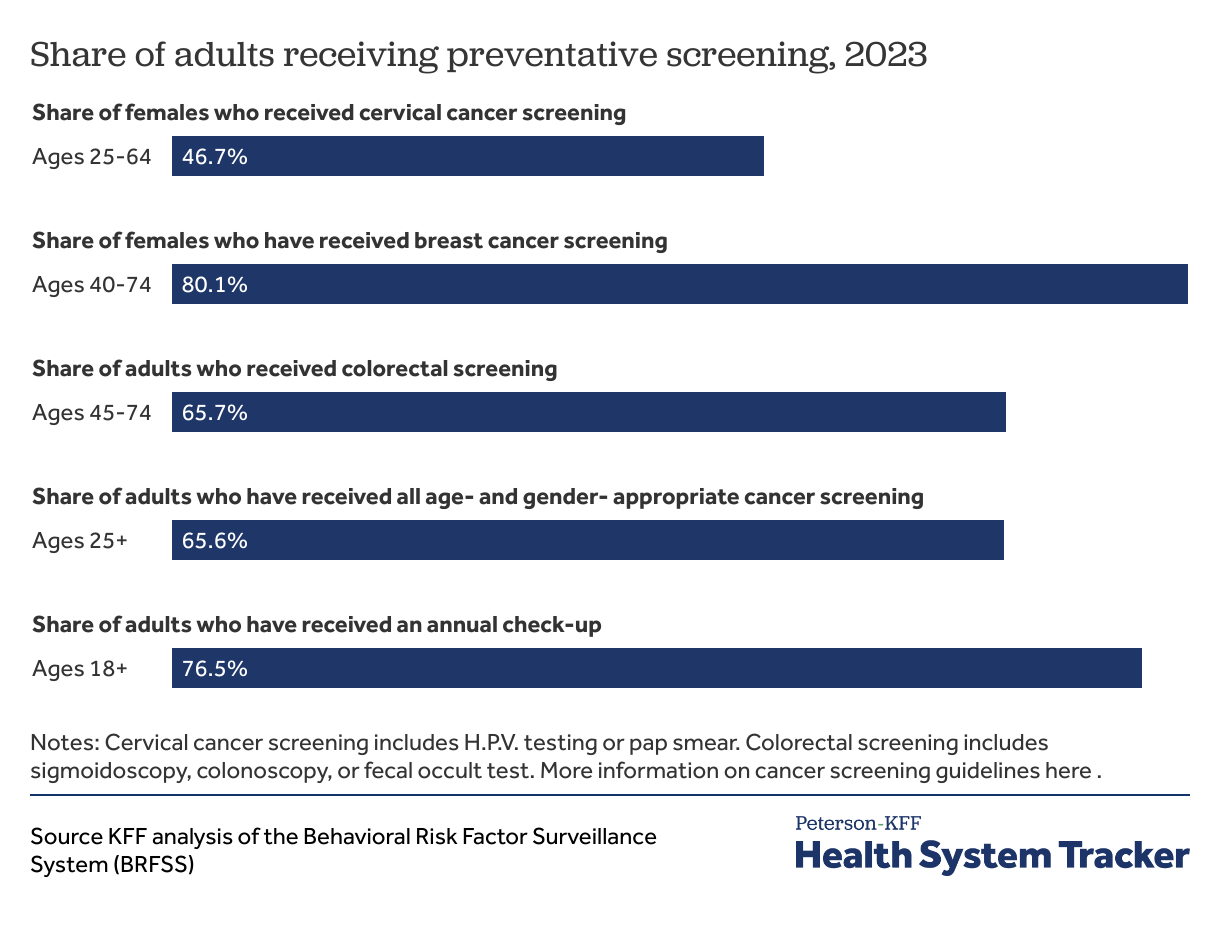
In 2023, 66% of adults reported receiving all age- and gender- appropriate cancer screening. Appropriate preventative screening can detect cancer early, and detect cancer precursors as well, thereby improving outcomes. The American Cancer Society has guidelines for the age and how frequently adults should receive specific cancer screenings.
Rates of flu shots increased during the pandemic but have since slowed and remain far below target levels
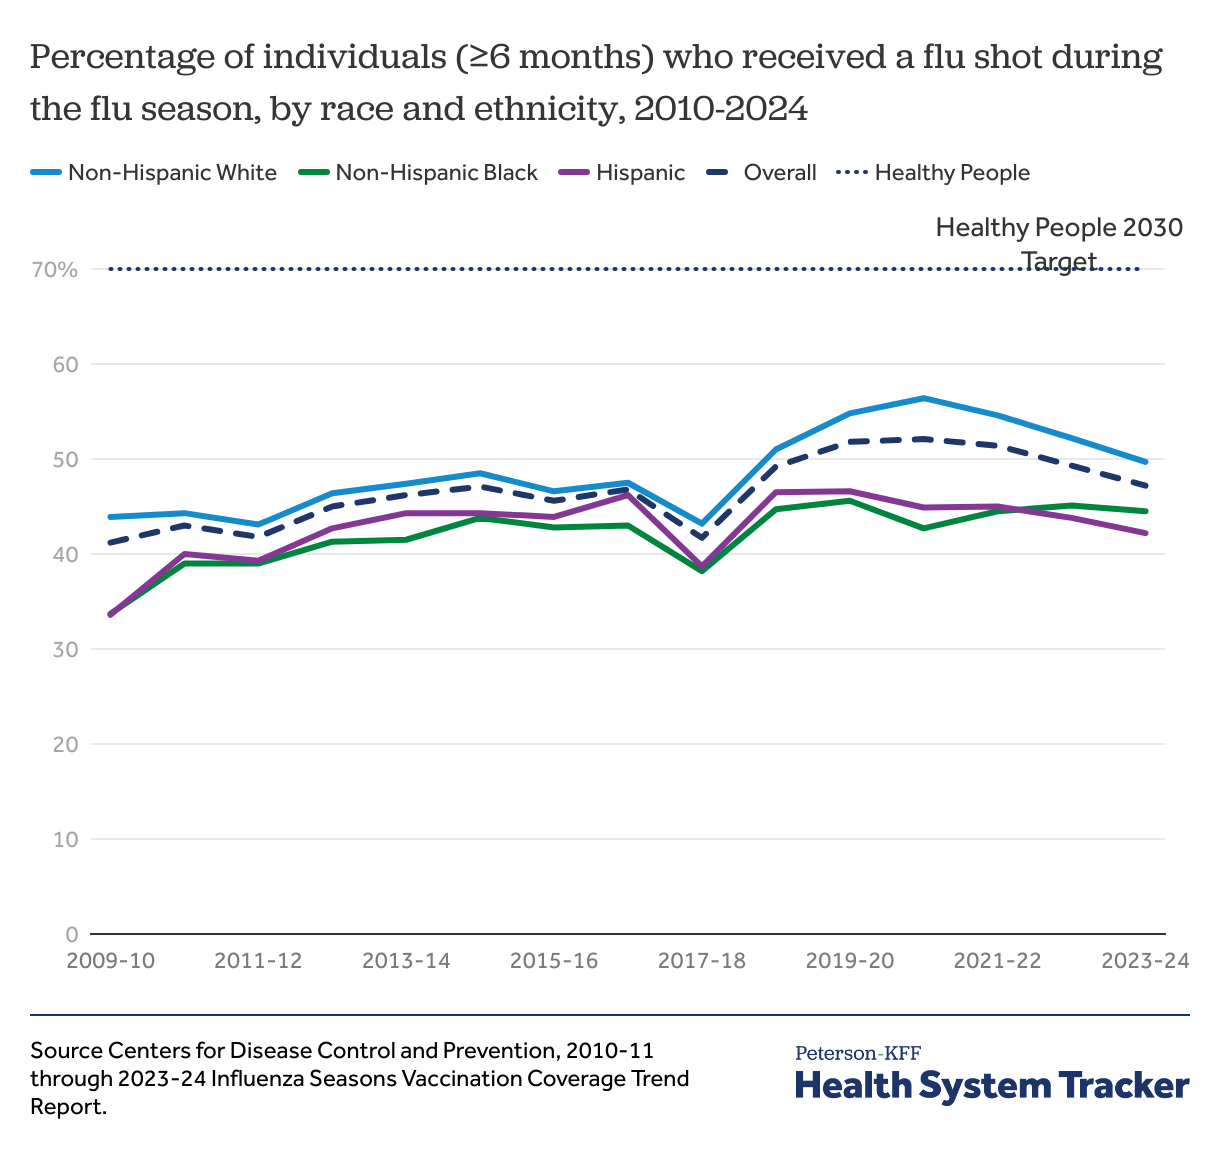
The percentage of adults receiving a flu shot increased from 41.2% in the 2009-10 season to 47.2% during the 2023-24 season. However, gaps in vaccination rates by race and ethnicity exist, only 44.5% of non-Hispanic Black patients and 42.2% of Hispanic patients received flu shots in 2023-24, compared to 49.7% of non-Hispanic White patients. Through the Healthy People initiative, the U.S. Department of Health and Human Services (HHS) established benchmarks for behaviors that promote health and prevent disease, including vaccination. Flu vaccination rates still remain well below the Healthy People 2030 target of 70%.
The percentage of adults over 65 receiving pneumonia vaccines steadily increased from 2014 to 2023, peaking at 74.7% in 2017 before declining to 70.2% in 2023. In 2020, 74% of children received all recommended doses of the 7-vaccine series by 35 months, down from 76% in 2012.
Health System Capacity and Workforce Shortage
Health system capacity metrics measure the ability of a health system to provide timely and appropriate care to those who need it, such measures include infrastructure, available resources, and human capital (such as nurses) available to treat the patient population. Capacity metrics are typically more stable than other quality metrics given the length of time needed to increase resources.
The number of hospital beds per capita are steadily decreasing
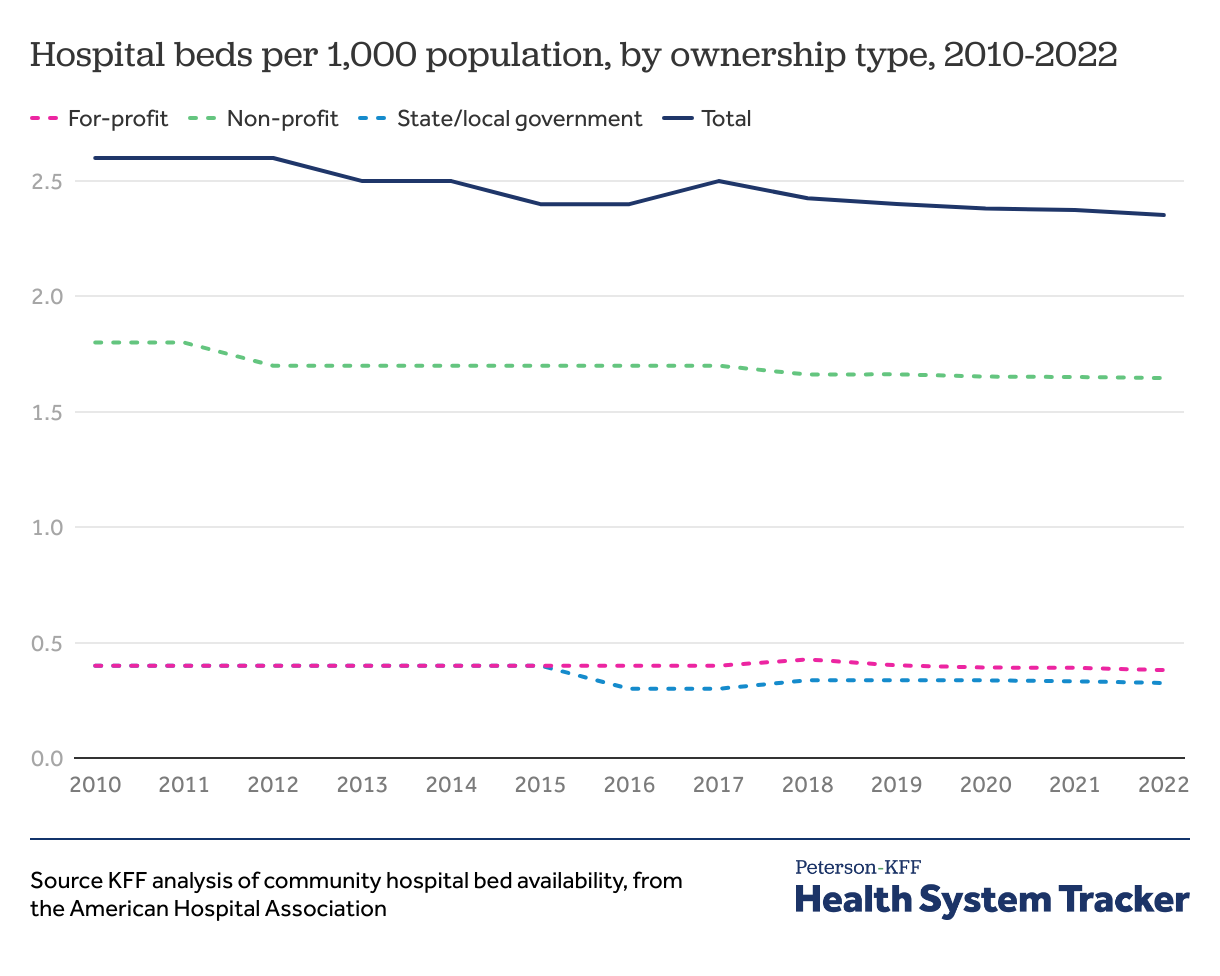
The number of hospital beds per 1,000 people has decreased from 2.6 in 2010 to 2.4 in 2022, driven by a decrease in non-profit hospital beds according to data from the AHA.
KFF analyses of Area Health Resource Files show the number of practicing physicians in the United States increased 4% from 2.3 per 1,000 people in 2000 to 2.7 per 1,000 population in 2022; the number of licensed nurses per 1,000 also increased, from 14.2 in 2000 to 18.6 in 2022. Even with a growing number of health care providers, shortages exist across the United States, with 47% of need met for primary care, 32% for dental care, and 27% of mental health care in 2024. These shortages are reflected in the increased average wait time to schedule a new patient appointment, up to an average of 26 days in 2022.
Provider numbers and growth rates differ by race and ethnicity. Diversity in healthcare is important for improving patient outcomes, promoting equitable care, and fostering a more inclusive and effective health system. From 2019 to 2022, while the number of physicians increased by 4%, the number of Hispanic physicians grew by 19%. The proportion of Hispanic providers remains low compared to the US population, with only 7% of physicians identifying as Hispanic, but constituting 19% of the US population.
Related Content:
The Peterson Center on Healthcare and KFF are partnering to monitor how well the U.S. healthcare system is performing in terms of quality and cost.

