To monitor the performance of the U.S. health system, our Health System Dashboard includes more than 50 indicators across four domains: health spending, quality of care, access & affordability, and health & wellbeing. The dashboard examines trends in the U.S. health system, compares the U.S. to a group of other similarly large and wealthy countries (identified based on median GDP and median GDP per capita), and highlights differences across demographic characteristics. In this brief, we look at the bigger picture of what these data convey about how well the health system is performing, and how the coronavirus pandemic may affect key indicators.
Broadly speaking, health outcomes and quality of care in the U.S. have improved in many areas, although often more slowly than comparable countries and with some recent worsening. In recent years, indicators of longevity and disease burden have worsened in the U.S., partly driven by the opioid crisis. While many comparable countries saw slight declines in life expectancy in 2015, those countries have since rebounded. The U.S. life expectancy rate, however, has plateaued and dropped since 2014. With respect to spending, the rate of health spending growth in the U.S. has recently slowed and is now similar to comparable countries, although the U.S. continues to spend much more on healthcare, both as a percent of GDP and per person. Healthcare access and affordability has continued to improve on gains made under the Affordable Care Act.
Importantly, the coronavirus pandemic and corresponding economic crisis threatens to exacerbate recent declines. While the exact impact is not yet known, effects from the crises may worsen health outcomes and disparities, increase the uninsured rate in the U.S., and lower life expectancy.
Based on data available through 2018 or earlier years, the following findings highlight recent trends across 10 key indicators of health system performance and outline potential effects of the pandemic and economic downturn. Visit the Health System Dashboard for more in-depth exploration of these and other telling analyses.
HEALTH & WELLBEING
Related Content:
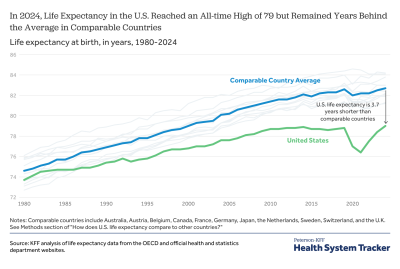
1. Life expectancy at birth generally improved over the past several decades in the U.S., rising by 4.9 years since 1980. However, life expectancy has declined slightly in recent years, driven by increased mortality rates for certain causes, including drug overdoses and suicides. Furthermore, comparable countries have an average life expectancy of 82.3 years – nearly four years longer than the U.S. life expectancy of 78.6 years – and the gap is growing. The COVID-19 pandemic is ongoing, and although its full impact will take time to assess, the death toll could reduce average life expectancy in the U.S. and other countries. Additionally, the pandemic has exacerbated inequalities underlying long-standing health disparities, and it has thus disproportionately affected Black, American Indian and Alaska Native, and Hispanic communities. Any impact it has on life expectancy may be more pronounced among these groups.
2. Disease burden, a measure that accounts for both longevity and quality of life, has improved over the past quarter century, dropping 12% between 1990 and 2017, with particular improvement for circulatory diseases. However, in the past few years the disease burden rate has worsened in the U.S. (driven by substance use disorders and an uptick in injuries) while continuing to improve in similar countries. As of 2017, disease burden was higher in the U.S. than in any other comparable country. Importantly, the U.S. has relatively high rates of disease burden attributable to some of the health conditions that put people at high risk of serious illness from COVID-19: cardiovascular diseases, chronic respiratory diseases, and diabetes. Though data are not yet available, the pandemic is likely to increase disease burden in all countries as more people contract the virus.
QUALITY OF CARE
3. Despite some progress, the U.S. continues to lag behind comparable countries in preventing deaths that in many cases could have been averted by timely and effective healthcare. The Healthcare Quality and Access (HAQ) Index reflects the rate of deaths amenable to healthcare with a score from zero (lower quality) to 100 (higher quality). The U.S. has an HAQ Index rating of 88.7, ranking the lowest among comparable countries (average a score of 93.7). Although the U.S. has made progress in reducing deaths amenable to healthcare, this improvement has not kept pace with similar countries. The COVID-19 pandemic has overburdened hospitals in certain parts of the U.S. and several other countries, which will make it more difficult for some patients to access timely care and, as a result, potentially worsen the rate of deaths amenable to healthcare.
4. Compared to the average of comparable countries, potentially preventable hospital admissions rates are higher in the U.S. for several diseases that could possibly be prevented or treated in a non-emergency setting, including for congestive heart failure (88% higher), asthma (8% higher), and diabetes (53% higher). Hypertension is an exception, as U.S. admission rates are 12% lower than the comparable country average. While the U.S. rate of potentially preventable hospital admissions has improved over the time (decreasing 32% from 2000 to 2015), hospitalizations from COVID-19 may outweigh these gains. Additionally, the pandemic may limit access and use of preventive care that helps reduce hospital admissions.
5. The occurrence of hospital-acquired conditions (e.g., surgical infections or medication errors) has improved, declining 13% from 2014 to 2017. It is not clear if the pandemic will impact the rate of hospital-acquired conditions. However, the new coronavirus currently poses an infection risk for both hospital patients and staff, particularly if there is limited availability of personal protective equipment.
ACCESS & AFFORDABILITY
6. Due to gains in health coverage as a result of the Affordable Care Act, the uninsured rate among the nonelderly dropped from 18% in 2010 to 11% in 2018. Even with about 90% of the total U.S. population now insured and with coverage trending upward prior to the pandemic, the U.S. coverage rate is lowest among comparable countries, most of which have universal coverage. Further, the U.S. uninsured rate may rise as people lose employer-based coverage because of the pandemic and associated economic downturn.
7. Fewer adults are reporting problems paying medical bills. From 2011 to 2018, the share of people reporting difficulty paying medical bills dropped by more than a quarter. However, medical bills remain a top concern for many Americans, and this could worsen with the pandemic. Recent legislation made COVID-19 testing free at the point of service, and many insurers initially waived cost sharing for COVID-19 treatment, making it an option for self-insured employers (who cover most people with employer-based coverage) to offer the benefit. However, some of these insurers stopped waiving cost sharing for COVID-19 treatment in June. Additionally, the Department of Health and Human Services indicated it intends to cover uncompensated COVID-19 care for uninsured patients through the Coronavirus Aid, Relief, and Economic Security (CARES) Act Provider Relief Fund. Nonetheless, individuals – specifically those who are uninsured – may still face unaffordable medical bills for any treatment they receive. KFF analysis has found that the total cost of an inpatient admission for severe COVID-19 could be over $88,000 in the large employer market, and that out-of-pocket costs for these enrollees could exceed $1,300.
8. While the share of adults delaying or foregoing needed care due to costs dropped 4 percentage points from 2009 to 2017, there was a small increase from 2017 to 2018. COVID-19 may portend additional increases if there are widespread barriers to accessing testing and treatment for COVID-19. Additionally, greater job or income loss will create more strained financial resources for many individuals and families.
HEALTH SPENDING
9. Health spending per person has grown steeply from $355 per capita in 1970 to $11,172 in 2018. On average, other wealthy countries spend less than half as much per person. This spending differential is primarily because of higher prices for healthcare in the U.S., as utilization is similar – and in some cases lower – in the U.S. For the last decade though, per capita spending in the U.S. has grown at an average rate of 3.6% per year, which is similar to that of comparable countries. It is unclear how the COVID-19 pandemic will affect health spending overall. While the costs of care related to the pandemic will be high, the pandemic has also resulted in widespread cancellation or postponement of regularly scheduled treatments, such as elective procedures, preventive care, and other non-urgent care. These delays and cancellations have a downward effect on total health spending that may offset at least some of the high cost of treating patients with COVID-19.
10. Health spending has historically grown faster than the economy, but the difference has moderated in recent years. U.S. health consumption expenditures accounted for 17.7% of GDP in 2018 – much more than comparable countries, where health spending averages 10.4% of GDP. Both GDP and health spending will likely change because of the pandemic. People also tend to use less healthcare during times of economic downturn, resulting in slower health spending growth.
DISPARITIES IN HEALTH SYSTEM PERFORMANCE
Although there is general improvement across many indicators, there are often disparities across racial or ethnic groups, genders, age, health status, and income levels. In 2017, while life expectancy among White people in the U.S. was similar to the national average of 78.6 years, life expectancy was 3.7 years shorter than average among Black people and 3.2 years longer among Hispanic people. In 2018, 15.4% of all non-elderly adults reported difficulty paying medical bills, with a substantial gap between lower- and higher-income adults: 23.3% of those who earn below 200% of the Federal Poverty Level reported difficulty paying medical bills, compared to 11.6% of those earning 200% FPL and above. Where possible, dashboard data are broken out across demographic groups to highlight these disparities. These and other health disparities may very well worsen due to the pandemic. COVID-19 and the economic downturn has disproportionately impacted Black, American Indian and Alaska Native, Hispanic, and low-income people in the U.S.
Some cross-national differences in health outcomes and costs may be due to a variety of social, economic, and environmental factors that influence health and are not solely or directly influenced by the health system. The dashboard, therefore, also includes indicators relating to health determinants to offer context, and a separate chart collection and brief explore social determinants of health in the U.S. and comparable countries in more detail.
The dashboard is a starting point for exploring unfolding trends, and it is important to keep in mind that not all indicators will change at the same pace, particularly with so many unknowns surrounding the current pandemic and economic crisis. Visit the Health System Dashboard for a more in-depth exploration of these other telling trends.
Methods
Where possible, we compare the U.S. to other similarly large and wealthy countries as measured by median GDP and median GDP per capita. These countries are: Australia, Austria, Belgium, Canada, France, Germany, Japan, the Netherlands, Sweden, Switzerland, and the United Kingdom.
Data were collected and analyzed by researchers at KFF using a variety of data sources (which can be found for specific indicators in the indicator page on the dashboard). The dashboard includes more than 50 indicators of health system performance, organized into four domains – a structure based largely on the framework put forth in the National Academy of Medicine’s 2015 Vital Signs: Core Metrics for Health and Health Care Progress. Indicators on the dashboard were selected through consultation with other experts in the field and a review of various additional sources of data on quality and outcomes measurement, including (among others): National Quality Forum; Healthcare Effectiveness Data and Information Set (HEDIS); Consumer Assessment of Healthcare Providers and Systems (CAHPS); America’s Health Rankings; Medicare Access and CHIP Reauthorization Act of 2015 (MACRA); CMS Hospital Compare; US News and World Report; America’s Health Insurance Plans (AHIP)/CMS Core Quality Measures Collaborative; Commonwealth Fund; as well as a review of sources for data on health spending, such as the Bureau of Economic Analysis (BEA), National Health Expenditure Accounts (NHEA), and the Medical Expenditure Panel Survey (MEPS). The Healthcare Quality and Access (HAQ) Index is a metric developed by the Institute for Health Metrics and Evaluation and based on the Global Burden of Disease (GBD) study.
The dashboard is limited to some extent by what data are available at the health system level, particularly for indicators of health system quality (see our in-depth discussion here). While health spending, access, and health status data are more readily available and standardized, some indicators of quality of care are less standardized and often only available nationally for the Medicare population. The quality measures included in the dashboard were selected through consultation with a number of experts in the field and present a comprehensive look at treatment outcomes, patient safety, appropriateness of treatments, use of preventive services, and the resources of the health system.
The Peterson Center on Healthcare and KFF are partnering to monitor how well the U.S. healthcare system is performing in terms of quality and cost.