Early in the COVID-19 pandemic, many outpatient visits and elective hospitalizations were delayed, avoided, or cancelled, leading to a sharp decline in healthcare utilization. However, there have been expectations that there will be pent-up demand for this missed care.
In this chart collection, using a variety of data sources, we look at the latest available data on how health services utilization has changed over the course of the pandemic. We find that, as of mid-to-late 2022, utilization of healthcare is generally rebounding, but some of that use is likely for COVID-related treatment, testing, or vaccination, making it difficult to assess how non-COVID care compares to the amount of care people received pre-pandemic. It is likely that utilization of some services, particularly for non-COVID care, remains below expectations based on pre-pandemic trends.
As of mid-2022, healthcare utilization has rebounded from the beginning of the pandemic but in some cases may still remain below pre-pandemic levels Share on XIn 2021, about 1 in 5 adults missed or delayed medical care due to the pandemic
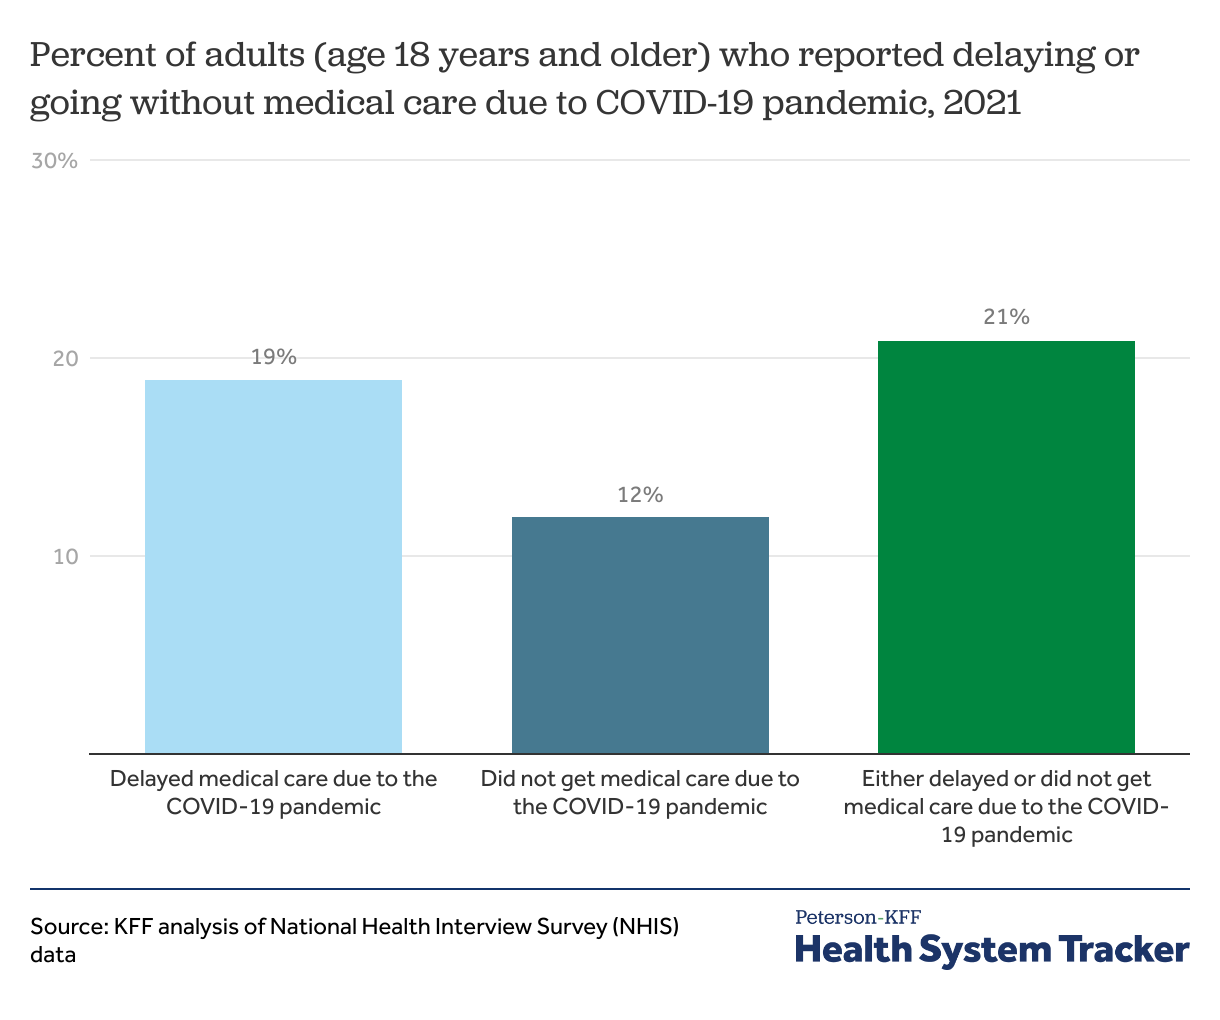
There was a sharp drop in utilization in 2020, particularly during the earliest months of the pandemic. Even in 2021, as vaccines became available, about one in five people ages 18 years and older (21%) reported delaying or foregoing medical care due to the COVID-19 pandemic.
This chart and other charts below that use NHIS data are based on survey questions that specify missed or delayed “medical care.” There are other NHIS questions about missed or delayed prescriptions and metal health care due to costs, but the survey does not ask whether the pandemic was a reason for these delays, so we limit our analysis here to missed or delayed medical care. Additionally, NHIS sometimes asks about missed or delayed dental care due to cost, but the survey did not include this question in 2021.
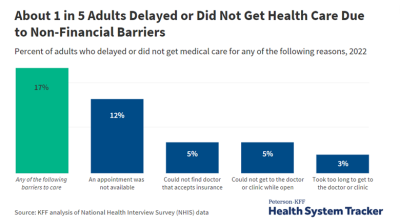
Both the pandemic and healthcare costs were significant barriers to medical care in 2021
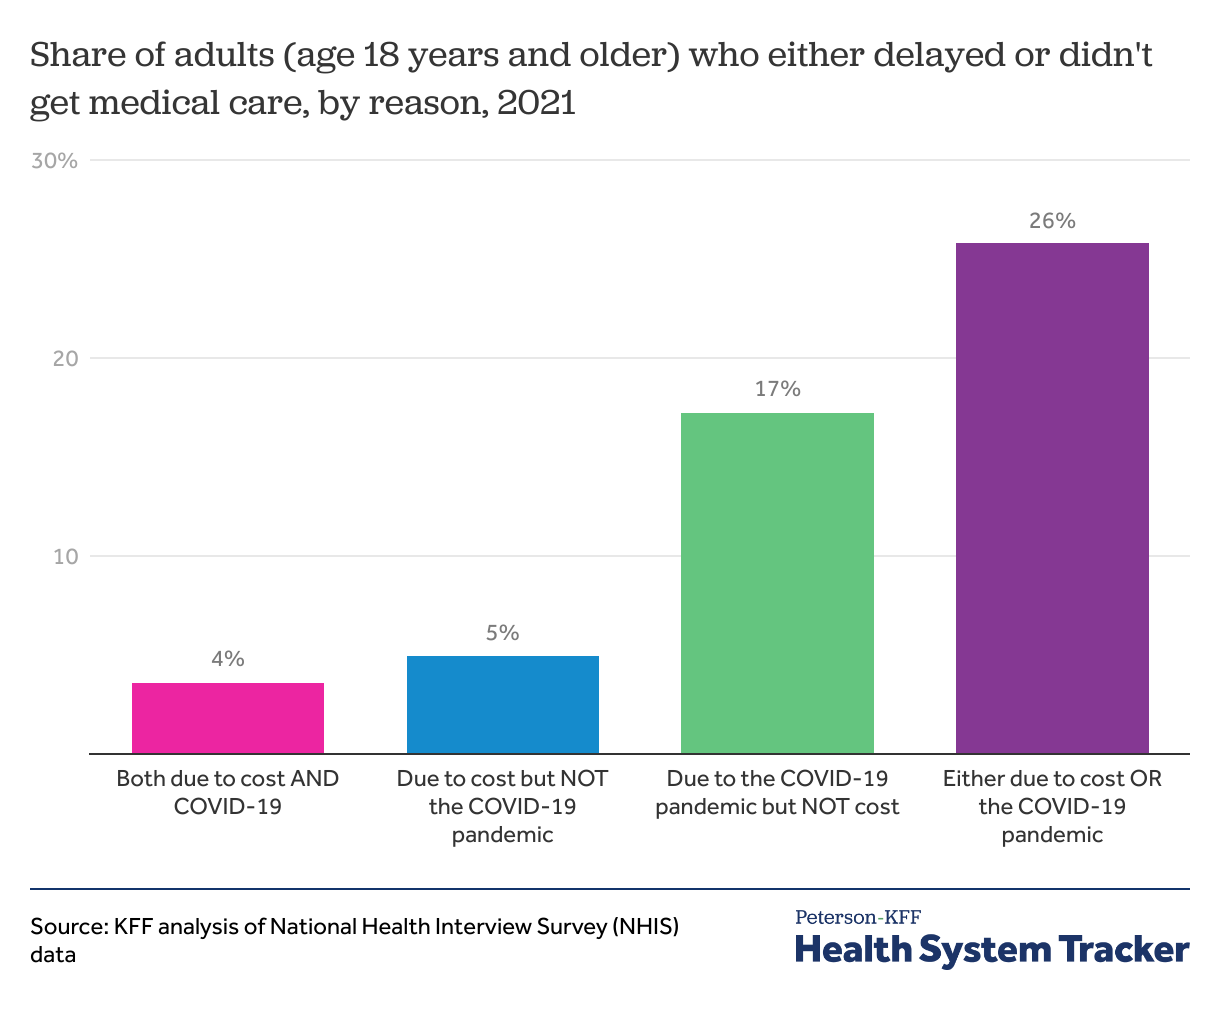
In 2021, one in four adults (26%) missed or delayed medical care due to either the COVID-19 pandemic or healthcare costs.
We find that 4% of adults in the U.S. missed or delayed medical care due to both costs and the pandemic in 2021. Meanwhile, 17% of adults reported missing or delaying care due to the pandemic but not costs, and 5% reported missing or delaying medical care due to costs but not the pandemic.
In addition to costs and the pandemic, there could be additional reasons for missed or delayed care, such as an inability to take time off of work, a lack of transportation, or a lack of available appointments.
Cost has remained a barrier to medical care into mid-2022
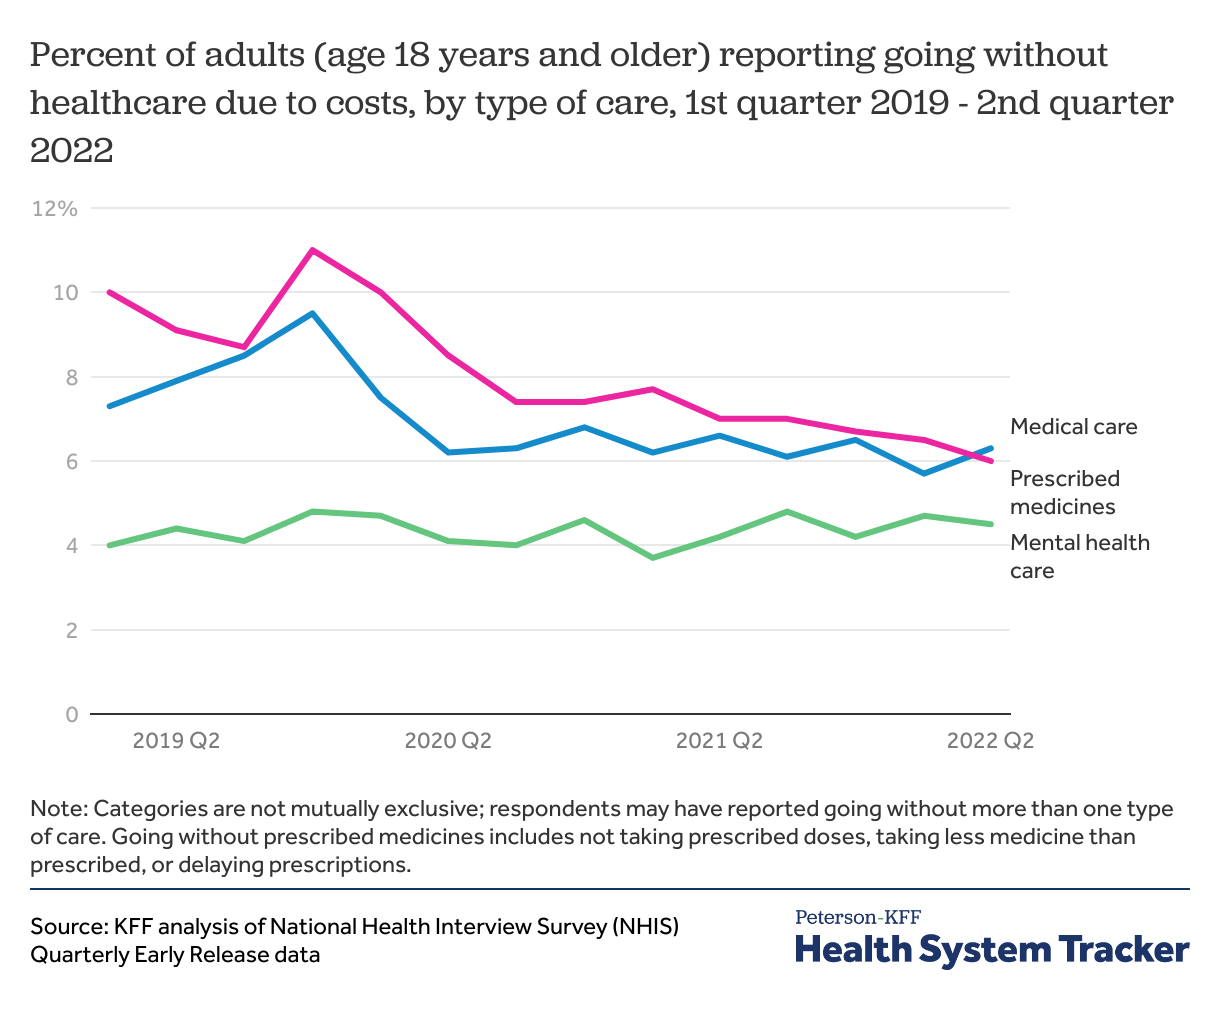
NHIS publishes quarterly updates to the rates of cost-related access barriers, but similar quarterly updates are not available for pandemic-related barriers. Cost-related access barriers rose in the early pandemic, likely associated with rising unemployment and resulting income instability, as well as disruption in health coverage. The rates of reported cost barriers have since declined somewhat in recent quarters, even as inflation puts strain on household budgets. The uninsured rate is currently at a record low, and Medicaid and ACA Marketplace enrollment are at record highs. Medicaid generally has little to no cost-sharing, and enhanced subsidies in the ACA Marketplaces may have helped enrollees afford health plans with lower deductibles.
However, there are other factors to consider. While the share of adults who reported delaying or not getting care due to cost reasons decreased from 2019 to 2021, part of this trend might be because COVID-19 presented another reason care was delayed or foregone. It is difficult to tease apart the various reasons one might not get the care they need. There is also variation across demographic groups in rates of cost-related access barriers (discussed more below). Additionally, as pandemic-era Medicaid continuous coverage ends and dis-enrollments resume, there will likely be an uptick in the uninsured rate, which could result in increases in cost-related barriers to care. Our earlier work has shown that many households lack the liquid assets needed to afford out-of-pocket expenses typical in private health plans. KFF polling has consistently shown the difficult decisions families make in juggling costs for essentials like housing, food, and healthcare.
Hospital discharges have increased recently but remain below pre-pandemic levels
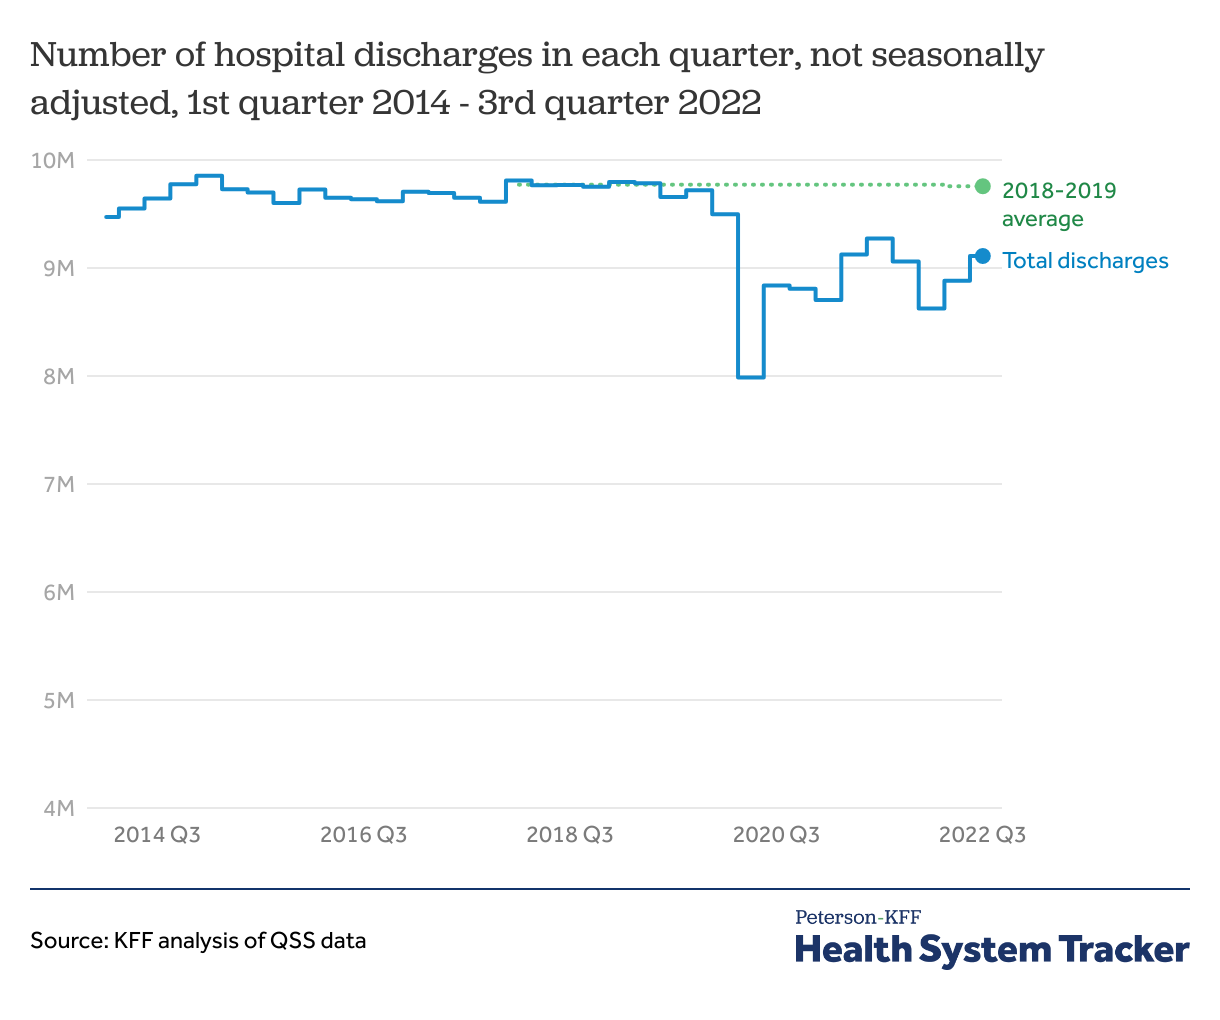
The number of hospital discharges in the third quarter of 2022 remained below the average quarterly discharges in prior years. Quarterly hospital discharges in 2018-2019 averaged 9.8 million. Since the beginning of the COVID-19 pandemic, total discharges in a quarter peaked in the third quarter of 2021 at 9.3 million, 500,000 discharges below the pre-pandemic quarterly average in 2018-2019. Despite increases in discharges through the end of 2021, there was a drop in discharges in the first quarter of 2022 compared to both the first quarter of 2021 and the previous quarter. Total discharges in the third quarter of 2022 were 9.1 million, about 700,000 discharges below the pre-pandemic quarterly average in 2018-2019.
Nevertheless, there may still be strain on hospital resources in part because the average length of stay is increasing. Additionally, until recently, hospital employment had remained below pre-pandemic levels.
While COVID-19 hospital admissions have increased during this most recent winter wave of infections, the level of admissions is well short of what we saw a year ago. As the virus continues to mutate, the future course of the pandemic, and what it means for health utilization and spending, is quite uncertain.
The share of adults with a doctor visit in the past year dipped early in the pandemic and remains somewhat below early 2019 levels
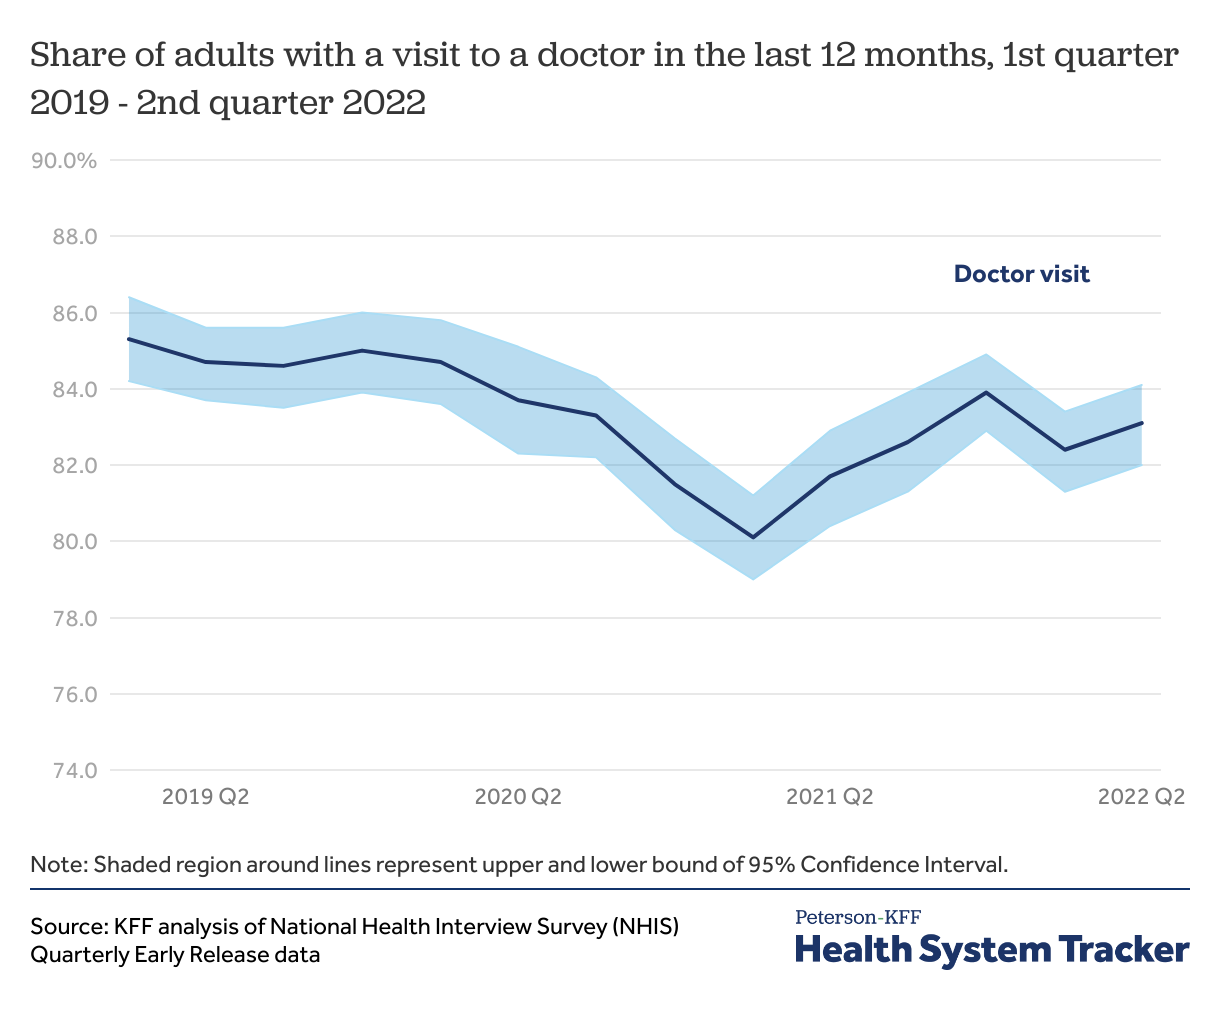
The National Health Interview Survey (NHIS) early release estimates provide a look at how visits to doctor’s offices and hospital emergency departments have changed from 2019 through mid-2022. Because the survey asks about utilization in the past year, though, it may mask volatility in utilization from month to month.
The share of adults with a doctor visit in the last year has recovered but has not reached early 2019 levels. In the first quarter of 2019, 85.3% of adults reported going to a doctor in the previous 12 months. The share of adults who had a doctor visit decreased in 2020 and reached the lowest level in the first quarter of 2021 with 80.1% of adults having seen a doctor in the prior year. In the most recent quarter with available data, the second quarter of 2022, 83.1% of adults saw a doctor in the past year.
Related Content:
Similarly, the share of adults with a visit to an emergency department fell in mid-2020 and remains below pre-pandemic levels
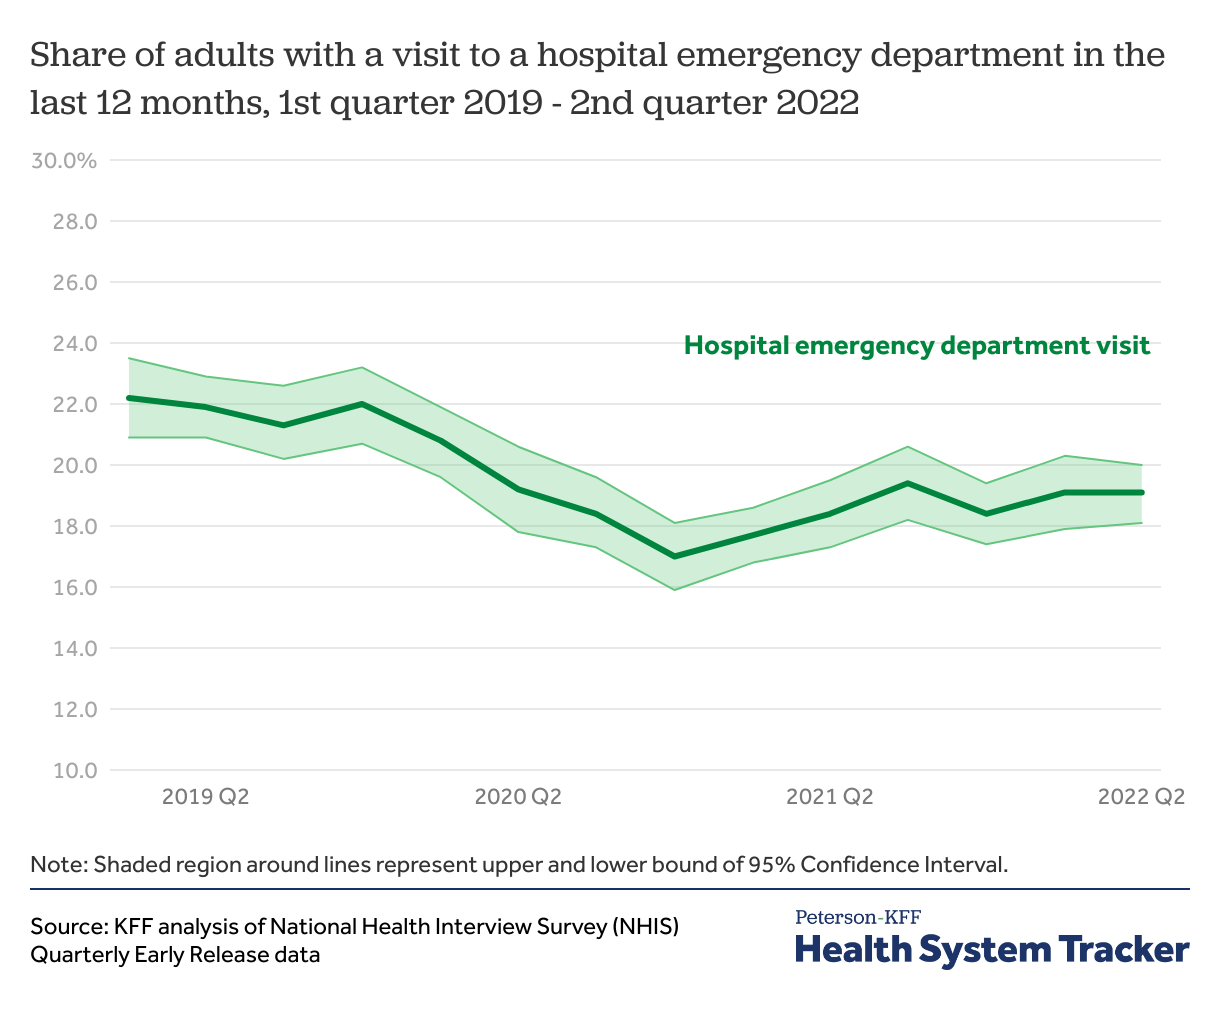
Like physician care, utilization of emergency care appears to be somewhat below pre-pandemic levels, especially considering that an unknown share of current emergency care is due to COVID-19. The share of adults reporting an emergency department visit in the previous 12 months dropped from 22.2% in the first quarter of 2019 to 17.0% in the fourth quarter of 2020. The share of adults reporting a visit to an emergency department in the past year has since rebounded but remains below early 2019 levels. Emergency department visits in the past year rebounded to 19.4% in the third quarter of 2021 and were at 19.1% in the most recent quarter (second quarter of 2022).
The number of physician visits per person is rebounding
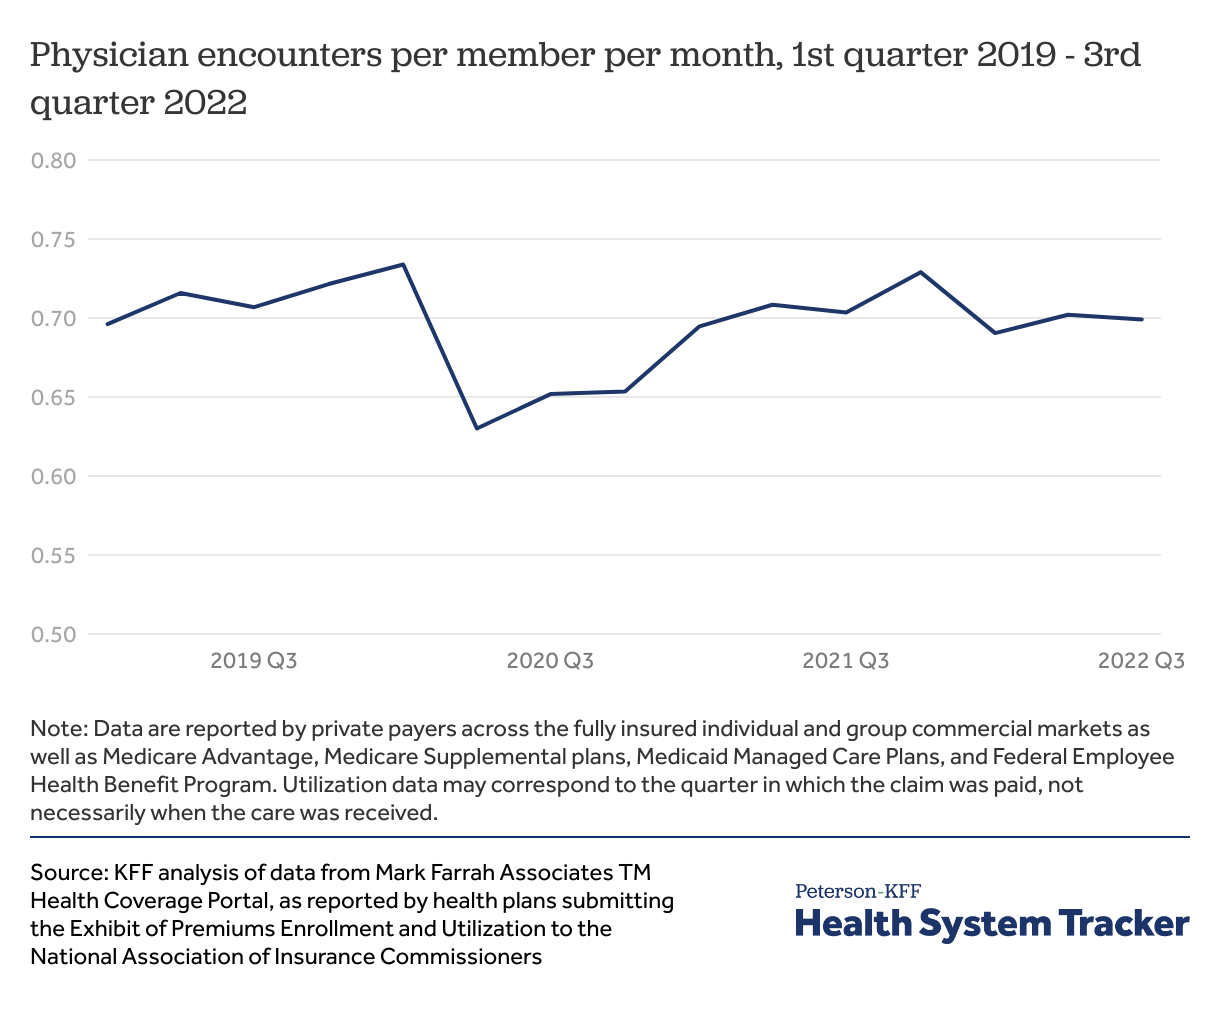
Using data private insurers report to the National Association of Insurance Commissioners, it appears the number of physician encounters per person has mostly rebounded to pre-pandemic levels. These data have some limitations, though. For example, an unknown share of current visits is for COVID-related care (treatment, vaccination, and testing), so it is likely that non-COVID care is still below pre-pandemic levels. Additionally, although the data represent people enrolled across a variety of markets (including fully insured individual and group, as well as privately administered public coverage), the chart above does not include traditional Medicare without supplemental coverage, state-administered Medicaid, or self-insured employers, which combined represent a significant share of the U.S. population.
Health service utilization increased in 2021 after a drastic decline in 2020, when many people went without care
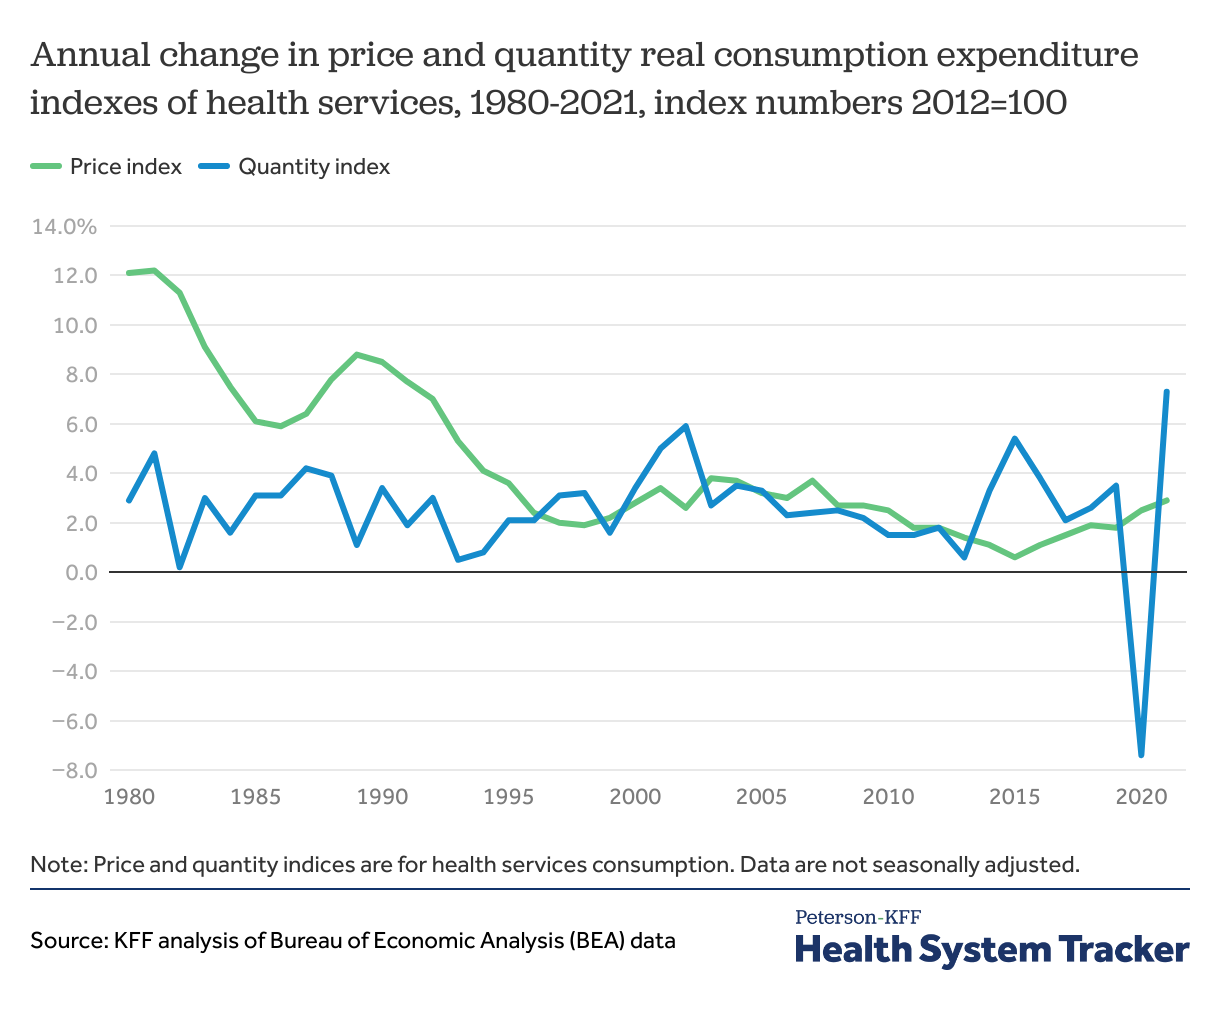
Another way to look at utilization trends is to use quantity indices from the Bureau of Economic Analysis (BEA). In 2021, healthcare prices increased by 2.9%, in line with previous years, but health services use increased by 7.3% relative to 2020. This increase in healthcare use in 2021 followed a sharp decrease in health utilization in 2020, largely driven by the COVID-19 pandemic, as many health services, such as elective procedures and routine care, were postponed or cancelled.
Use of pharmaceutical products continued to grow during the pandemic at similar rates as before
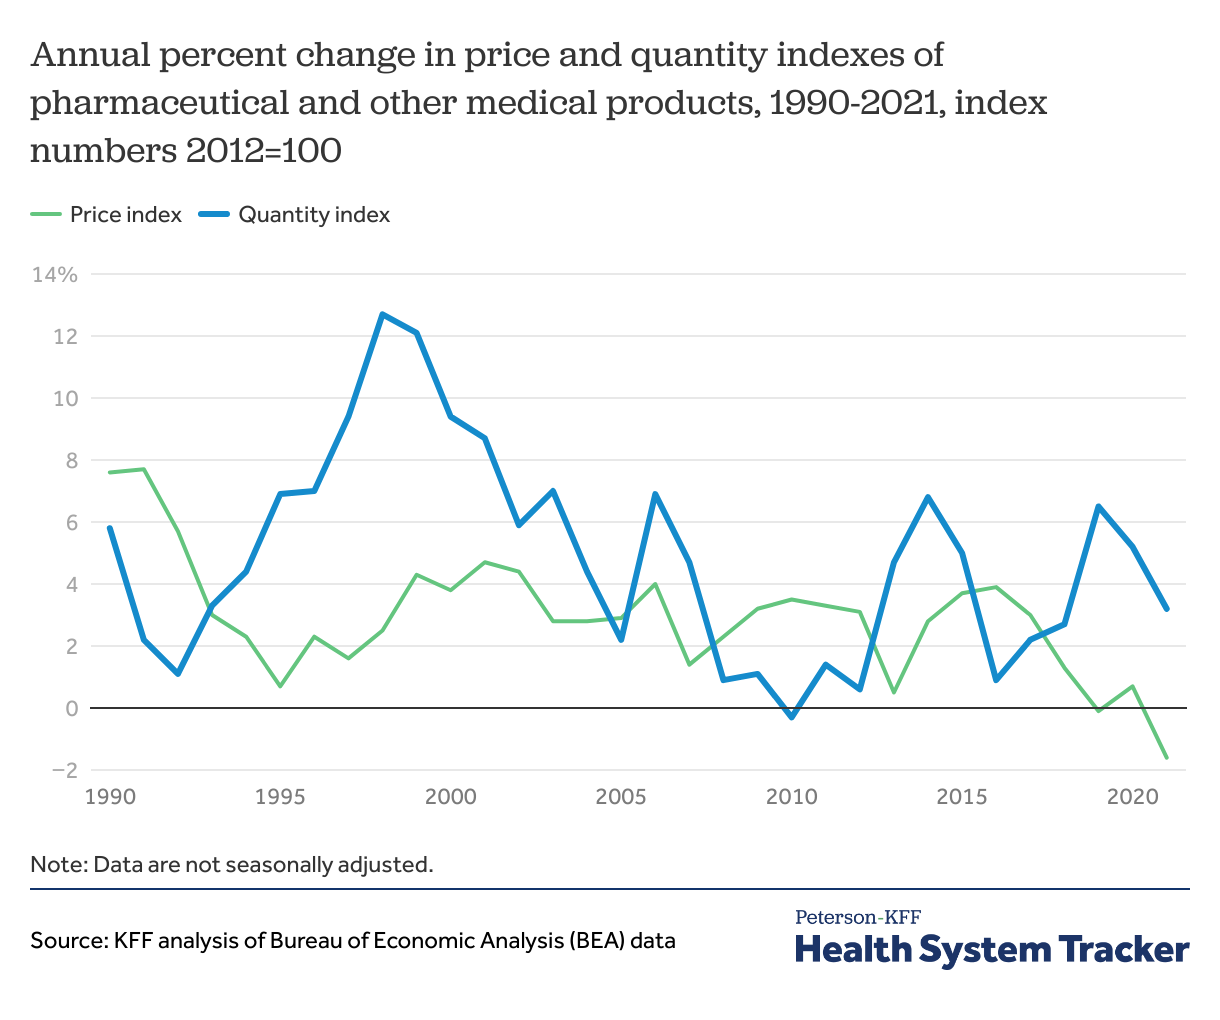
While the price index for drugs grew steadily since 2010 (ranging in growth from about 0.5% to 3.9% annually), it decreased by 1.6% between 2020 and 2021, following a 0.7% increase between 2019 and 2020. The utilization index, which has been more volatile year to year, increased 5.2% in 2020 over the previous year.
Unlike health services, pharmaceutical product utilization grew in 2020 over the previous year and the 2021 annual growth rate was similar to the rate seen in recent decades. This is likely in part due to many people stockpiling needed medications early in the pandemic when lockdowns were announced. Additionally, with local delivery or mail-in pharmacies, many people were likely able to continue filling retail prescription drugs with limited interactions and risk of spreading COVID-19. Though new prescriptions likely declined with fewer doctor visits.
Across all race and ethnicity groups, more adults reported delaying or foregoing care due to the pandemic than due to cost in 2021
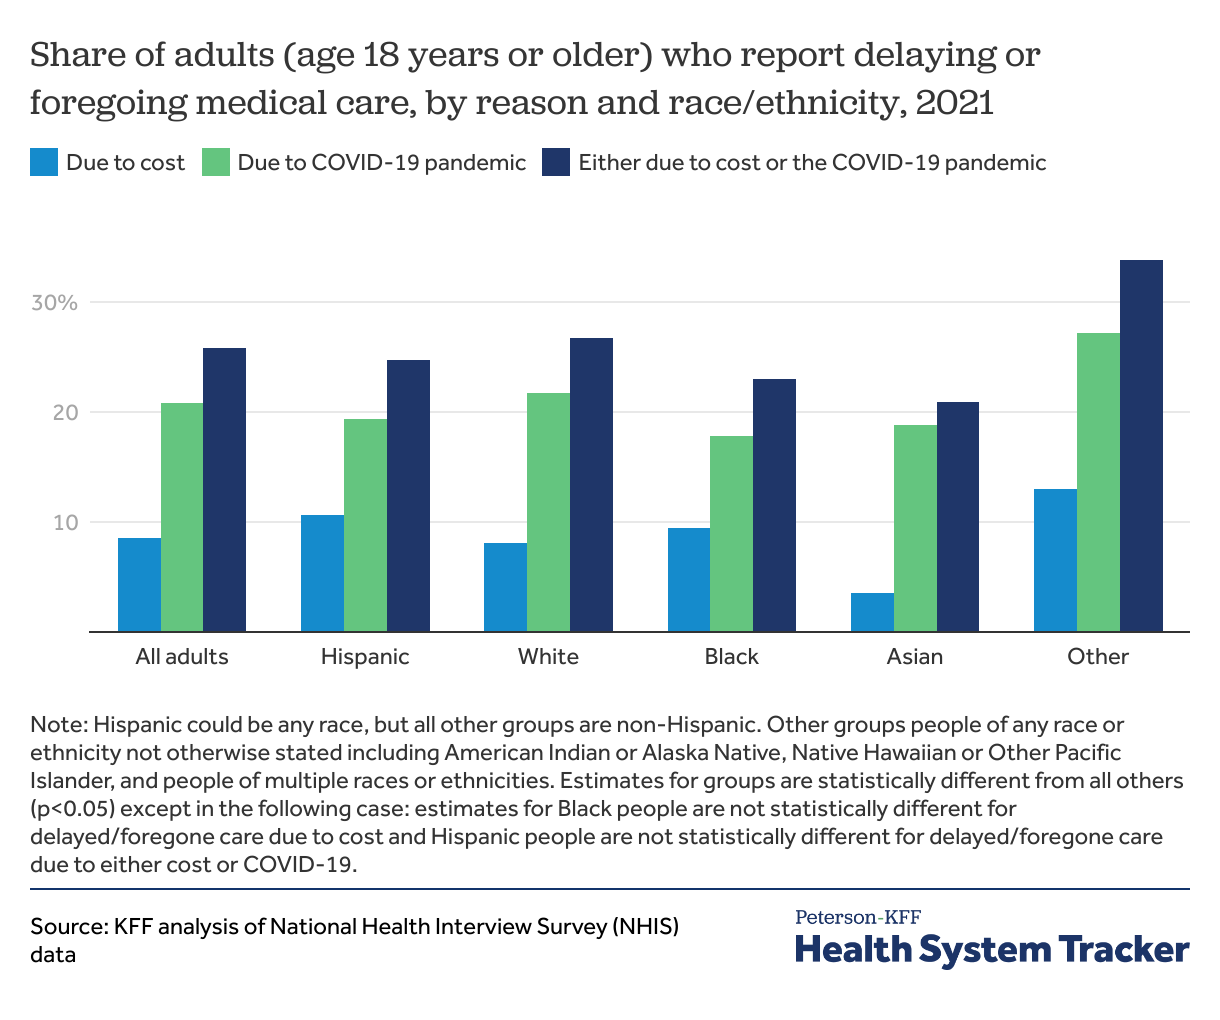
In 2021, the cost of care and the COVID-19 pandemic contributed to people delaying or foregoing care. Across all race and ethnicity groups, the COVID-19 pandemic was a more prevalent reason for delaying or foregoing care compared to cost. Asian adults had the lowest share of individuals who reported delaying care due to cost (4%), while those who were a part of an Other racial or ethnic group reported the highest share of adults who delayed or foregone care due to cost (13%).
Black adults had the lowest share of people who delayed or foregone care due to COVID-19 (18%). Adults who were a part of an Other racial or ethnic group also had the highest share of individuals who delayed or foregone care due to the COVID-19 pandemic (27%).
Only uninsured adults reported delaying or foregoing care due to cost more than delaying care due to the COVID-19 pandemic
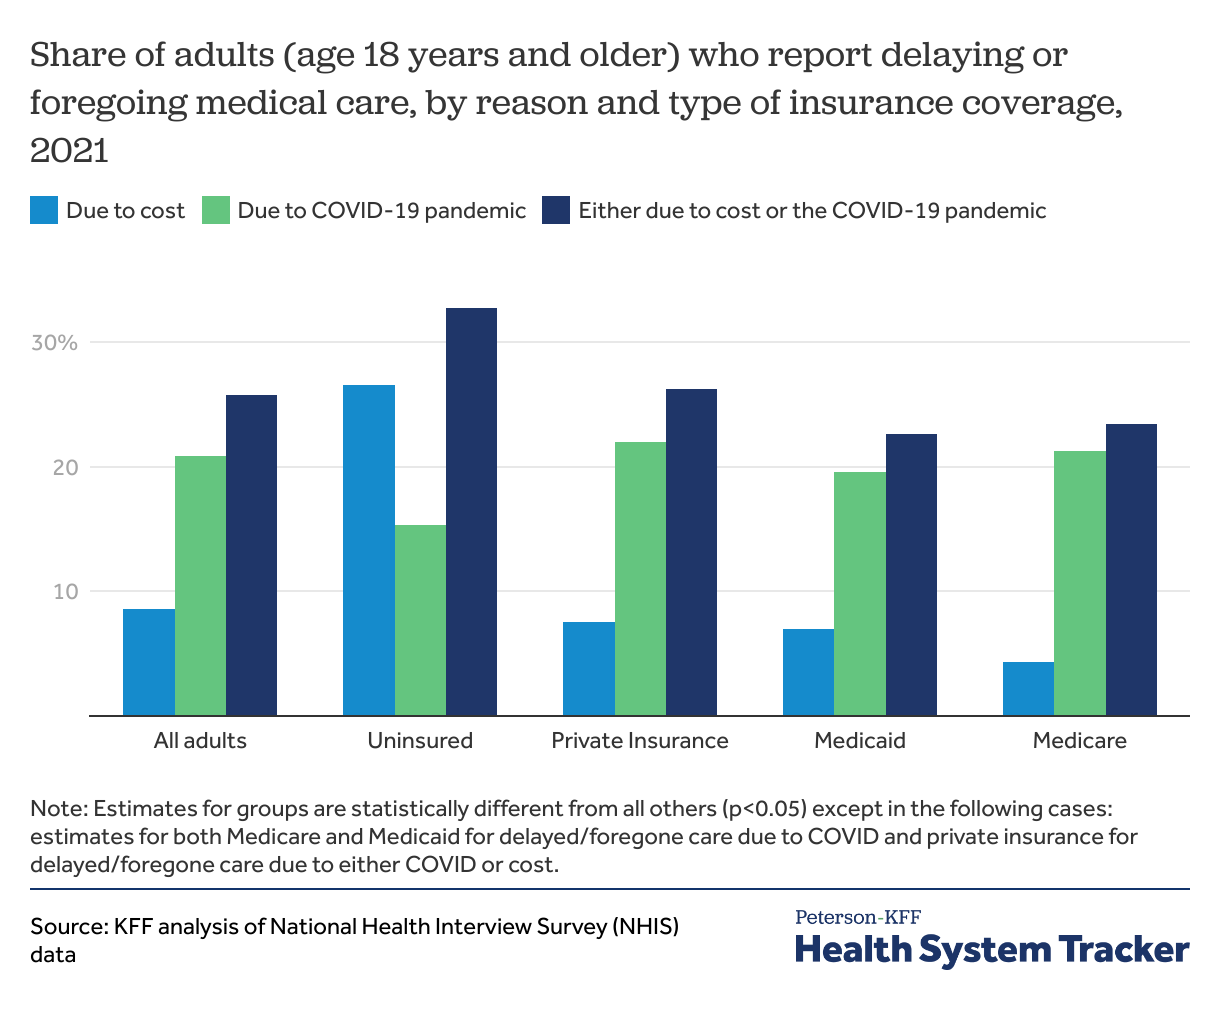
Uninsured people had the highest share of adults who had delayed or foregone care due to cost (27%) but reported the lowest share of adults who had delayed or foregone care due to the COVID-19 pandemic (15%). Among those with private insurance, over one in five (22%) had delayed or foregone care due to the pandemic, the highest across all insurance groups. Among adults enrolled in Medicare, only 4% reported having delayed or foregone care due to cost, the lowest across all insurance types.
In early 2022, one in three adults said they or a family member did not get care due to cost
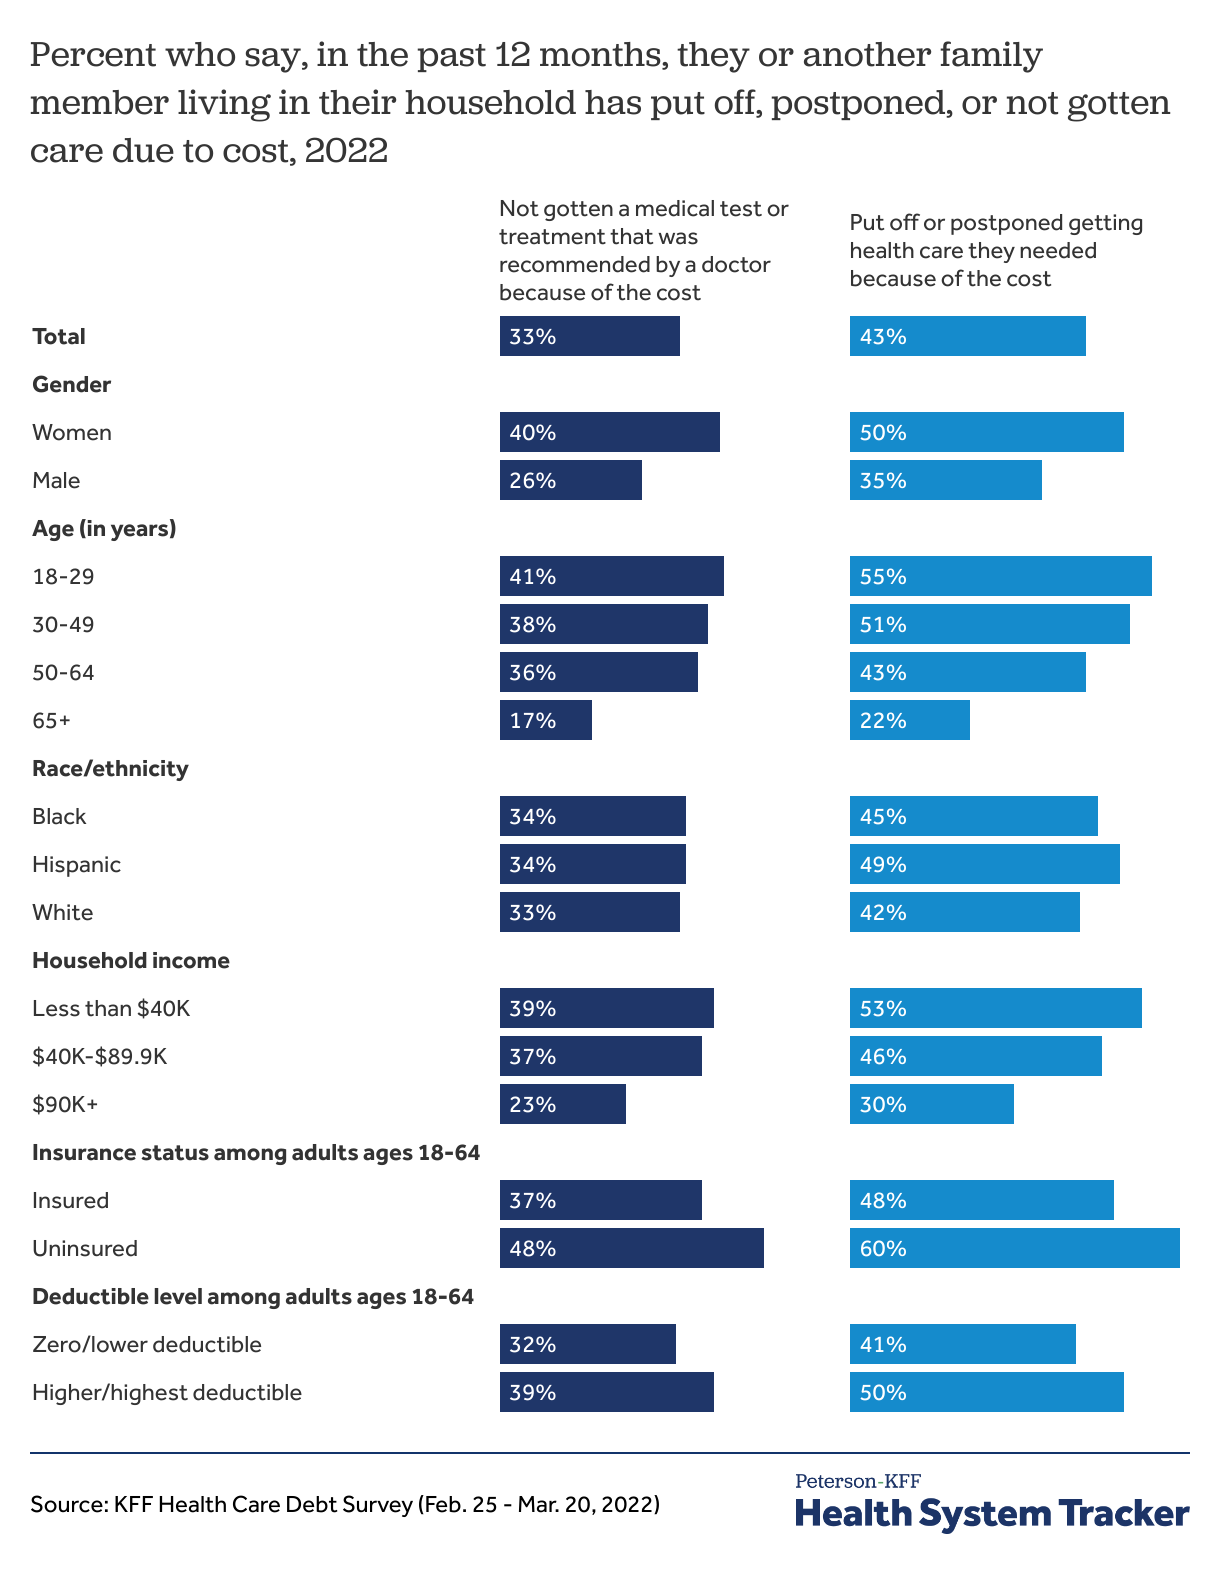
While NHIS shows about one in ten adult individuals delaying or forgoing care due to cost, KFF polling has found a larger share of adults report at least one person in their household has delayed or gone without care due to costs. Rates of forgone care are highest for uninsured and low-income individuals and households.
The Peterson Center on Healthcare and KFF are partnering to monitor how well the U.S. healthcare system is performing in terms of quality and cost.