High healthcare costs can pose a barrier to accessing care for some Americans. Most adults (91%) have health insurance, and the majority of adults (85%) report their health status as at least “good.” Half of the population has little or no out-of-pocket medical spending outside premiums. However, having sick, uninsured, or underinsured family members may lead to medical bills that put a strain on household budgets.
This chart collection explores trends in how the cost of healthcare affects access to care in the U.S. using National Health Interview Survey (NHIS) data through 2024. In addition to the financial barriers to healthcare reported here, another analysis examines several non-financial barriers to accessing healthcare.
In this analysis, the share of adults who reported delaying or going without healthcare due to cost is based on NHIS questions asking about delayed or missed medical care and mental health care, as well as delayed, missed, or rationed prescription medications due to cost. While some people reported going without multiple types of care, others said they delayed or did not get only one type of care.
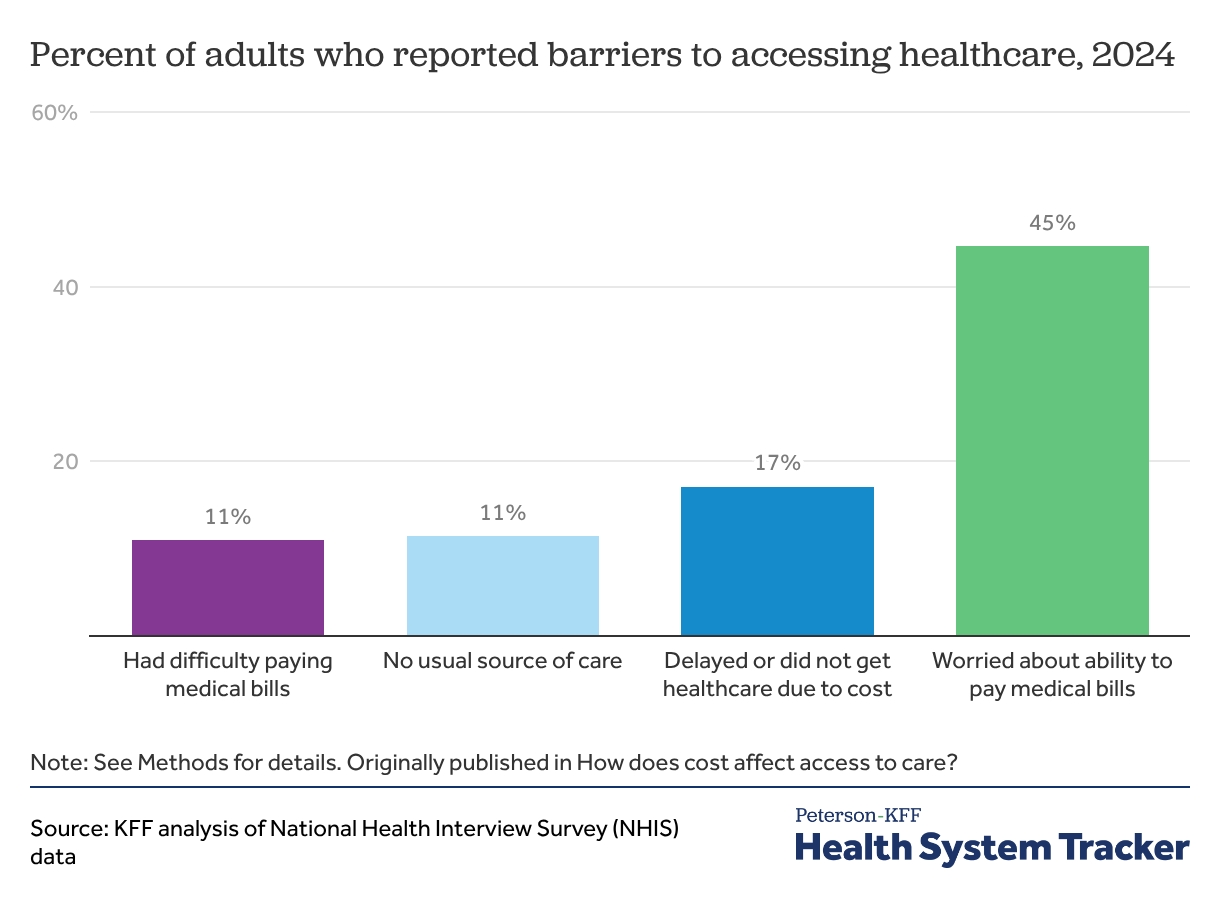
While most adults are insured and in good health, many report barriers to accessing healthcare
In 2024, about 1 in 6 adults (17%) reported delaying or not getting healthcare due to cost, including those who delayed or did not get medical or mental health care and those who rationed prescription drugs due to cost.
There are many reasons why an individual may choose to delay or forgo healthcare altogether. People without health insurance, for example, are over four times more likely to not have a usual source of care, and this can lead to decreased access to healthcare. In 2024, while similar shares of adults reported that they or a family member had difficulty paying medical bills (11%) or that they did not have a usual source of medical care (11%), almost half (45%) of adults reported that they worried about their ability to pay medical bills if they were to get sick or have an accident.
Related Content:
About 1 in 6 adults delayed or did not get some form of care due to cost
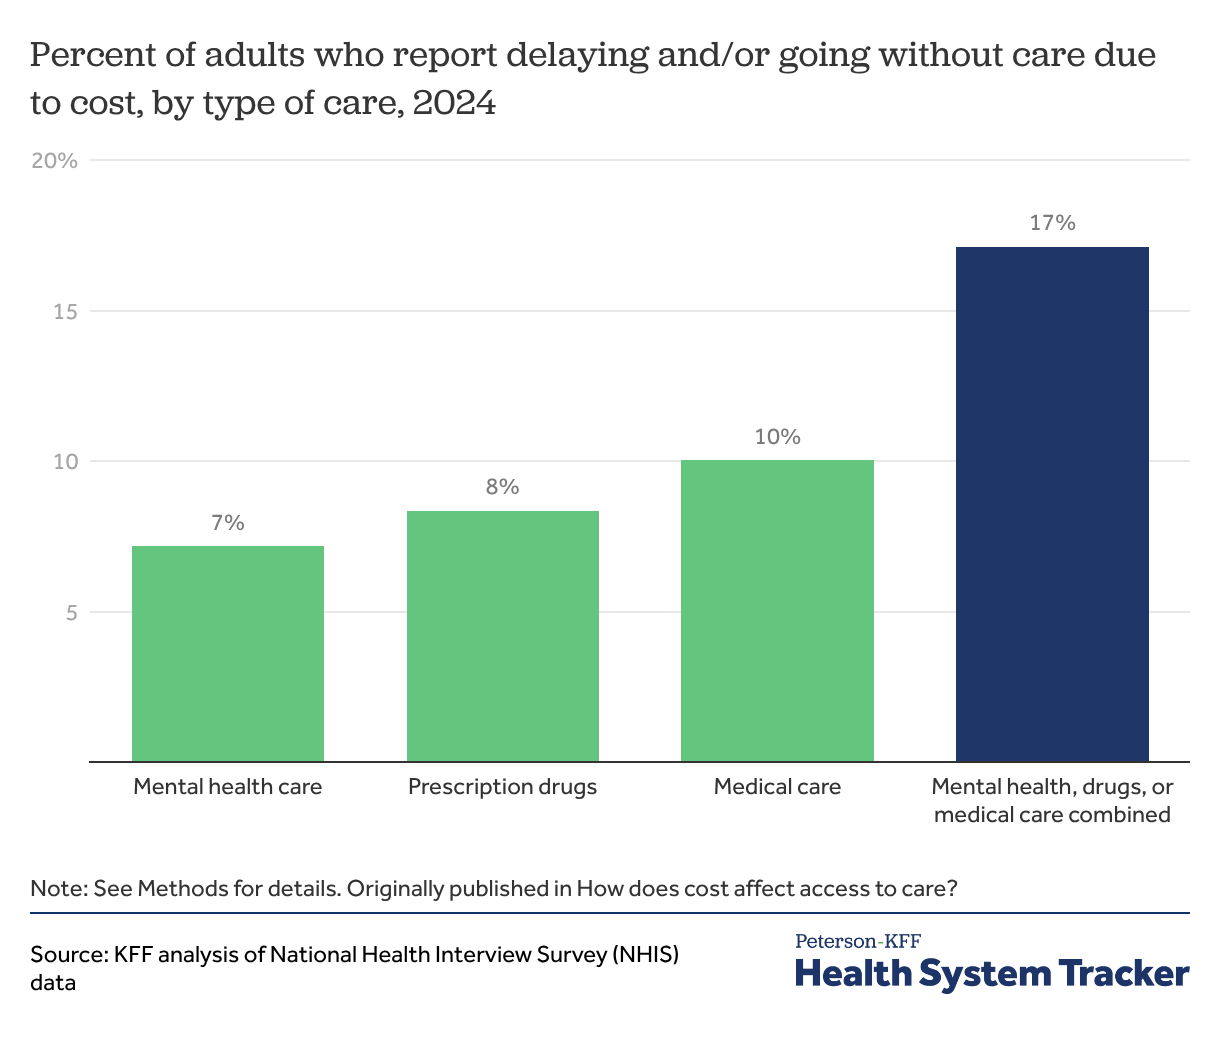
In 2024, about 1 in 6 adults (17%) reported delaying or going without either medical care, prescription drugs, or mental health care due to cost. A similar share of adults reported delaying or going without medical care (10%), prescription drugs (8%), or mental health care (7%) due to cost.
About 1 in 12 adults rationed prescription drugs due to cost
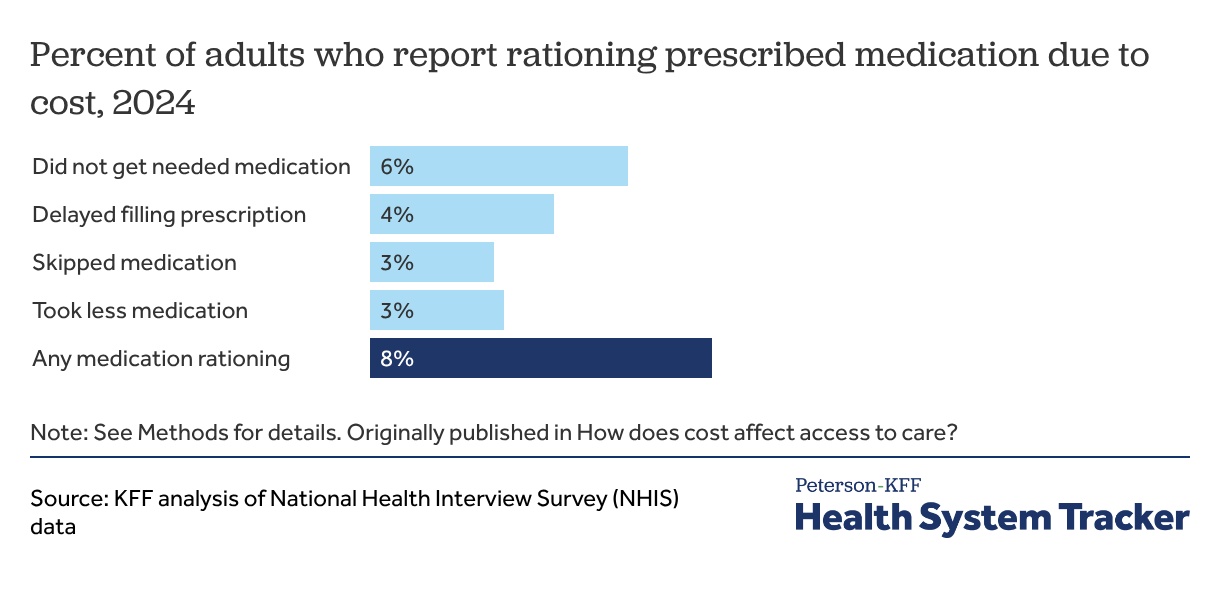
Among all adults, 8% reported rationing prescribed medication due to cost and 6% did not get needed medication to save money. Recent KFF polling found that about a quarter of adults (26%) report that they or someone living with them had problems paying for prescription drugs.
The share of adults forgoing medical care and prescription drugs has remained steady since the COVID-19 pandemic
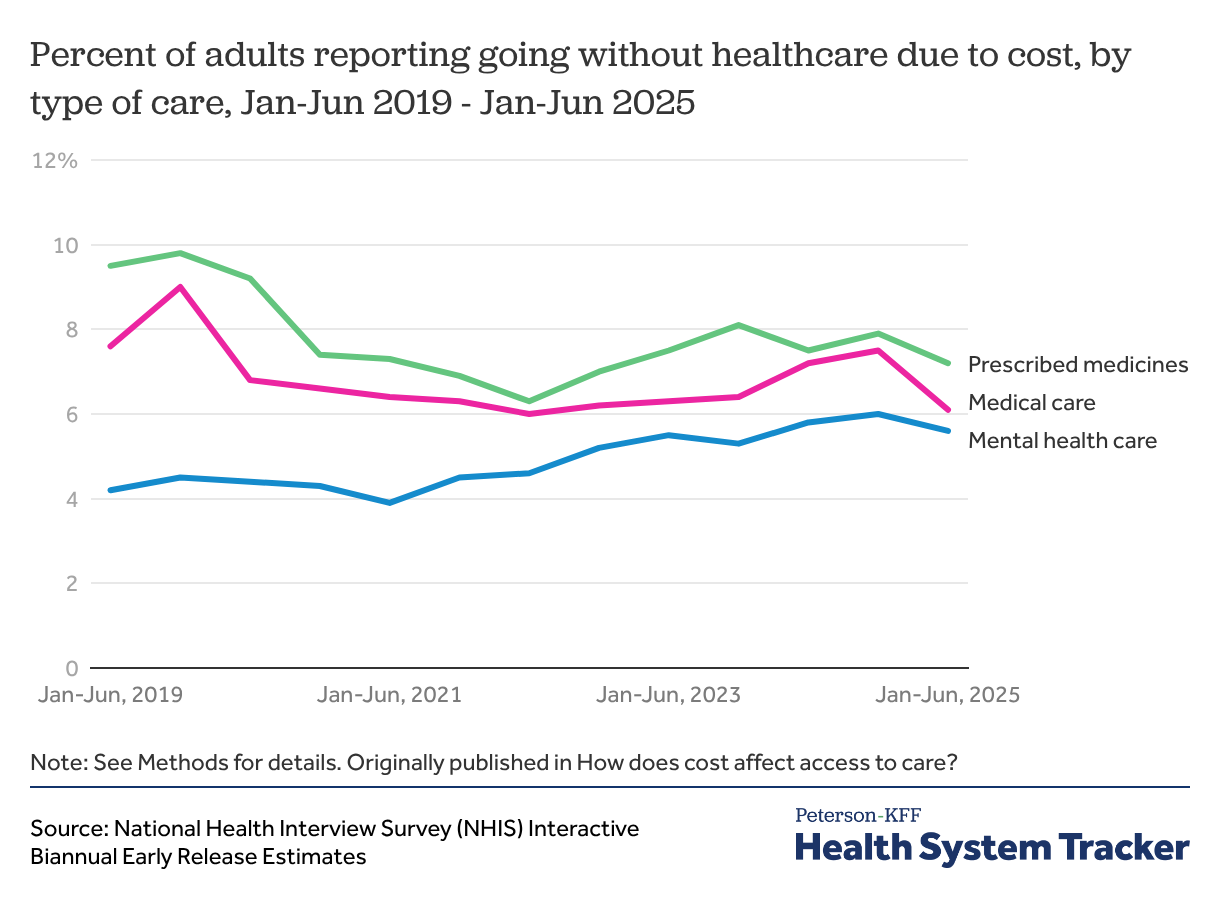
In the first half of 2025, a similar share of adults reported not taking medicine as prescribed (7%), not getting needed medical care (6%), or not getting needed mental health care (6%) due to cost.
The share of adults reporting that they did not get medical care or did not take medicine as prescribed due to cost peaked in 2019 before declining throughout 2020 during the COVID-19 pandemic. The decline was at least in part due to people forgoing care due to COVID-19 instead of cost.
The share of adults going without mental health care because of cost has slowly but steadily increased in recent years, from 4% of adults in the first half of 2021 to 6% in the first half of 2025. An earlier KFF analysis found that mental health care utilization has overall increased since 2019, particularly among young adults.
Black adults, adults under 65, adults in worse health, and uninsured adults are more likely to delay or forgo healthcare due to cost
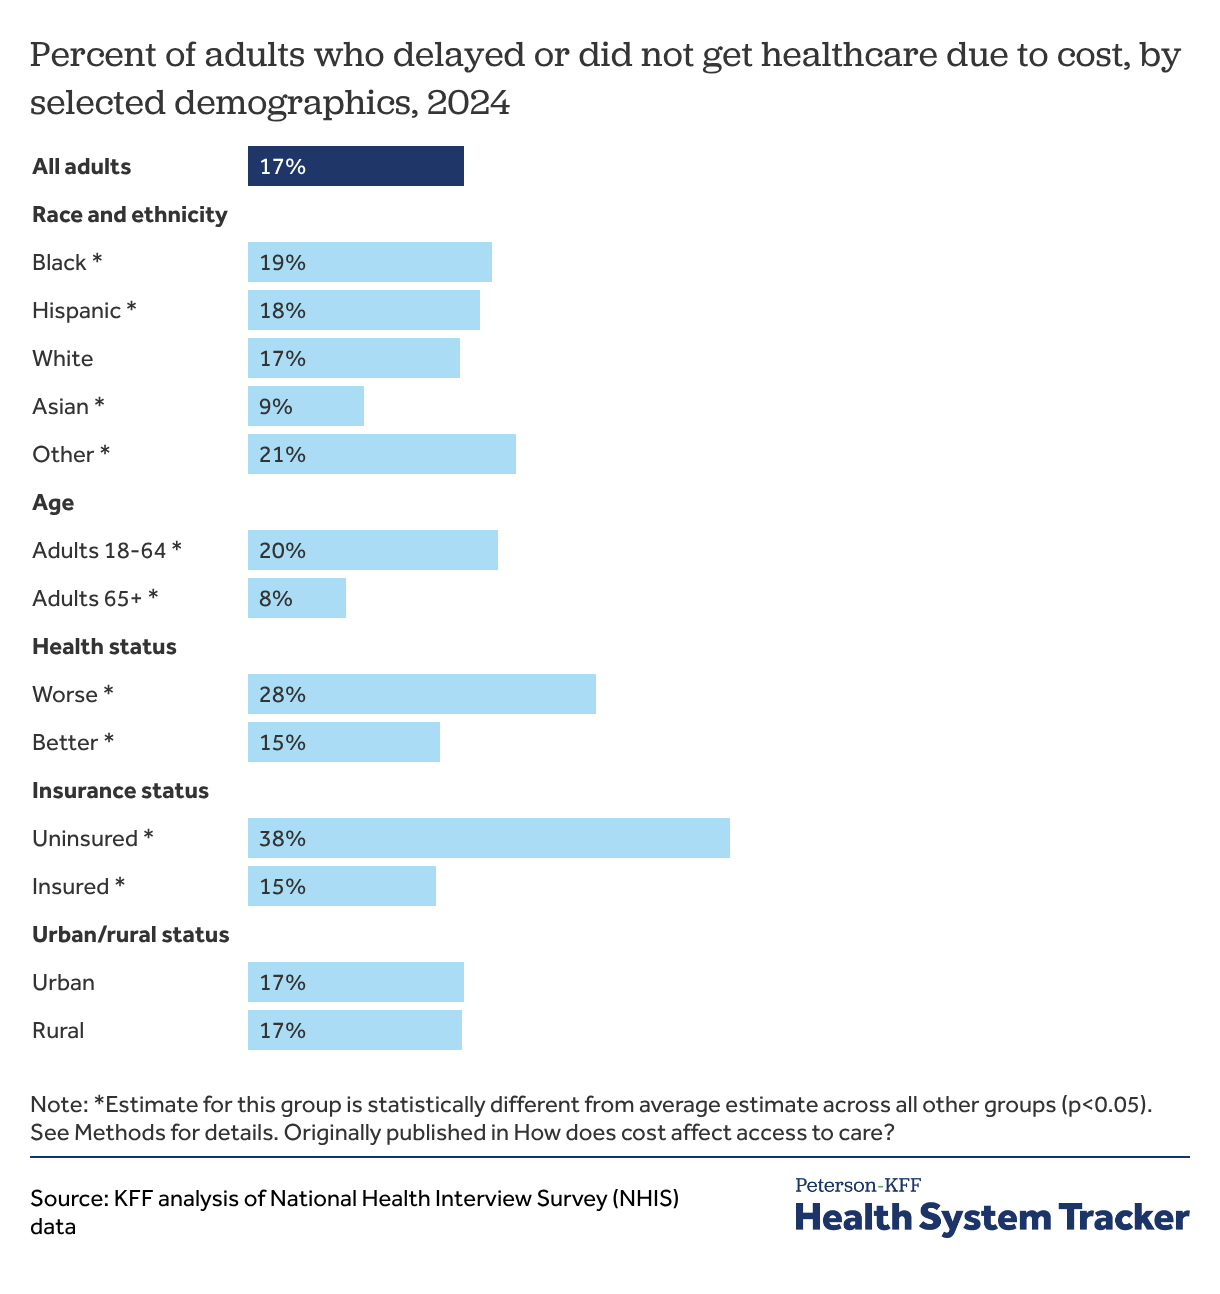
Adults who are uninsured at any point in the year reported delaying or forgoing healthcare due to cost more than twice as often compared to those who are insured (38% versus 15%).
Beyond insurance status, race, age, and baseline health all impact peoples’ ability to afford healthcare. For example, Black adults (19%) had higher rates of facing cost barriers to accessing care than people in other race and ethnic groups. Asian adults were the least likely among all race and ethnic groups to delay or forgo healthcare due to cost (9%).
Adults under 65 are more likely to report delaying or not getting some form of care due to cost than adults 65 and older (20% versus 8%). Adults over 65 may have fewer cost barriers to accessing care as they generally receive health insurance coverage through Medicare, which tends to pay lower prices and experience slower price growth than private insurance.
Adults in worse health are nearly twice as likely to report delaying or forgoing some form of care due to cost compared to adults in better health (28% versus 15%).
Uninsured adults and adults who are in worse health are twice as likely to report that they or a family member had difficulty paying medical bills
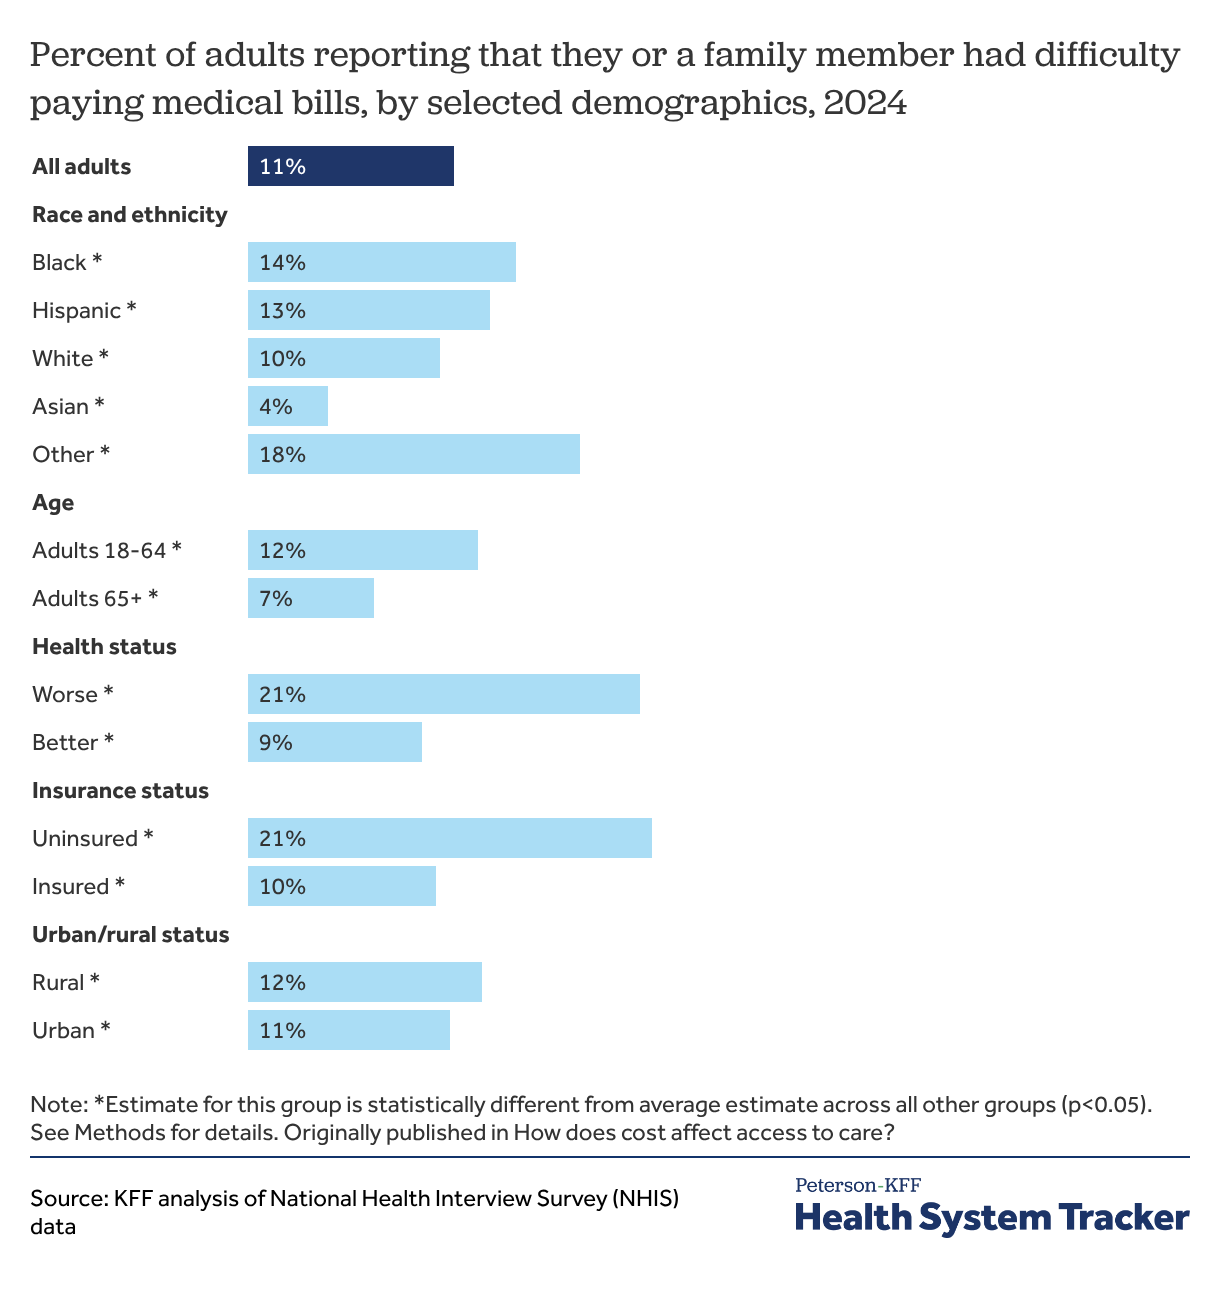
Some people miss or delay care they cannot afford while some people receive care and incur medical debt, and others experience both types of challenges associated with high medical costs.
Among all adults, 1 in 9 (11%), including 10% of insured adults, stated that they or a family member had difficulty paying medical bills. This rate is twice as high, over 1 in 5 (21%), for uninsured adults.
Black Americans (14%) had a higher share of adults in families reporting difficulty paying medical bills compared to people in other race and ethnic groups. Adults under 65 are also more likely to report difficulty paying medical bills than adults over 65 (12% versus 7%). Adults with worse health report they or a family member had difficulty paying medical bills at over twice the rate of adults with better health (21% versus 9%).
Nearly half of adults worry about their ability to pay medical bills if they get sick or have an accident
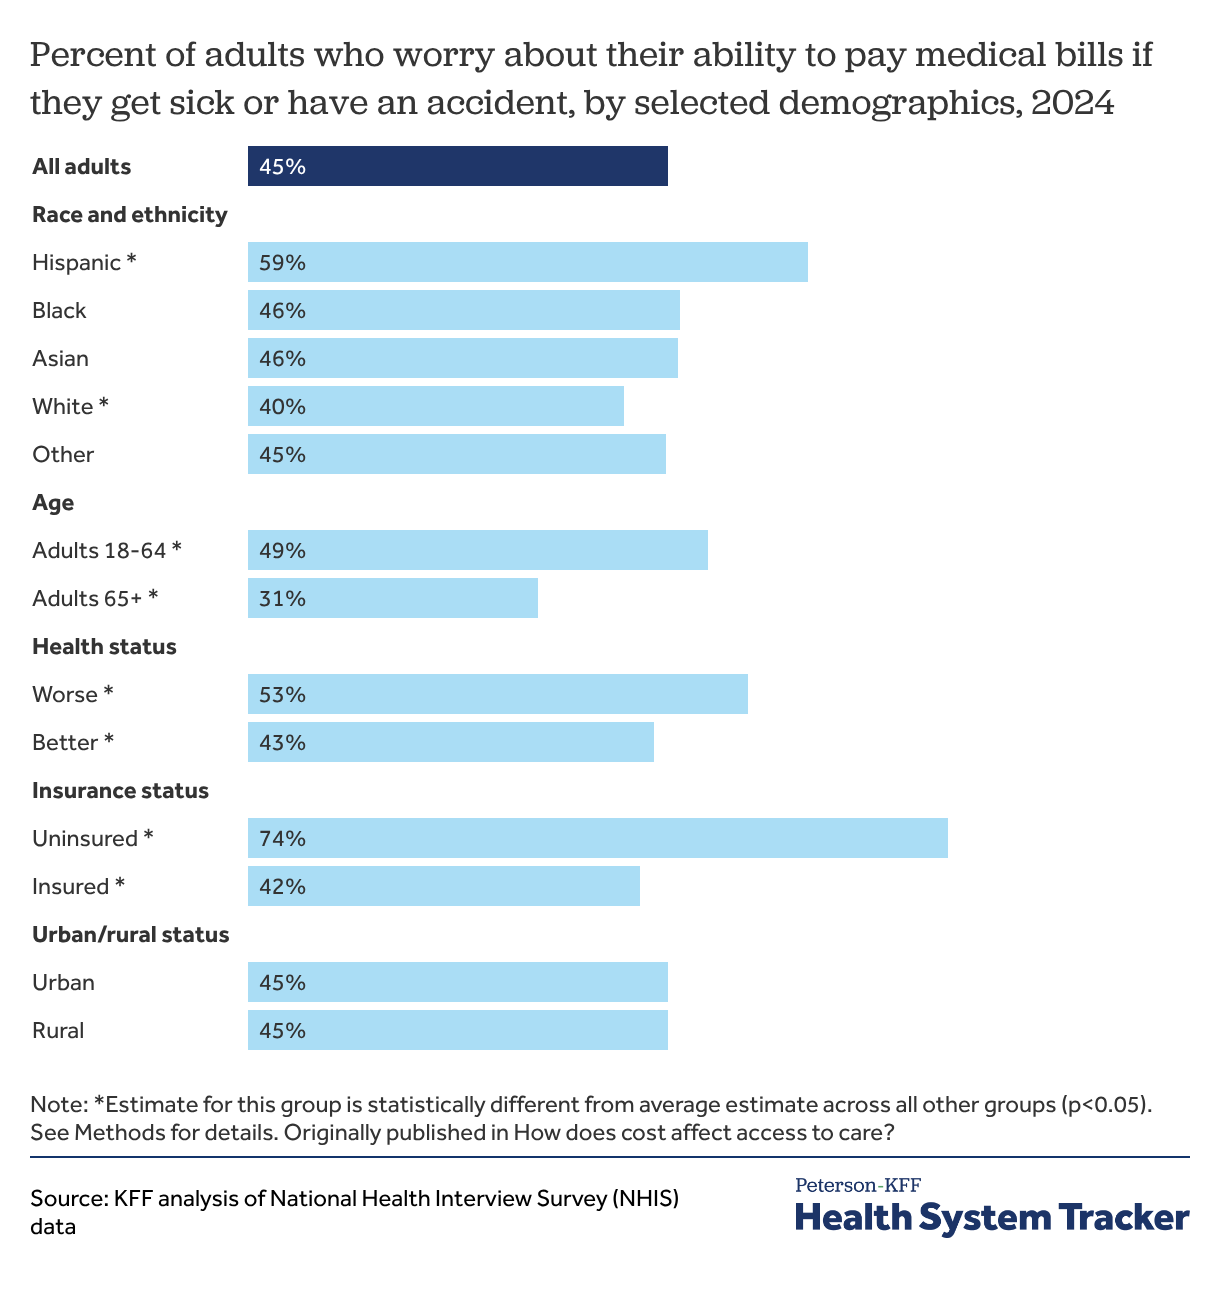
About half of adults (45%) report being worried about their ability to pay medical bills if they get sick or have an accident. Uninsured adults (74%) report being worried about being able to pay medical bills in case of an illness or accident at a higher rate than insured adults (42%). Adults under 65 are more likely to worry about being able to pay medical bills compared to adults 65 and over (49% versus 31%), as are adults in worse health compared to adults in better health (53% versus 43%).
Out of all race and ethnic groups, Hispanic adults were the most likely to report being worried about being able to pay medical bills in case of an illness or accident (59%), while White adults were the least likely to do so (40%).
Uninsured adults are about five times as likely to report not having a usual source of care
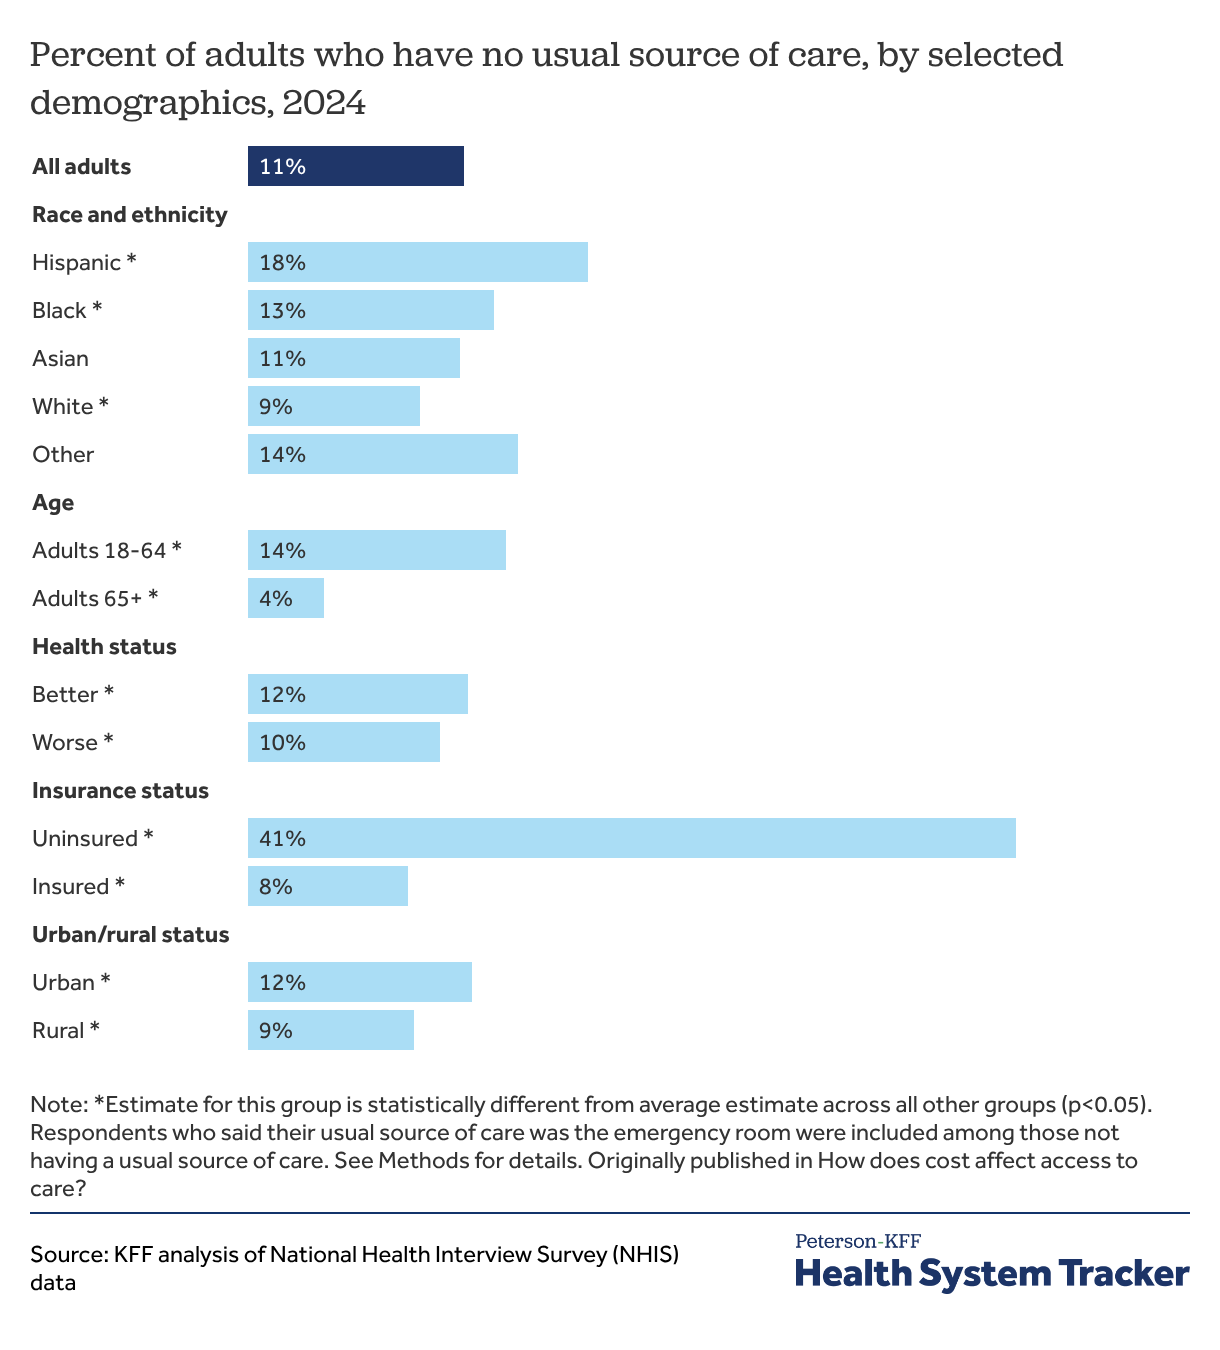
Having a usual source of care allows people to more easily seek needed medical services, both for preventive services and when they are ill. Uninsured adults are over five times as likely as insured adults to have no usual source of care (41% versus 8%). Though the share of adults without a usual source of care is similar across most race and ethnic groups, Hispanic adults (18%) are more likely than others to report not having a usual source of care. Adults under 65 are over three times as likely as adults 65 and over — who tend to be in worse health and have higher healthcare utilization — to have no usual source of care (14% versus 4%).
About 1 in 5 adults delayed or did not get dental care in 2023
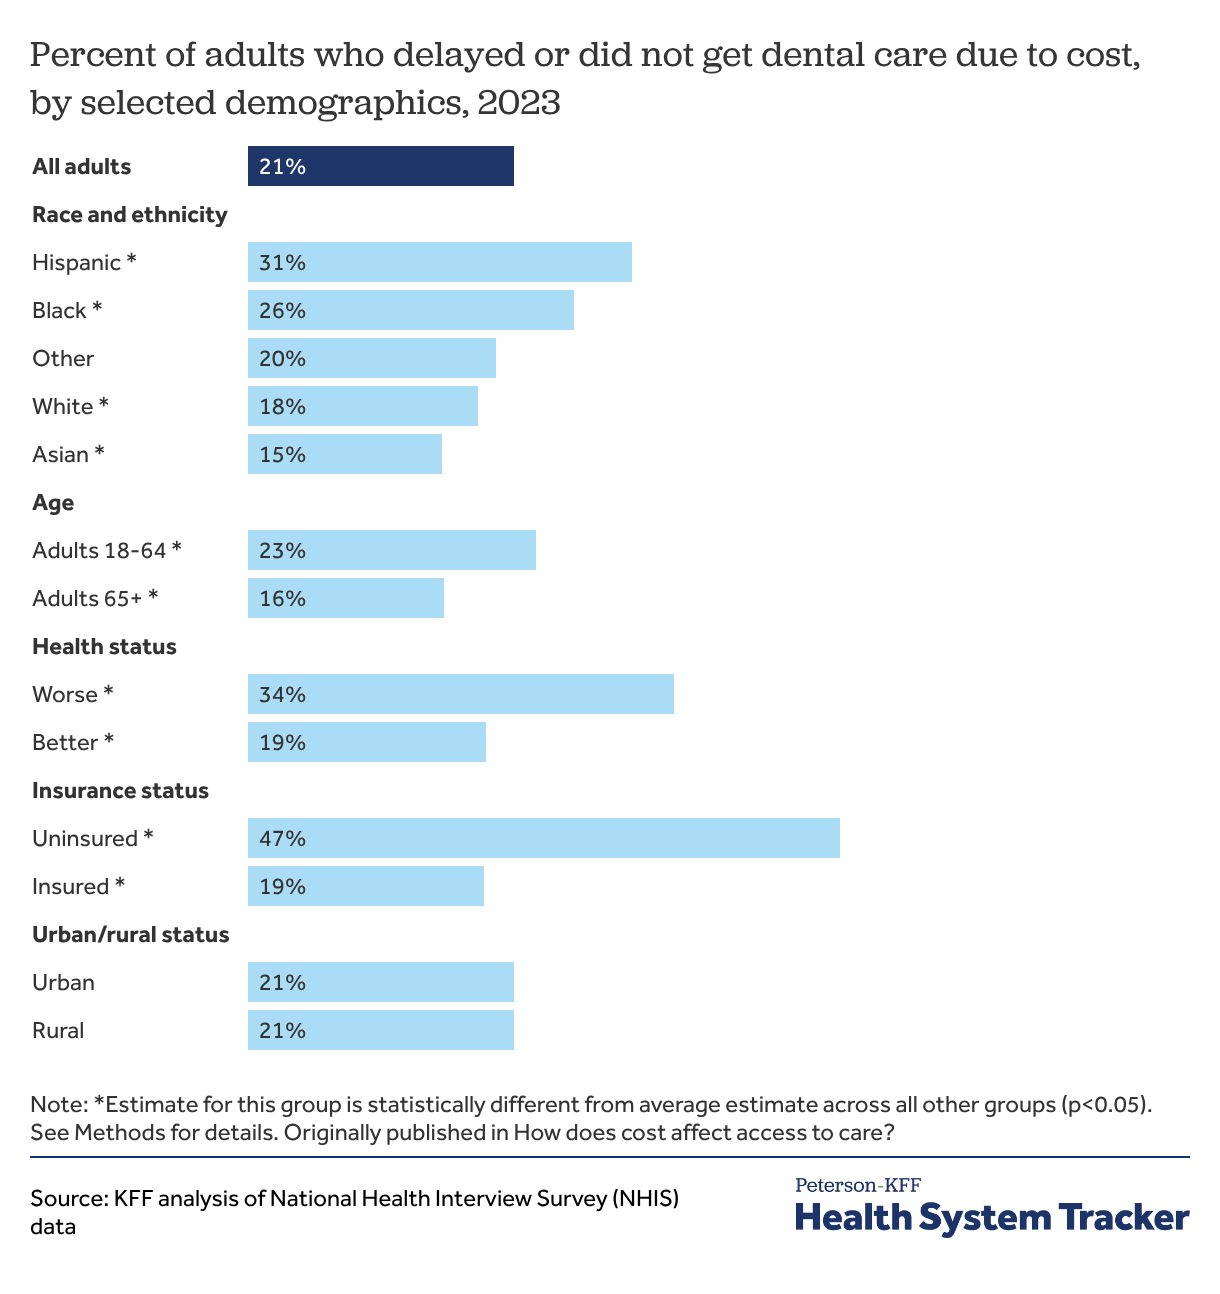
Many adults also report rationing dental care due to cost. In 2023, about 1 in 5 adults (21%) reported delaying or going without dental care due to cost, a much higher share than adults who reported delaying or going without medical care (8%), prescription drugs (8%), or mental health care (7%) that year. For those who receive care, dental care can be a major source of healthcare debt.
Unlike medical care, adult dental care is not included in all health insurance plans. Adult dental care is not an essential health benefit that must be covered by Affordable Care Act (ACA)-compliant plans in the individual and small group markets. Some people have separate dental insurance, though these plans can come with added costs. For instance, while nearly all firms that offer health benefits to their employees also voluntarily offer separate dental insurance, only 60% of such firms contribute to the premiums. Access to adult dental coverage and the scope of dental benefits also vary widely under Medicare and Medicaid. For people with dental coverage, deductibles and cost-sharing can still pose cost barriers to accessing care.
While adults overall are more likely to ration dental care due to cost than other forms of healthcare, rationed dental care follows similar demographic trends to other forms of rationed healthcare. Among all race and ethnic groups, Hispanic adults (31%) were the most likely to delay or go without dental care due to cost in 2023. Adults in worse health were more likely to forgo dental care due to cost compared to adults in better health (34% versus 19%), as are adults under 65 compared to adults 65 and older (23% versus 16%). Nearly half (47%) of all adults without health insurance delayed or did not get dental care due to cost compared to 19% of adults with health insurance.
Data for rationed dental care due to cost come from the 2023 NHIS because the 2024 NHIS did not ask respondents about forgone dental care due to cost.
At all income levels, uninsured adults are more likely to ration healthcare due to cost
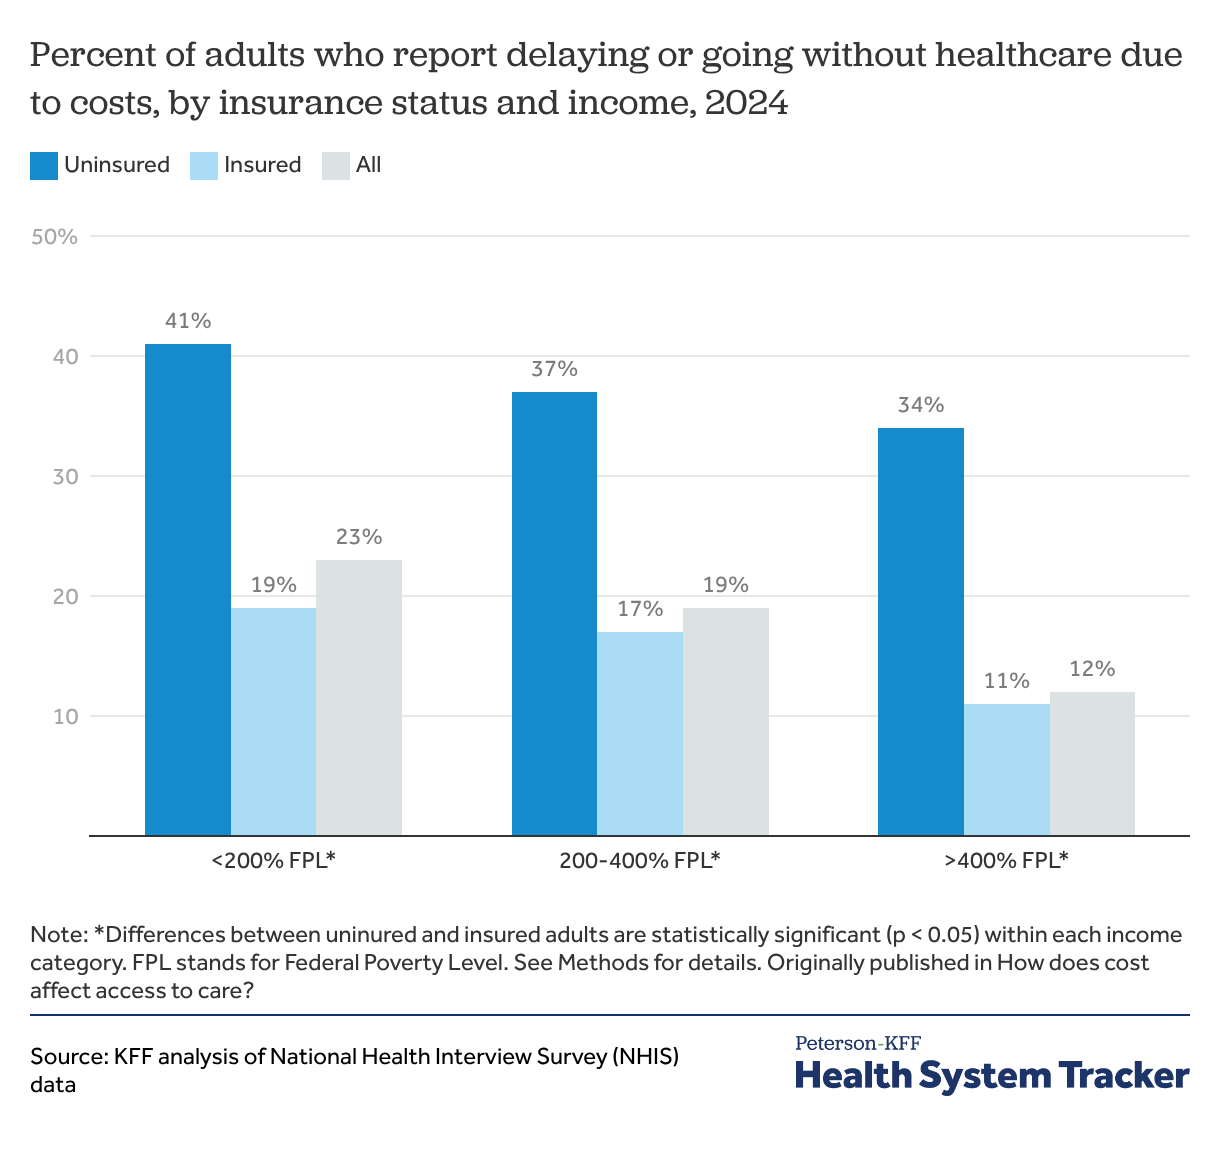
Having health insurance is associated with a significantly lower likelihood of rationing healthcare due to cost across income levels. At lower incomes, individuals with income under 200% of the federal poverty level (FPL) are often eligible for Medicaid, though eligibility differs by state. Within this lower-income group, uninsured people are more than twice as likely as insured adults to delay or forgo healthcare due to cost (41% versus 19%).
Uninsured people are significantly more likely than others to ration healthcare at higher incomes as well. Adults earning between 200 and 400% FPL or greater than 400% FPL are more than two to three times more likely to delay or forgo healthcare due to cost if they are uninsured.
Overall, adults with lower incomes are more likely than others to go without healthcare due to cost. Adults with incomes below 200% FPL (23%) are more likely to delay or go without healthcare due to cost than those with incomes between 200 and 400% FPL (19%) and those with incomes above 400% FPL (12%). Additionally, among people with employer-sponsored insurance, those with lower incomes spend a larger share of their income on insurance premiums and cost-sharing.
Uninsured adults and those in worse health report higher rates of not getting medical care due to cost
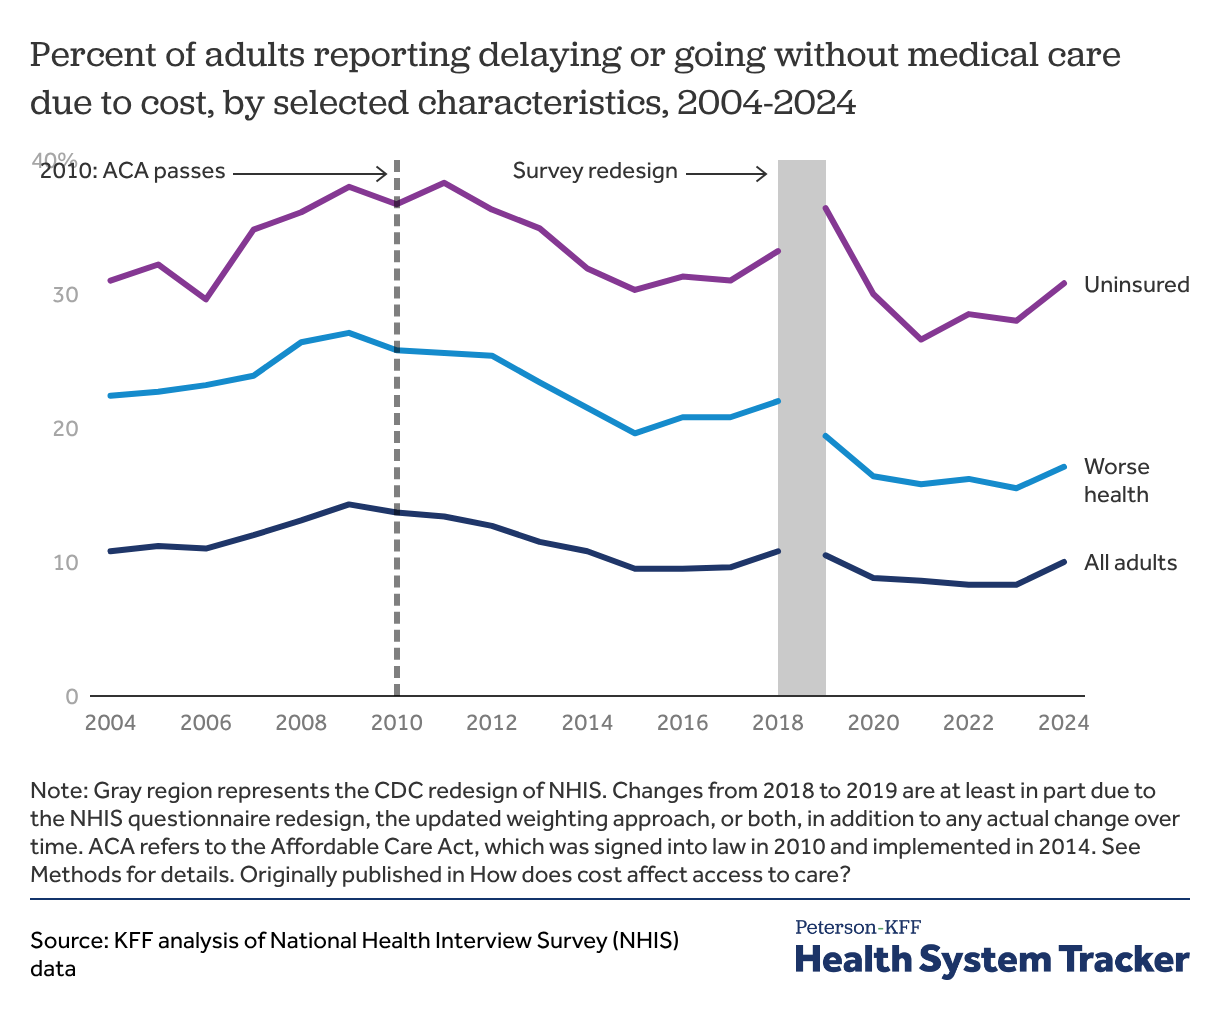
From 2004 to 2009, there was an increase in the share of all adults, those in worse health, and those who were uninsured who reported delaying or going without medical care due to cost. However, between 2010 (when the ACA was signed into law) and 2015 (the year after the expansion of Medicaid and opening of ACA Marketplaces), there was a decline in the share of adults who report delaying or going without medical care because of cost.
Despite improvements, many people continue to face access barriers due to the cost of care. In 2024, 31% of uninsured adults reported delaying or not getting medical care due to cost, up slightly from 2023. By comparison, 8% of insured adults delayed or did not get medical care due to cost in 2024.
The trend from 2018 to 2019 in the percent of adults delaying or forgoing medical care is likely at least partly due to changes to the NHIS questionnaire and sampling weights during the CDC redesign of the survey, rather than actual changes in access to care alone.
Problems with health insurance can also pose a barrier to accessing healthcare
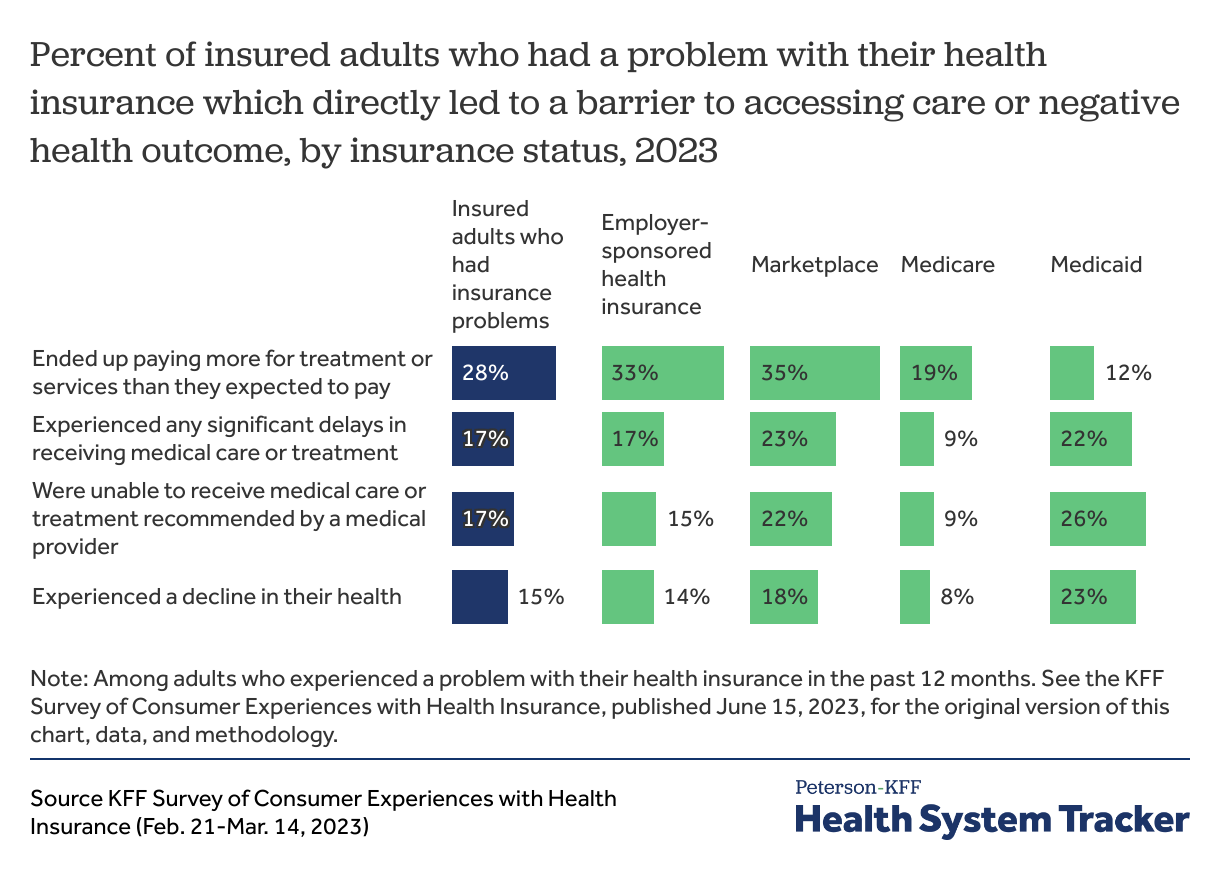
While most adults in the U.S. have health insurance and uninsured adults are more likely than others to delay or forgo healthcare due to cost, people with health insurance can still face cost barriers to care. Cost-sharing can place financial burdens on enrollees, contribute to debt, and render care unaffordable. For example, more than 40% of U.S. households do not have enough assets to pay a typical private plan deductible. Recent KFF polling finds that 38% of insured adults under the age of 65 worry about affording their monthly health insurance premiums.
According to the 2023 KFF Survey of Consumer Experiences with Health Insurance, over 1 in 4 (28%) insured adults who had a problem with their health insurance reported paying more for treatment or services than they expected. Smaller shares of insured adults with insurance problems reported either significant delays receiving medical care or treatment (17%) or not receiving medical care recommended by their provider (17%). Almost 1 in 6 (15%) insured adults with insurance problems also said those problems caused a decline in their health.
Problems with health insurance include non-financial issues, like pre-authorization and network coverage, as well as cost-related barriers to care, such as insurers paying less than expected for medical bills, insurers not paying for care a patient thought they covered, and insurers not covering a prescription drug or requiring a high copay for a prescribed drug.
Two-thirds of adults worry about healthcare expenses
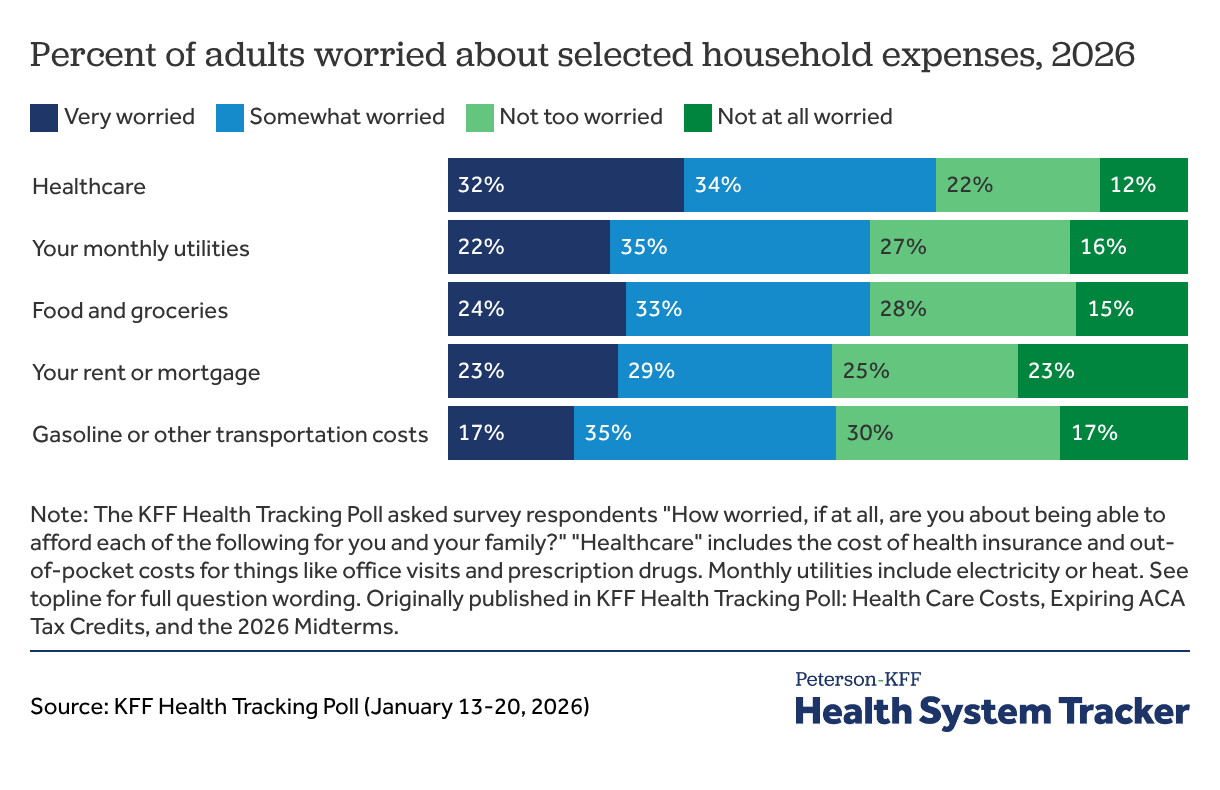
While a smaller portion of America rations healthcare due to cost, concerns about healthcare expenses remain widespread. The January 2026 KFF Health Tracking Poll found that healthcare is the household expense that worries people the most, even more than monthly utilities, food, rent or mortgage, and gasoline or transportation costs. About two-thirds (66%) of adults say they worry about being able to afford healthcare expenses for themselves and their family, including 32% of adults who are very worried and 34% of adults who are somewhat worried.
Methods
Data for this chart collection come from the National Health Interview Survey (NHIS) 2024 sample conducted by the U.S. Centers for Disease Control and Prevention (CDC). This analysis uses the NHIS sample adult interview and includes all adults.
The “delayed or did not get healthcare due to cost” variable groups together the following variables from NHIS which ask respondents about various forms of forgone care due to cost in the past 12 months: delayed medical care due to cost, needed medical care but did not get it due to cost, delayed mental health care due to cost, needed mental health care but did not get it due to cost, needed prescription medication but did not get it due to cost, skipped medication doses to save money, took less medication to save money, and delayed filling prescription to save money.
Categories for each type of rationed healthcare are not mutually exclusive. NHIS asked all adults about not getting medication because of cost and only asked those taking prescription medicine about delaying, taking less, or skipping medication. This analysis summarizes medication rationing across all adults, including those who did not take any prescription medication.
Quarterly data for adults who did not get needed medical care due to cost, did not get needed mental health care due to cost, or did not take medication as prescribed due to cost are unweighted. Data for rationed dental care due to cost come from the 2023 NHIS because the 2024 NHIS did not ask respondents about forgone dental care due to cost. Respondents who said their usual source of care was the emergency room were included among those not having a usual source of care.
For all demographic breakdowns, the “Hispanic” category could include any race, but all other groups are non-Hispanic. The “Other” race and ethnicity category groups people of any race or ethnicity not otherwise stated due to small sample sizes. Urban/rural status is defined using the NCHS Urban-Rural Classification Scheme; “Urban” includes large central, large fringe, and medium and small metropolitan areas while “Rural” includes nonmetropolitan areas. For income data, NHIS implements multiple imputation to address missing data. The 2024 NHIS used poverty thresholds from the previous year. In 2023, the federal poverty level (FPL) was $14,580 for a person living on their own and $30,000 for a family of four.
Starting with the 2019 NHIS, the U.S. Centers for Disease Control and Prevention (CDC) redesigned the questionnaire and updated the sampling weights methodology. As a result, changes in estimates from 2018 to 2019 cannot be attributed to actual change over time alone, indicated by a shaded gray region in the “Percent of adults reporting delaying or going without medical care due to cost, by selected characteristics, 2004-2024” chart.
The Peterson Center on Healthcare and KFF are partnering to monitor how well the U.S. healthcare system is performing in terms of quality and cost.