Introduction
The high cost of emergency care may impact patients’ ability to afford treatment, with almost half of US adults reporting they have delayed care due to costs. Almost 1 in 10 Americans have medical debt, and about half of American households do not have the liquid assets to afford an average employer sponsored plan deductible. More than one third of US adults are unable to afford a $400 medical expense without borrowing.
Costs of medical emergencies present an additional financial burden on top of already costly health insurance premiums ranging $1,327 for single coverage and $6,106 for family coverage, on average, for workers with employer sponsored insurance. Variation in emergency department billing may make it difficult to predict the cost of an emergency department visit and subsequent financial liability. Recently, the No Surprises Act legislation aimed to curb unexpected emergency medical costs by prohibiting out-of-network billing for emergency services.
In this analysis, we use 2019 insurance claims data from the Merative MarketScan Commercial Database, which captures privately insured individuals with large employer health plans. We look at the total and out-of-pocket costs of emergency department visits for this group, overall and by diagnosis and severity level. We also look at which services contribute most to the costs of emergency department visits and examine regional variation in emergency department costs. Finally, we look at the demographic profile of consumers who visited the emergency department and the relationship between emergency department spending and annual spending for enrollees.
We find that enrollees spend $646 out-of-pocket, on average, for an emergency department visit. Enrollees with high annual health spending were more likely to visit the emergency department; the majority of enrollees in the top 10% of annual health care spending had at least one emergency department visit during the year. The most expensive components of most emergency department visits include evaluation and management charges, imaging, and laboratory studies, and facility fees make up 80% of the cost of visits. Cost varies by disease, visit complexity, and geographic region.
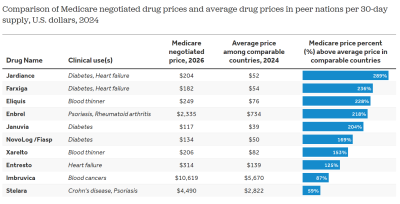
Large employer plan enrollees’ emergency department visits cost $646 out-of-pocket, on average Share on XLarge employer plan enrollees’ emergency department visits cost $2,453, on average, with enrollees responsible for $646 in out-of-pocket costs
On average, enrollees in large employer health plans who have an emergency department visit spend $646 out-of-pocket on the visit. There is significant variation in emergency department spending, with 25% of visits costing over $907 out-of-pocket and another quarter costing less than $128 out-of-pocket. These out-of-pocket costs for a single emergency department visit may be more than some people with private insurance can afford and, in some cases, could entirely deplete a consumer’s savings. For example, about 1-in-5 people (21%) with private insurance living in single-person households have less than $1,000 in liquid assets.
Related Content:

These amounts only include out-of-pocket spending required by the insurer. Before the No Surprises Act went into effect in January 2022, privately insured patients who visited the emergency department frequently had out-of-network claims on their visit, putting them at risk of providers sending them surprise balance bills. The No Surprises Act now prohibits most surprise out-of-network billing, but does not apply to ground ambulances. Any balance bill that a patient received from a provider would not appear in claims data and therefore would have been in addition to the out-of-pocket amounts shown here.
In total, enrollees and insurers paid $2,453, on average, per visit, with one quarter of visits costing $970 or less and another quarter costing $3,043 or more. All the costs described in this analysis are for the emergency department visits only, including professional services and facility fees, and do not include any spending on subsequent hospitalizations.
Facility fees contribute significantly more than professional fees to total visit cost
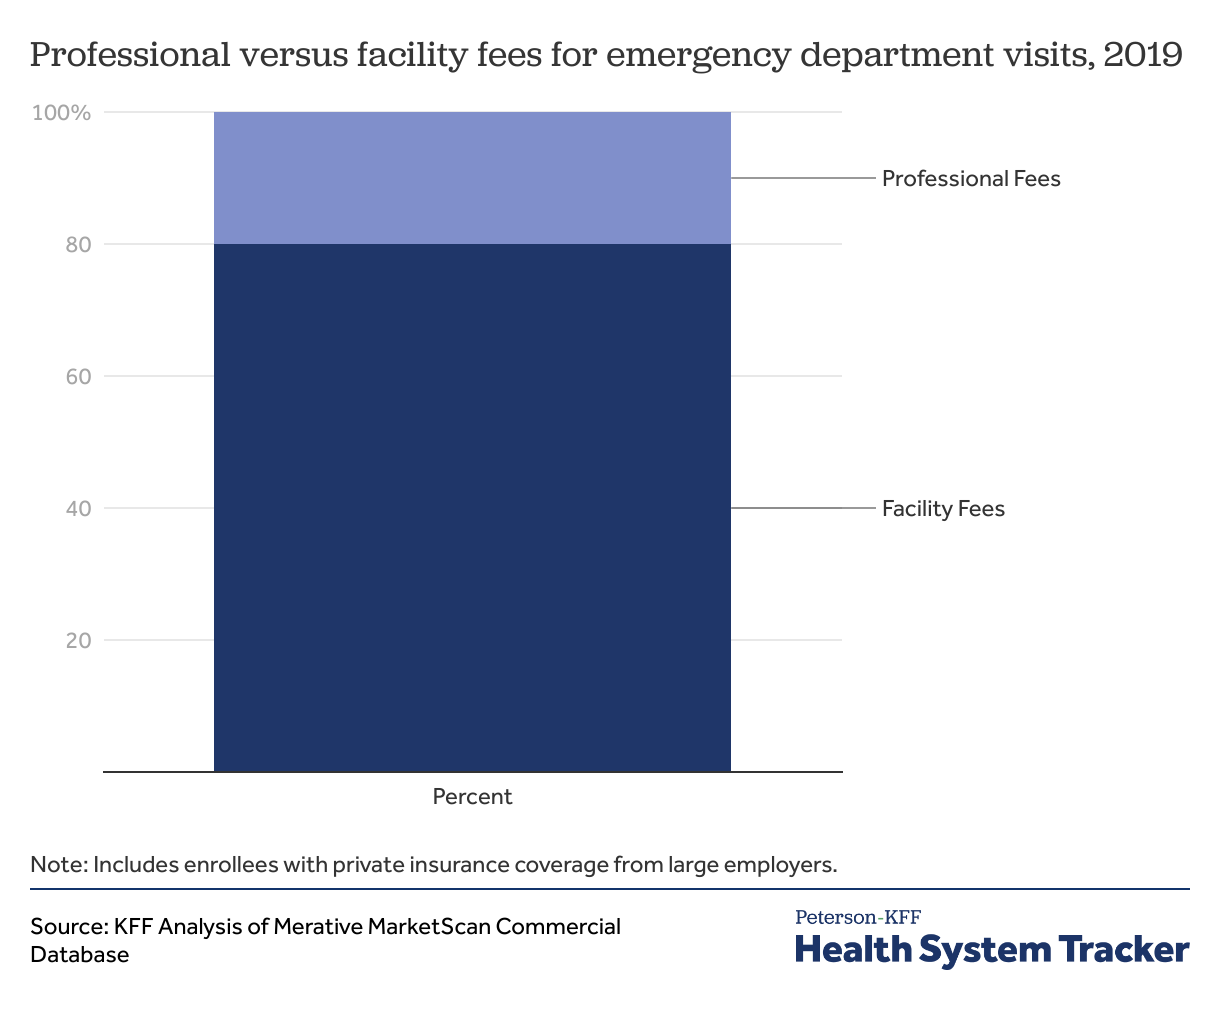
Emergency department bills are categorized as facility fees or professional fees. Professional fees are for services provided by clinicians, and facility fees include bills for services rendered using equipment owned by the facility, including laboratory or imaging studies. These fees are considered “overhead” for emergency departments and help facilities maintain appropriate staffing levels and technical resources. Evaluation and management charges also have a facility fee component for the equipment, staffing, and administrative resources used by the physician in their management. We find that facility fees make up 80% of total visit cost.
Evaluation and management charges make up the largest share of costs
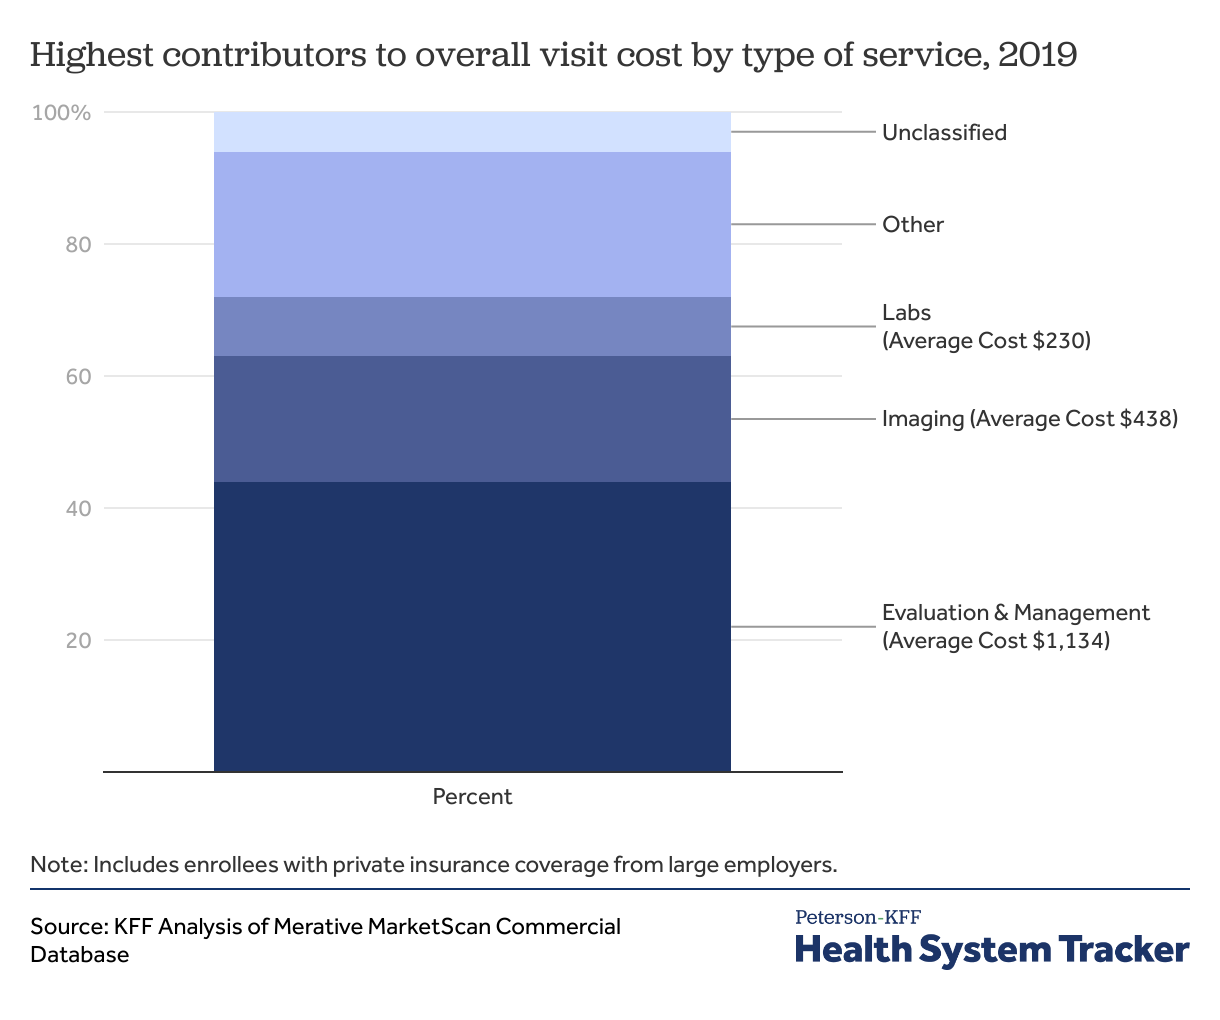
Including both the professional fee and facility fee components of charges, the largest contributor to spending on a typical emergency department visit is the evaluation and management charge, which accounts for almost half (44%) of average visit costs. Evaluation and management charges are bills for the assessment of a patient that are not related to specific procedures or treatments provided; these services cost over $1,100 per visit, on average.
Imaging charges, including radiologist interpretation fees, make up an additional 19% of the average emergency department visit charge and cost $483, on average. The highest cost routinely performed imaging services include x-rays of the chest and CT scans of the head, chest, abdomen, and pelvis. Over half of visits (55%) include a charge for imaging services. About half of patients (49%) are charged for laboratory studies, including blood tests, which cost $230 on average. Other high cost but less common charges include surgical charges for patients with appendicitis and other conditions requiring surgery without inpatient admission, as well as ambulance charges for transport.
Heart attacks and appendicitis among the most expensive common conditions treated in the emergency department
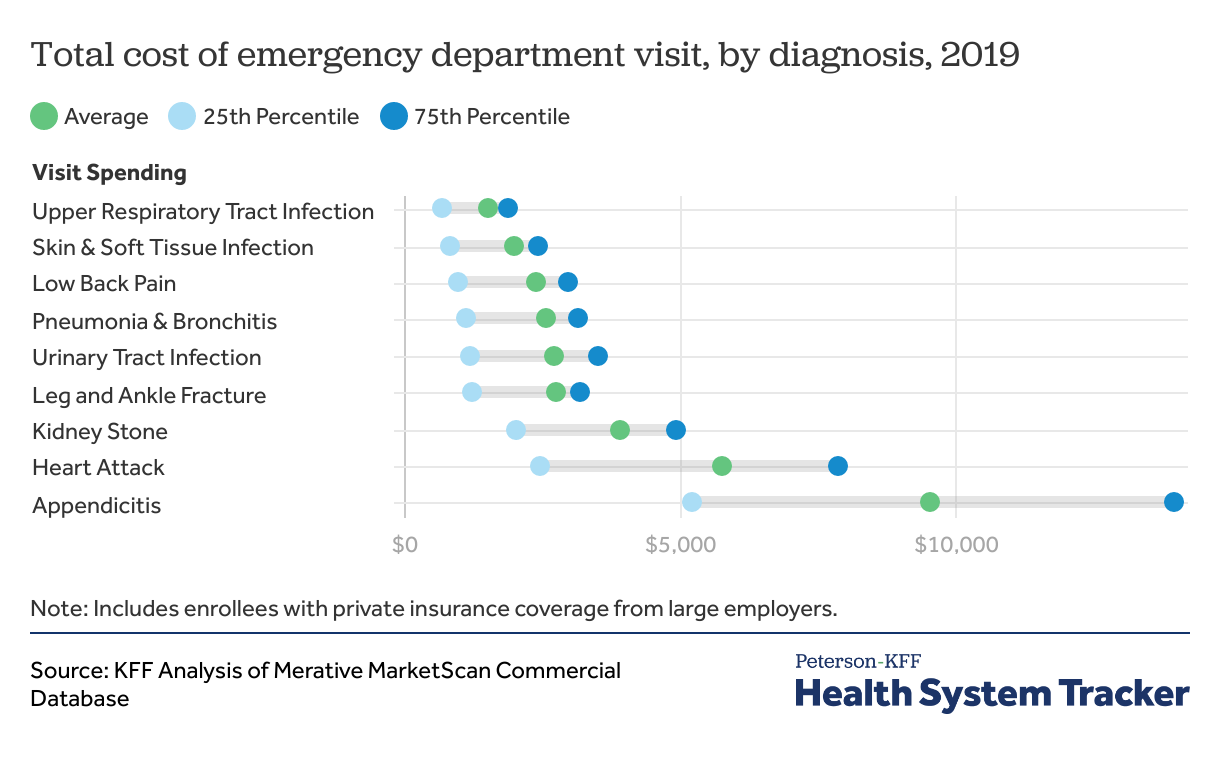
Costs of emergency department visits depend on diagnosis. We selected nine common reasons to visit the emergency department that vary in complexity of management. More severe conditions, or those with more intervention required, are the most expensive. Of the nine specific diagnoses that we evaluated, the lower-cost diagnoses were those that generally do not require imaging or extensive treatment in the emergency department. These included upper respiratory tract infections ($1,535 total, $523 out-of-pocket), skin and soft tissue infections ($2,005 total, $572 out-of-pocket), and urinary tract infections ($2,726 total, $683 out-of-pocket). While these diagnoses can occasionally require admission to the hospital, in otherwise healthy adults they are typically evaluated with basic laboratory studies and discharged with prescriptions.
The most expensive emergency department diagnosis among those we examined is appendicitis, which, on average, costs $9,535 ($1,717 out-of-pocket) per visit. Appendicitis is almost two times as expensive as the next most expensive diagnosis we looked at, heart attack. 11% of enrollees with a diagnosis of appendicitis had surgical charges associated with their emergency department visit. Surgical costs may be included in emergency department outpatient billing because these patients are often discharged after surgery without being admitted to the hospital. In contrast, other emergency department visits requiring surgery are often admitted to the hospital and have surgical charges during their inpatient visit. Enrollees who had surgery had more expensive visits by over $2,000 compared to those who did not; however even without surgery, visits for appendicitis were almost four times as expensive as the average emergency department visit (and more than twice as expensive out-of-pocket).
Enrollees with emergency department visits have variable annual spending depending on diagnosis
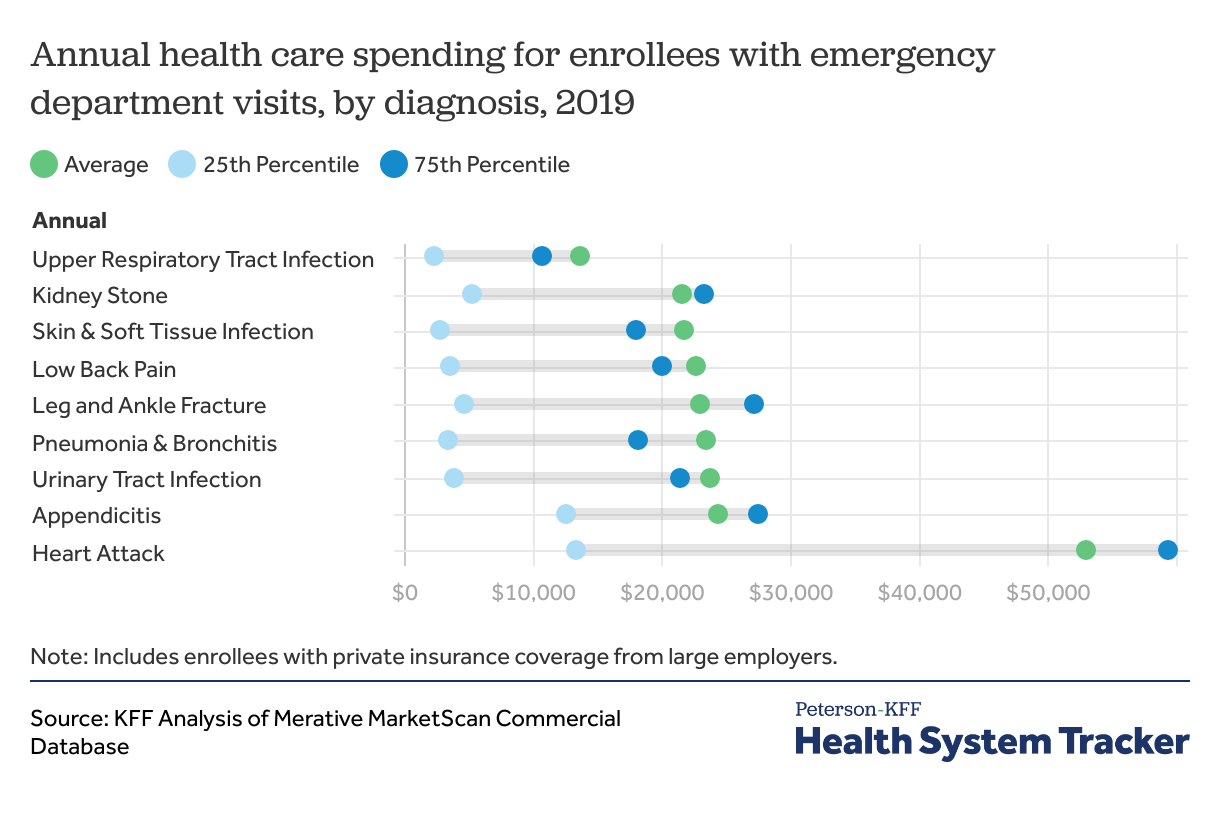
In addition to the costs of the emergency department visit itself, enrollees who visit the emergency department at least once during the year have higher annual health care spending. Annual spending includes the cost of all claims for each patient in 2019, either before or after their emergency department visit. Though appendicitis was the most expensive emergency department visit among the diagnoses we analyzed, enrollees with appendicitis in 2019 incurred an average of $24,333 in additional health care spending, which was comparable to lower cost diagnoses. Enrollees with heart attacks had at least two times more annual spending than any other diagnosis ($52,993), while enrollees with upper respiratory tract infections had the lowest annual spending ($13,727).
These differences in annual costs may reflect spending both directly related and unrelated to the emergency department visit. For example, enrollees with heart attack emergency department visits may have high annual spending because of follow-up, medications, or hospitalizations after their heart attacks. However, their high annual spending may also reflect more comorbidities and higher healthcare utilization at baseline. In contrast, appendicitis, the most expensive emergency department visit, is correlated with relatively lower annual costs; unlike heart attacks, appendicitis often occurs in younger, healthier people and requires comparatively little additional post-surgical follow-up or treatment.
The most complex emergency visits are more than 6 times as expensive as the least expensive visits, but insurers pay an increasing share of the visit as complexity increases
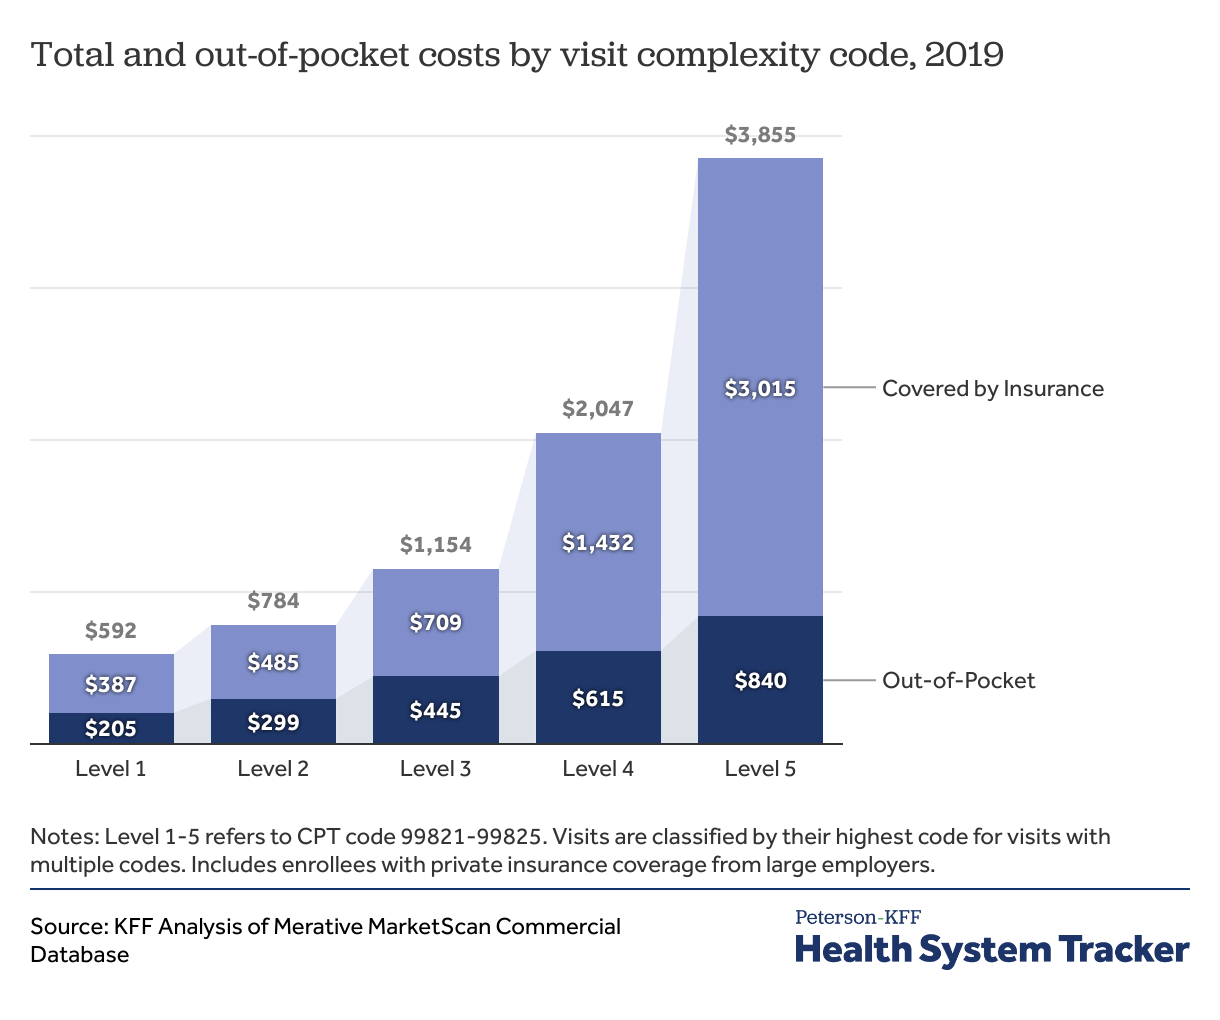
Emergency department visits are coded by complexity during the billing process, from 1 (least complex) to 5 (most complex). Each evaluation and management charge is associated with a procedure code ranging from level 1 to level 5 (99281 to 99285), which are generated by hospital coding professionals based on the physicians’ medical note. Criteria are defined by the Centers for Medicare and Medicaid Services (CMS) and based on the complexity of documentation and medical decision making. Patients with level 1 complexity codes require straightforward medical decision making, with self-limited or minor presenting problems, such as rashes or medication refills. Patients with level 5 codes require high complexity medical decision making and present with life- or limb-threatening conditions, such as severe infections or cardiac arrests.
The lowest complexity visits cost $592 on average, with enrollees responsible for $205, or about one-third of the total visit cost. As visits increase in complexity, both out-of-pocket costs and costs covered by insurance increase. For the highest complexity visits, the health plan covers $3,015 on average, or eight times the cost of the lowest complexity visits. On average, patients pay $840 out-of-pocket for the highest complexity visits, which is four times their out-of-pocket costs for the lowest complexity visits.
Higher complexity visits are more expensive for multiple reasons. In general, evaluation and management charges are higher cost for more complex patients. Also, patients with more complex medical conditions generally receive more diagnostic tests, medication, and other treatment, which increases the cost of the visit. For the lowest complexity visits, evaluation and management charges account for almost half (47%) of the overall visit cost. In contrast, evaluation and management charges for the highest complexity visits account for about one-fourth (27%) of the total visit cost, with additional services including tests and treatment making up a larger share of the cost.
Emergency department costs vary by geographic region
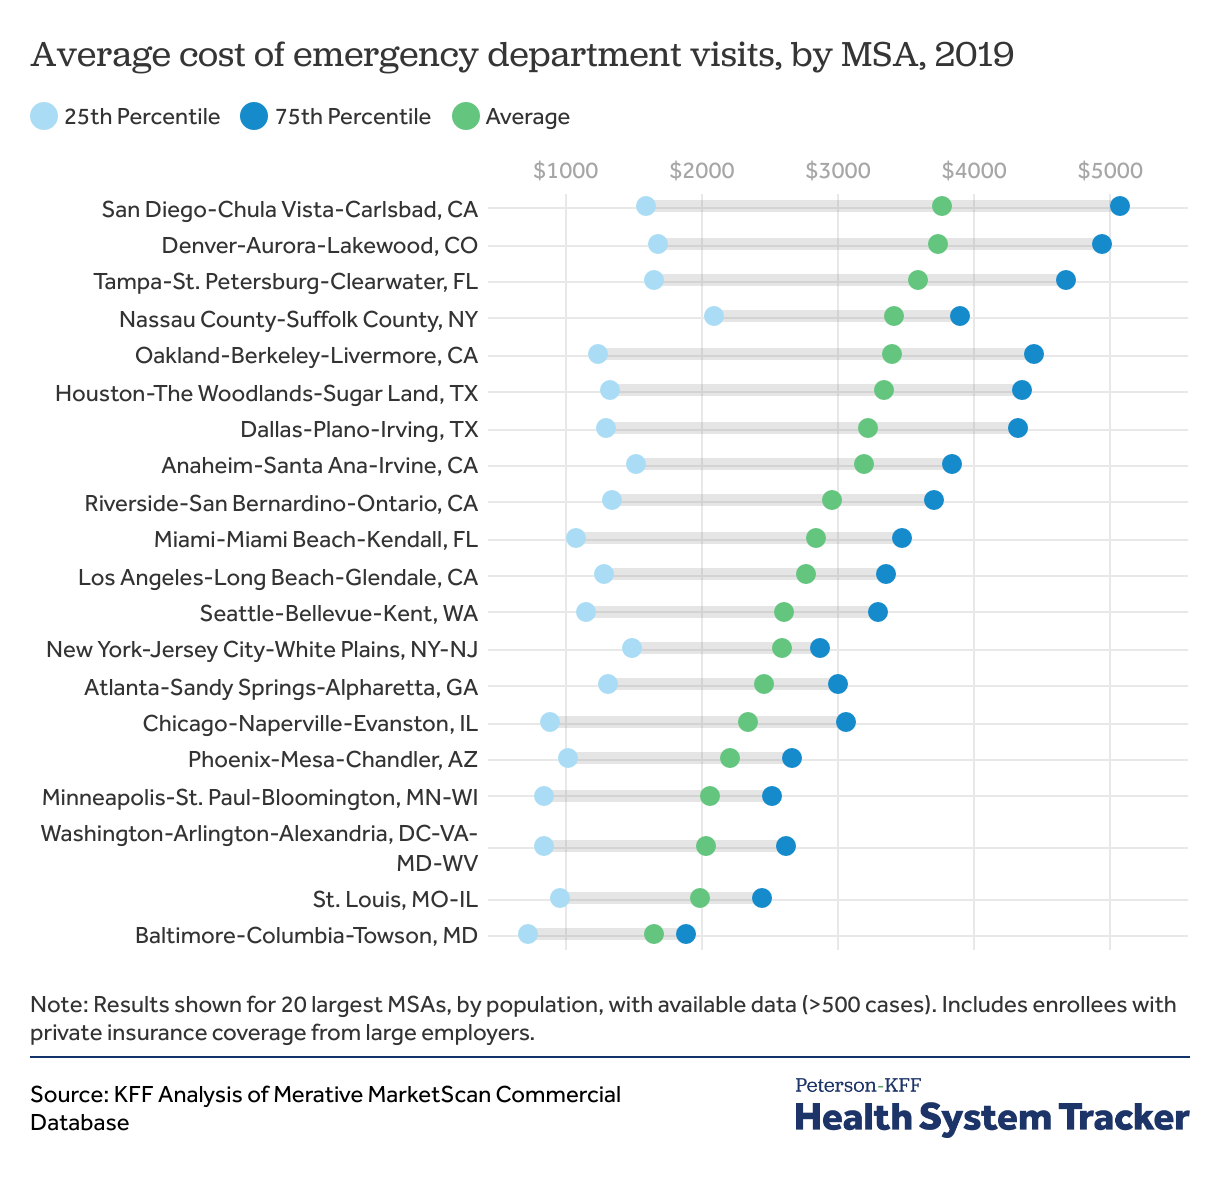
We analyzed the top 20 metropolitan statistical areas (MSAs) by population, where data are available. Overall, the San Diego, CA area had the most expensive average ED visits ($3,761 on average). San Diego ED visits were more than twice as expensive as Baltimore, MD, the least expensive MSA in our analysis ($1,645 on average). Expensive MSAs were geographically distributed in all regions of the country including the South, West, Northeast, and Midwest. Within each MSA, there was significant variation in visit costa. For example, 25% of visits in Oakland, CA cost less than $1,236 on average, while 25% cost more than $4,436 on average.
Some variation may be based on the distribution of diagnoses in each area, with more serious or complex diagnoses leading to higher cost visits. For example, if a metro area sees higher than average volume of appendicitis, heart attacks, or other high-cost diagnoses, that would drive up regional emergency department costs.
For common diagnoses, Texas and Florida MSAs are among the most expensive
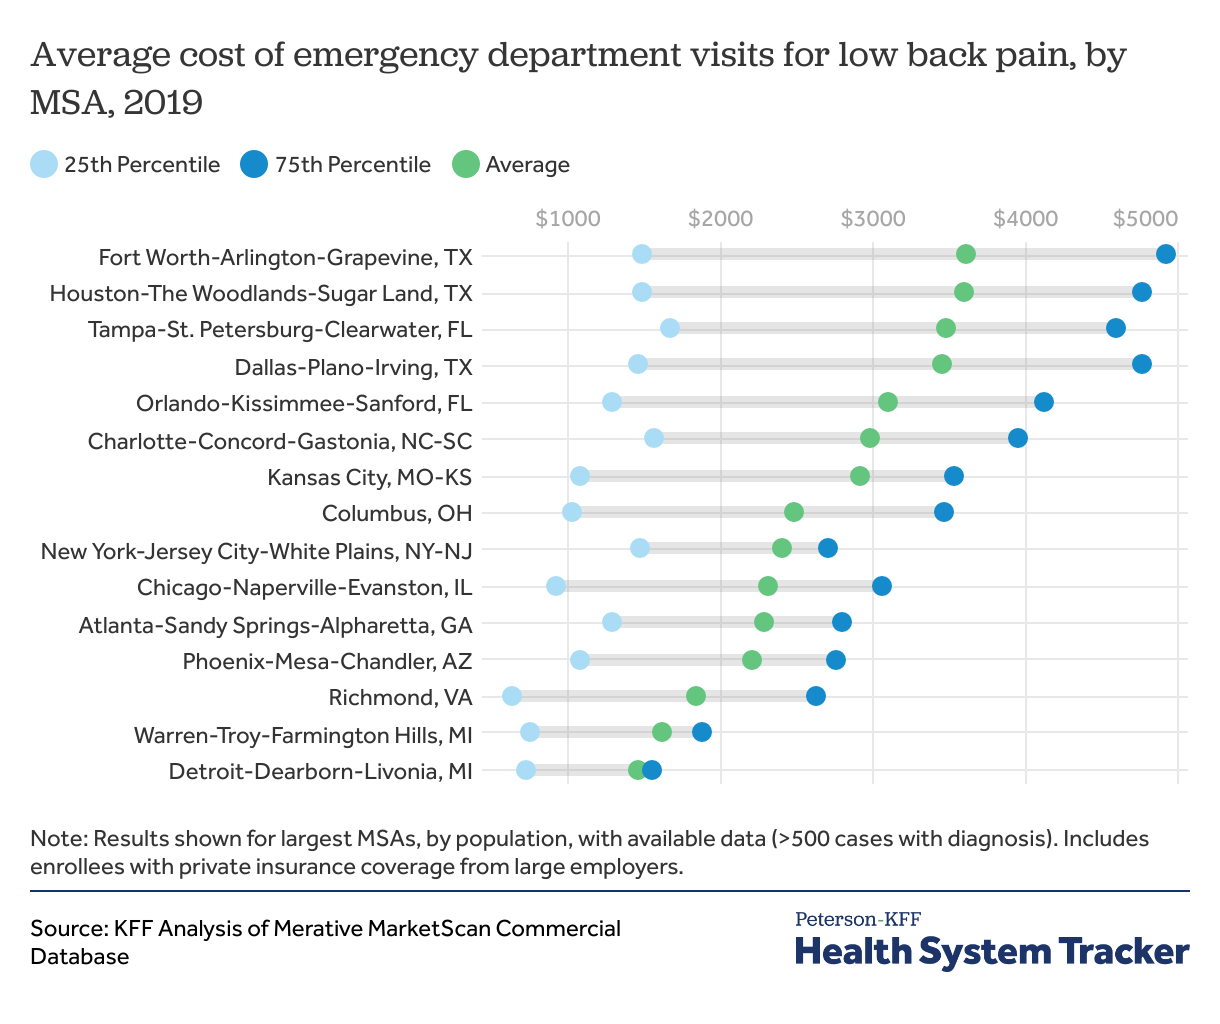
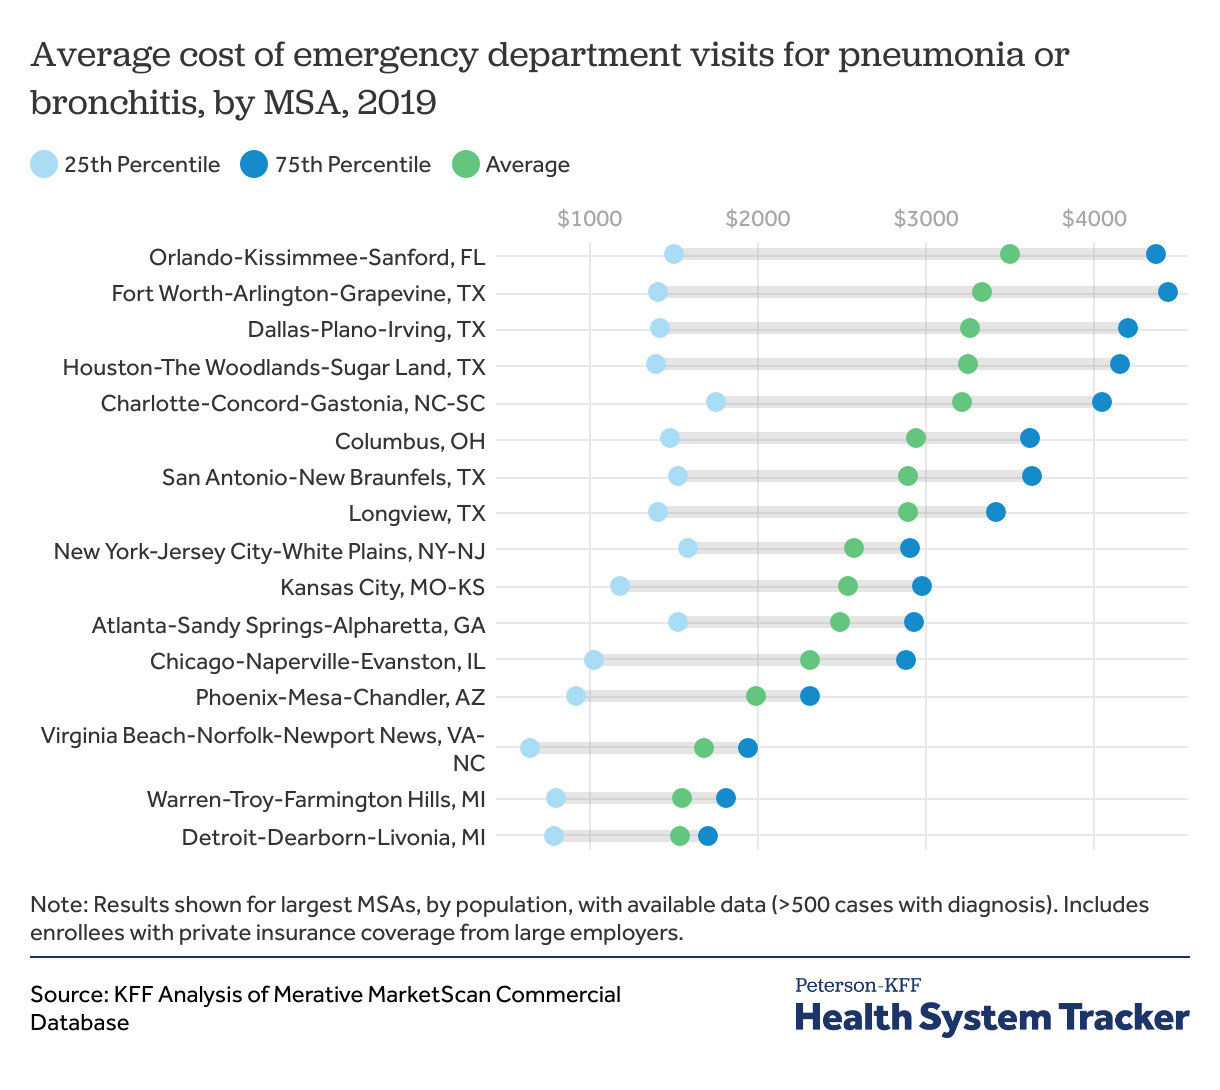
If we examine costs for specific diagnoses, we can minimize some of this variation in reasons for visits and gain a better understanding of how prices and service intensity affect the rankings. We selected two common, moderate-cost reasons for emergency department visits: low back pain and lower respiratory infections. While these visits can range in complexity and treatment required, they usually do not require hospital admission or high-cost treatment. Low back pain includes patients who present with the symptom of low back pain, regardless of diagnosis. Lower respiratory tract infection includes infectious causes of pneumonia and bronchitis. This analysis was limited to MSAs in which there were >500 cases of each diagnosis in 2019.
Visit costs for both diagnoses in Dallas, TX, Houston, TX, Fort Worth, TX, and Orlando, FL are in the top five most expensive MSAs with >500 cases. For low back pain visits, the Orlando, FL, Fort Worth, TX, Dallas, TX, and Houston, TX areas are each more than twice as expensive as the Warren, MI and Detroit, MI areas, on average. This trend is similar for lower respiratory tract infections. Within MSAs, variation in costs exist for both diagnoses. For example, for low back pain visits, there is more than a $3,000 difference between the least expensive and most expensive quarter of visits in Fort Worth, TX, Dallas, TX, and Houston, TX.
12% of large employer group enrollees went to the emergency department in 2019
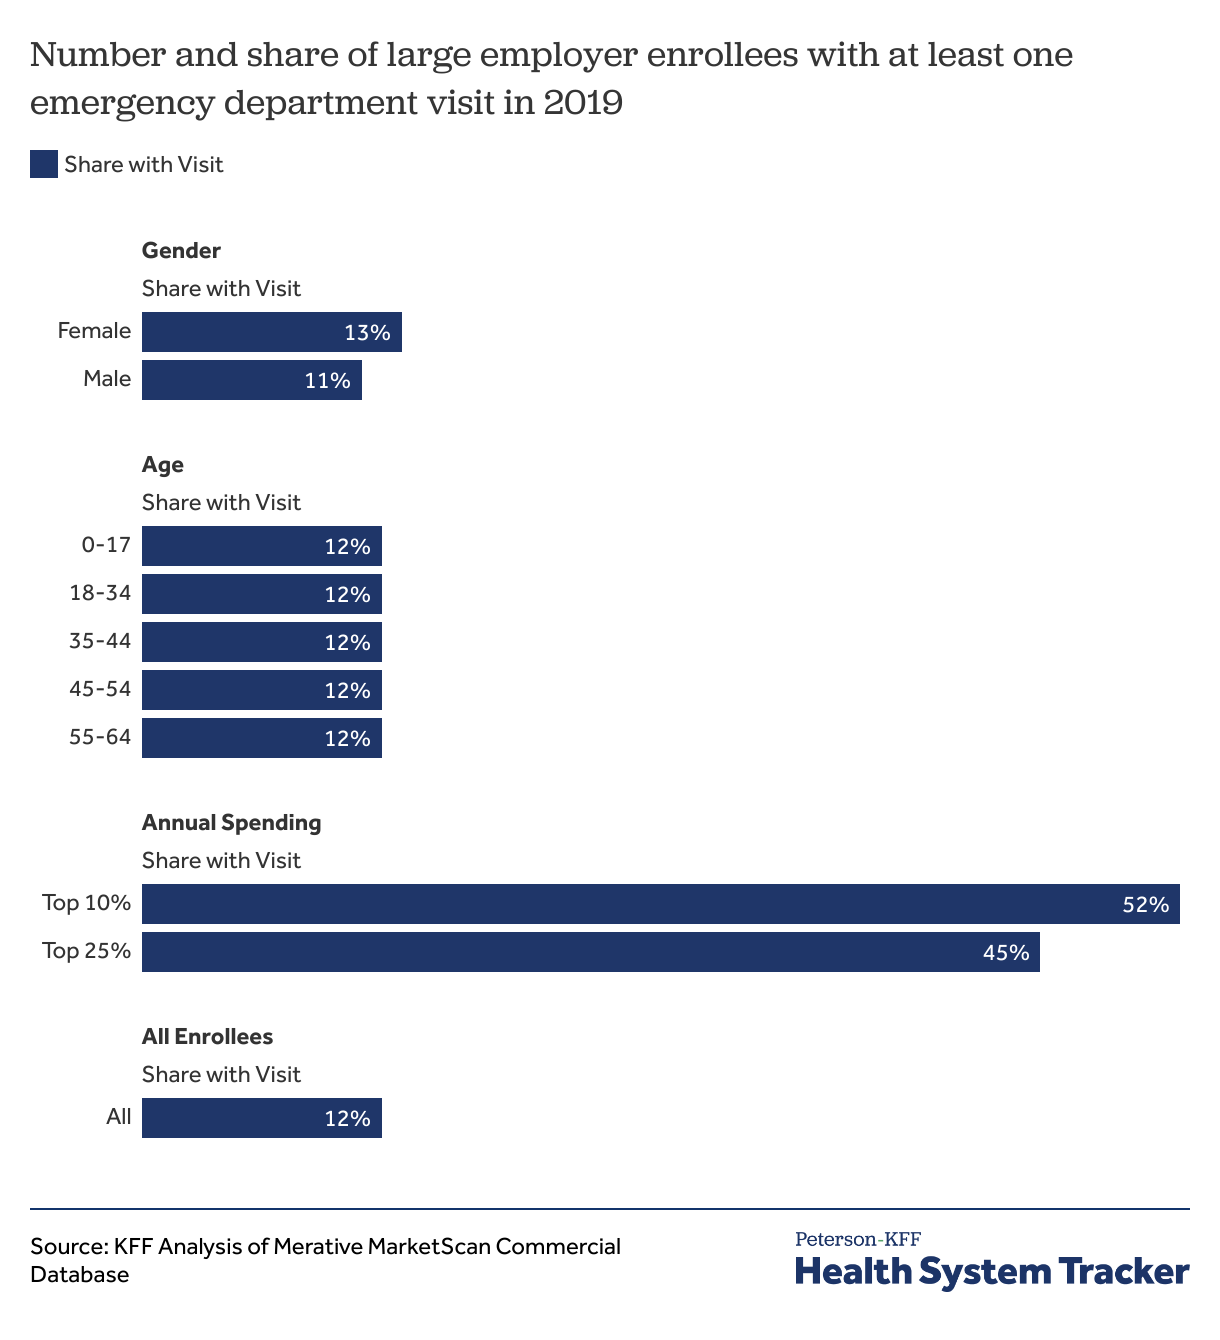
We find that 12% of large group enrollees under age 65 had at least one emergency department visit in 2019, and of enrollees with emergency department visits, 80% had only one visit. 20% had more than one visit, and 7% had more than two visits. Emergency department visits were associated with higher annual health care spending, with almost half of enrollees in the top 25% of annual spending having at least one emergency department visit during the year.
Discussion
We find that the average emergency department visit exceeds the threshold that some consumers can pay without borrowing, and even one emergency department visit in a year may create financial hardship for enrollees in large employer plans. For example, one quarter of emergency department visits for large employer enrollees cost over $907 out-of-pocket. Meanwhile, about 1-in-5 people with private insurance do not have $1,000 in liquid assets, and almost half of US adults report that they would not be able to pay a $500 medical bill without going into debt. Emergency department visits range significantly in cost depending on diagnosis, visit complexity, and geographic area. These variations may present challenges for consumers trying to predict the cost of their emergency department visit prior to going to the emergency department.
Several factors contribute to the variability of emergency department charges. First, unlike other forms of outpatient care including primary care or urgent care visits, emergency departments charge facility fees to offset the cost of keeping emergency departments open and staffed 24/7. These fees vary widely and are increasing at a faster rate than overall health care spending. The facility component represented 80% of total emergency department spending in our analysis. Many hospitals and health care providers consider these costs necessary given their mandate to provide emergency triage and treatment to allcomers. A second contributor to variation is that services are often billed at different complexity levels, and visits that are billed as more complex are more expensive. In some cases, even similar services are billed at different prices by different facilities. Notably, surprise out-of-network medical bills from emergency departments have contributed to high emergency costs for consumers, though the cost of any balance bills would be outside the scope of our claims data. The implementation of the No Surprises Act in January 2022 will generally curb surprise medical billing for emergency care.
As seen in non-emergency spending, we find that emergency department costs vary by geographic area. Among the most expensive MSAs in our analysis were MSAs located in Texas, Florida, California, Colorado, and New York. Interestingly, the most expensive regions for ED care do not align with the most expensive regions for overall health care spending. These comparisons suggest that our findings are not solely related to overall high health care prices in these areas and may reflect other factors including the age and medical complexity of the population or differences in local norms and practice patterns. State-level emergency department regulation may also play a role—states with higher numbers of freestanding, non-hospital affiliated emergency departments (which are associated with higher spending on emergency care) were among the most costly in our analysis.
The financial implications of visiting the emergency department vary widely. Not all the variation in total charges is reflected in out-of-pocket costs, since differences in cost by complexity level are smaller after insurance covers its portion of the bill. However, the most complex emergency department visits have four times higher out-of-pocket costs than the least complex visits. Even the least complex visits, some of which could be treated by a primary care office or urgent care center, cost an average of $205 out-of-pocket ($592 total). Given facility fees and relatively high evaluation and management charges in emergency departments, insurers and patients are paying more when receiving care for these conditions at emergency departments than they would using primary or urgent care. These lower complexity visits may represent a substantial avoidable cost to patients and the health care system at large.
High health care costs are of foremost concern for US adults, leading people to skip recommended medical treatment or delay necessary care. Even in the era of new price transparency regulation, which aims to improve consumer access to prices for elective care, emergency department consumers often do not know what testing or treatment they will need, so it is difficult to assess the costs of a visit upfront. Further, in an emergency situation, patients may not be able to choose their provider or facility if they are brought in by ambulance or otherwise unable to direct their care. Lastly, lack of availability and standardization in data may make it difficult for patients to use price transparency data in real time to make decisions about accepting tests and treatment in an emergency. The high and variable cost of emergency department visits represents an opportunity for future policy changes to protect consumers from unaffordable medical bills.
Methods
This analysis is based on data from the Merative MarketScan Commercial Database, which contains claims information provided by a sample of large employer plans. Enrollees in MarketScan claims data were included if they were enrolled for 12 months. This analysis used claims for almost 14 million people representing about 17% of the 85 million people in large group market plans (employers with a thousand or more workers) from 2004-2019. To make MarketScan data representative of large group plans, weights were applied to match counts in the Current Population Survey for enrollees at firms of a thousand or more workers by sex, age, state, and whether the enrollee was a policy holder or dependent.
Emergency department visits were flagged if an enrollee had an emergency department evaluation and management claim in the emergency department or the hospital on a given day. If an enrollee had either an emergency evaluation and management claim or another claim originating in the emergency department on the day prior to or after the flagged day, we added the previous and or following day’s outpatient spending to the visit cost. This was to capture all emergency department services for visits that may have spanned overnight or multiple days. Over half (53%) of the spending in this analysis occurred in the emergency department, with another 42% occurring in the hospital, which may occur when a patient receives a test or procedure in a location outside the emergency department during their visit.
Claims were included if they were above $100 and below the 99.5th percentile of cost. Selected conditions were generated from a literature review of common emergency department diagnoses and defined using ICD10 codes. Enrollees were considered to have a certain diagnosis if the relevant ICD10 code appeared in the “Diagnosis 1” column in one or more claims on an emergency department visit day. While emergency department claims have up to four diagnoses, diagnoses listed in 2-4 were not used to identify relevant conditions because these diagnoses were most often incidentally found rather than related to the reason for presenting to the emergency department. For specific diagnosis definitions: Heart attack includes acute STEMI and NSTEMI, and excludes complications from prior heart attacks or angina; UTI includes acute cystitis, UTI and pyelonephritis; Kidney stone includes renal calculus in any location and renal colic; Lower respiratory infection includes pneumonia and bronchitis. Surgical charges for acute appendicitis include both open and laparoscopic surgical charges. Annual spending was defined as the total spending for each enrollee in the year 2019, which could occur before and/or after their emergency department visit depending on the time of year of the emergency department visit.
This analysis has some limitations. First, there is a chance that we could incorrectly include non-emergency outpatient care (such as a next-day, follow up primary care appointment) in our estimate of emergency department visit costs. Secondly, when accounting for annual spending, we do not control for health status prior to the emergency department visit. Therefore, the increase in annual health spending for patients who visit the emergency department for certain conditions may be because these patients are sicker and higher healthcare utilizers at baseline, rather than specific follow-up costs incurred for the emergency department visit itself. For selecting relevant diagnoses, we only include claims in which a particular diagnosis occurs as the primary diagnosis. Third, the MarketScan database includes only charges incurred under the enrollees’ plan and do not include balance billing to enrollees which may have occurred. Lastly, our findings only represent enrollees in large group employer sponsored plans and may not be generalizable to other groups.
The Peterson Center on Healthcare and KFF are partnering to monitor how well the U.S. healthcare system is performing in terms of quality and cost.