The United States spends significantly more on healthcare than comparable countries do, and yet has worse health outcomes. Much of the national conversation has focused on spending on retail prescription drugs and insurer profits and administrative costs as key drivers of health spending in the United States. The Inflation Reduction Act, signed into law by President Biden in 2022, includes several provisions aimed at lowering the cost of these prescription drugs. While it is true that many brand-name retail prescription drugs are priced higher in the U.S. than in peer countries, health spending data indicates that other spending categories – particularly hospital and physician payments – are primary drivers of the U.S.’s higher health spending.
This brief examines the drivers of health spending and differences between the U.S. and its peers – other Organisation for Economic Co-operation and Development (OECD) nations that are similarly large and wealthy. In 2021, the U.S. spent nearly twice as much per capita on health as these comparable countries did. Most of the additional dollars the U.S. spends on health go to providers for inpatient and outpatient care. The U.S. also spends more on administrative costs, and significantly less on long-term care.
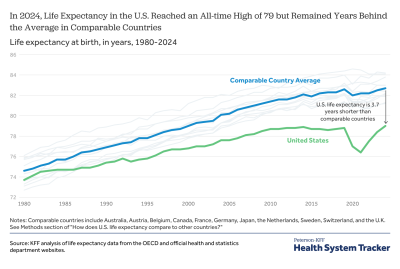
Though spending is higher in the U.S., there is little evidence that this gap is driven by higher utilization or higher quality of care. In addition to having generally worse health outcomes than peer countries, people in the U.S. are less likely to see a doctor, have a long hospital stay, and be able to make a prompt appointment for medical care. The U.S. also has fewer physicians per capita than other countries, making access to care more difficult in some areas.
The U.S. spends twice as much as comparable countries do on health, driven mostly by higher payments to hospitals and physicians.
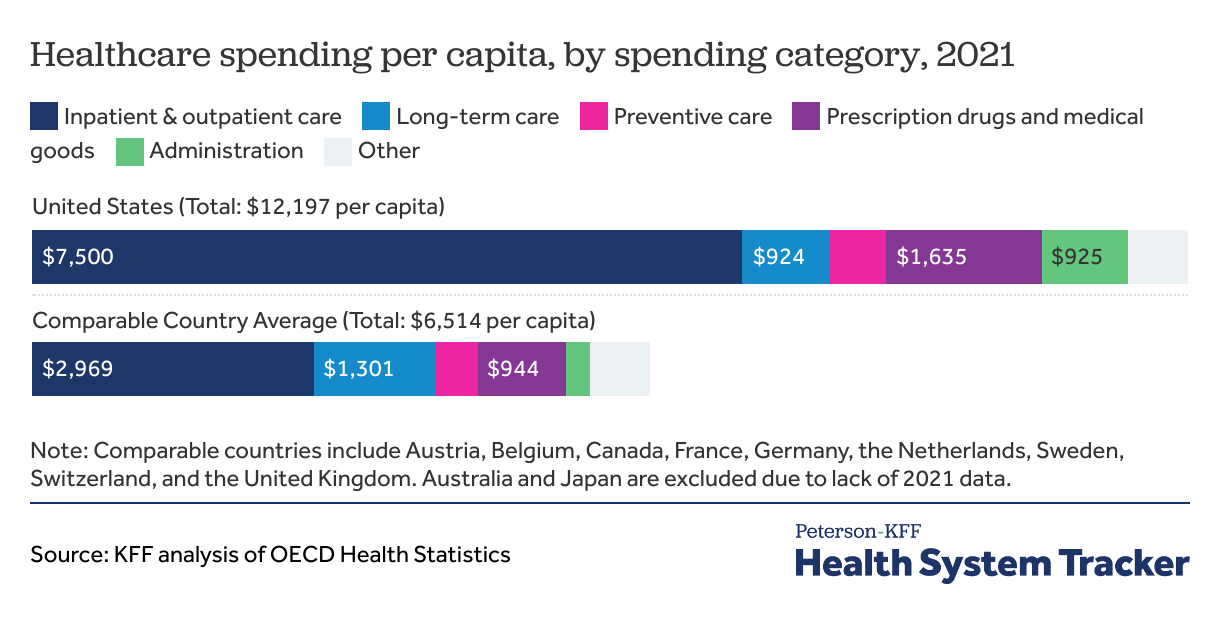
In 2021, the U.S. spent nearly twice as much on health per person as comparable countries ($12,197 compared to $6,514 per person, on average).
Related Content:

The largest category of health spending in both the U.S. and comparable countries is spending on inpatient and outpatient care, which includes payments to hospitals, clinics, and physicians for services and fees such as primary care or specialist visits, surgical care, provider-administered medications, and facility fees (see Methods for more details). Americans spent $7,500 per person on inpatient and outpatient care while comparable countries spent an average of $2,969 per person, a difference of $4,531 per person. Patients in the U.S. have shorter average hospital stays and fewer physician visits per capita, while many hospital procedures have been shown to have higher prices in the U.S. This category also includes prescription drugs administered in inpatient and outpatient settings, which may lead to higher cost in countries, such as the U.S., where these drugs have higher prices.
Similarly, many retail prescription drugs cost more in the U.S. than the same drugs do in other comparable nations. In 2021, the U.S. spent $1,635 per capita on prescription drugs and other medical goods (including retail pharmaceuticals, over-the counter drugs, as well as durable and non-durable medical equipment) while comparable countries spent $944 per capita on average, a difference of $691 per person. However, even if per capita prescription drug pricing is lowered and closer to that of comparable countries, that difference would make only a dent in the overall difference in health spending. The prescription drugs and other medical goods category also excludes all drugs and medical goods administered directly by a health care provider (those costs are generally included with inpatient and outpatient spending).
Spending on health administration is similarly much higher in the U.S. than in comparable countries: $925 compared to $245 per person, respectively, a difference of $680 per person. Administrative costs include spending on running governmental health programs and overhead from insurers, but exclude administrative expenditures from healthcare providers. This includes administrative spending for private health insurance, governmental health programs (such as Medicaid and Medicare) as well as other third-party payers and programs.
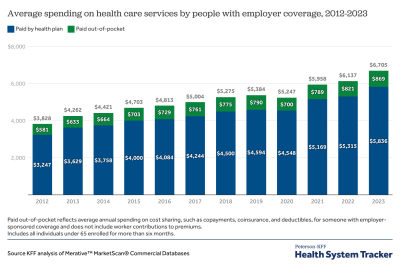
The U.S. also spends more on preventive care than peer nations – $589 compared to $426 per capita, on average, a difference of $163; activities captured in this spending category vary amongst countries, but in the U.S. it generally consists of public health activities, including preventive health programs and education for immunizations, disease detection, emergency preparedness, and more. The growth in preventive care spending between 2019 and 2021 is notable, considering the 2020 emergence of the COVID-19 pandemic. In the U.S., preventive care spending more than doubled between 2019 and 2020, from $343 to $741 per capita, but subsequently declined to $589 in 2021. Comparable countries saw two years of increases in preventive care spending, from $166 to $219 to $426 per capita from 2019 to 2021.
Meanwhile, the only category of spending in which the U.S. spends less than most comparable countries on a per person basis is long-term care, but the OECD data on U.S. long-term care spending exclude some of the largest sources of spending and are incomplete.
Spending in the “other” category includes ancillary services, and other types of care and medical goods uncaptured in the other spending categories.
The main driver of relatively high health spending in the U.S. is the cost of inpatient and outpatient care
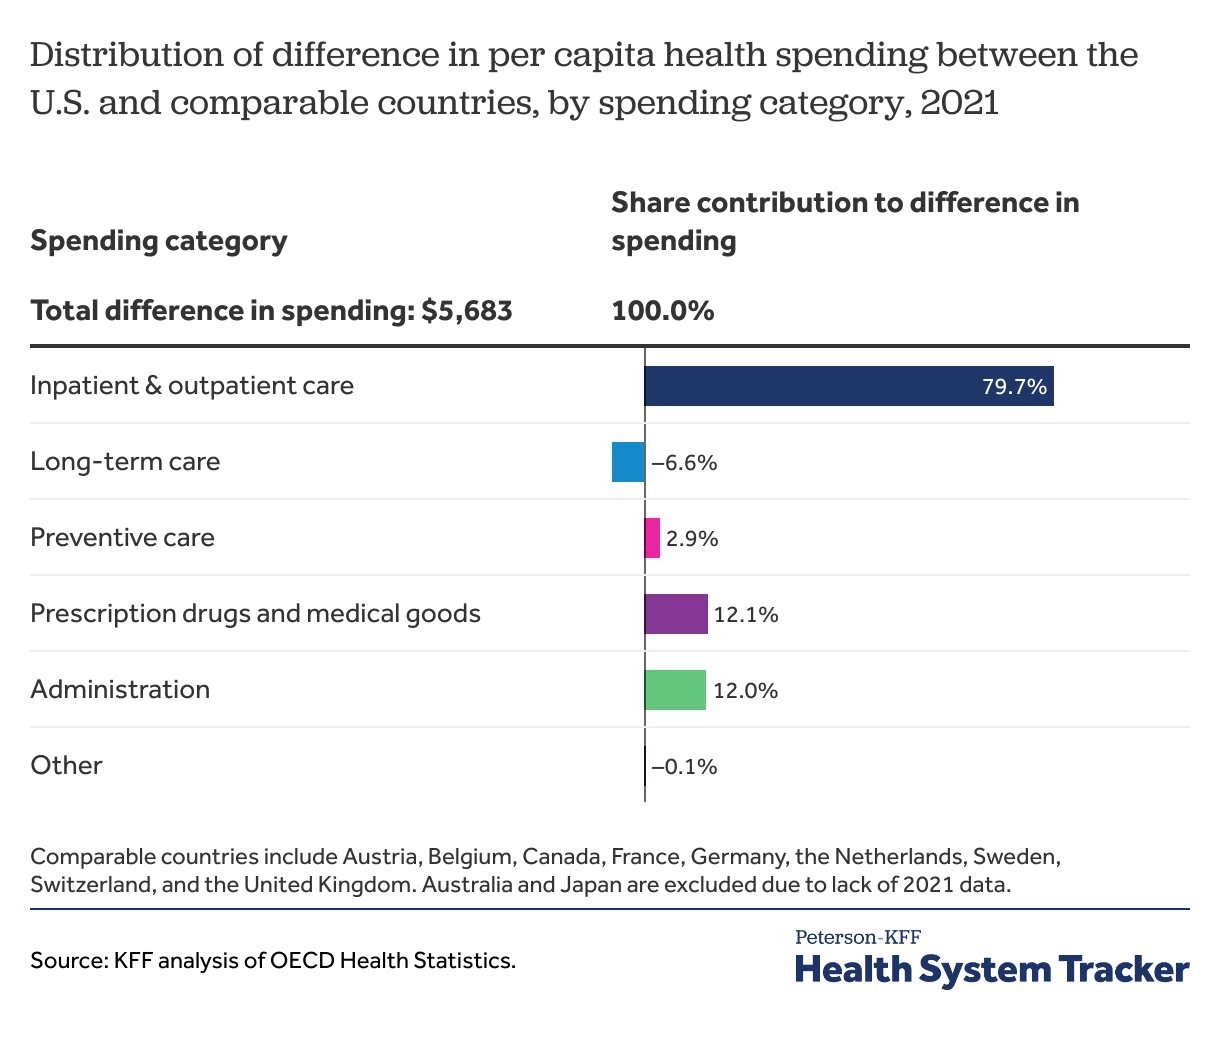
Health costs in the U.S. were $5,683 more per person than costs in similarly large and wealthy countries. The difference in spending on inpatient and outpatient care is $4,531 per person, accounting for almost 80% of the difference in spending between the U.S. and comparable countries. The U.S. spent $681 more per person on administrative costs compared to comparable countries, which represented 12% of the difference in overall spending. The additional dollars the U.S. also spent on medical goods and drugs than comparable countries accounted for 12% of the overall difference in spending.
Inpatient and outpatient care represent a greater share of health spending in the U.S. compared to peer countries
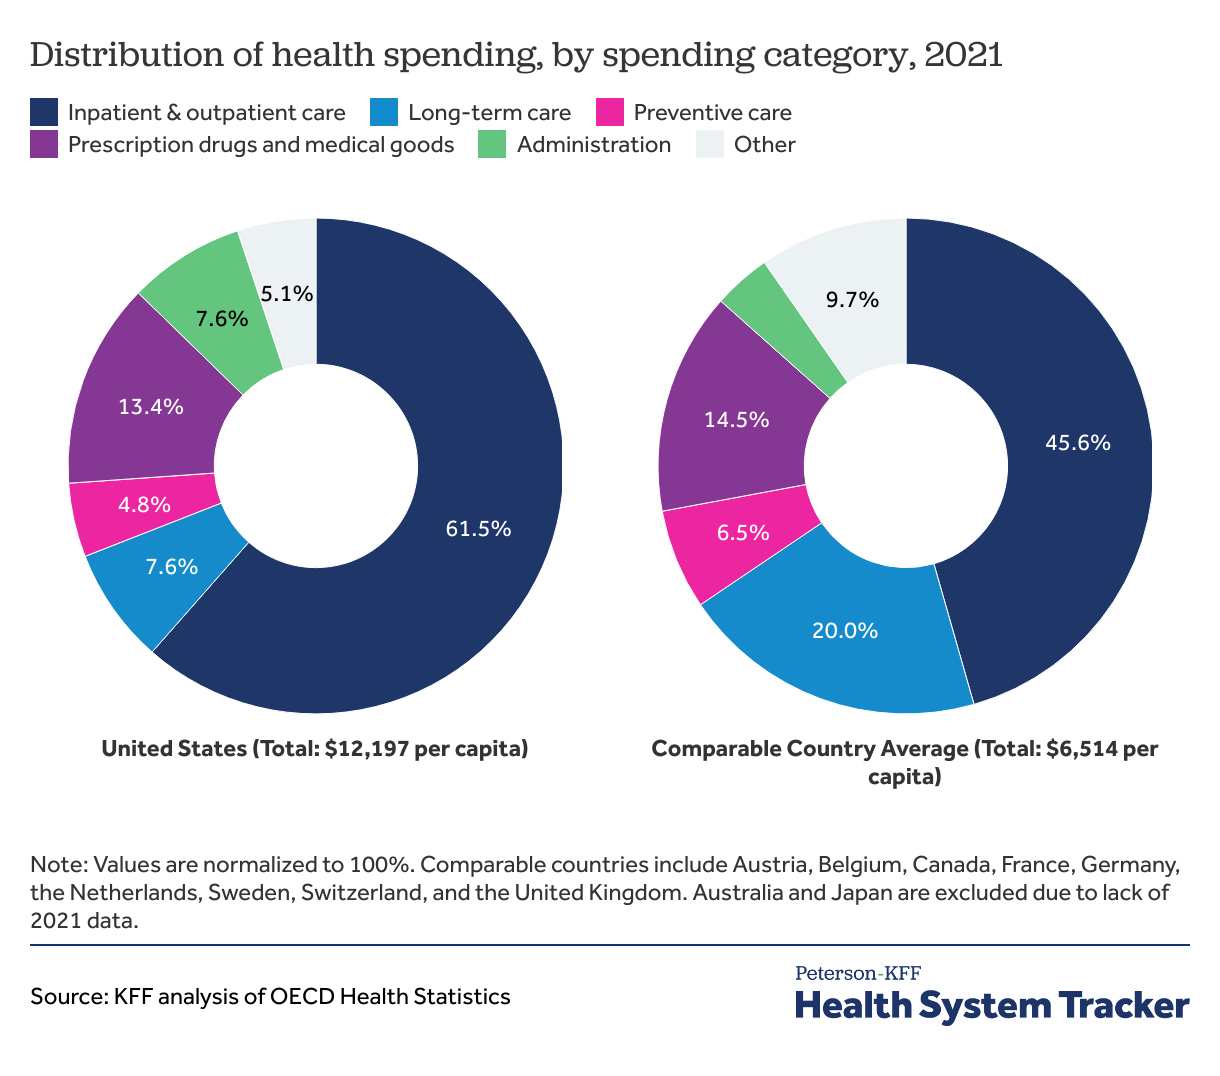
In 2021, inpatient and outpatient care represented approximately 62% of total health spending in the U.S. and 46% of spending in comparable countries, on average. Administrative costs represent about 7.6% of overall health spending in the U.S. compared to 3.8% on average in comparable countries.
Although the U.S. spends more per person on retail drugs, over-the counter drugs, and medical goods, these costs represented a slightly smaller share of total spending as compared to the comparable country average in 2021 (13.4% and 14.5%, respectively).
Over the past several years, per capita health spending has grown at similar rates for the U.S. and comparable countries, but the change in dollars is significantly different.
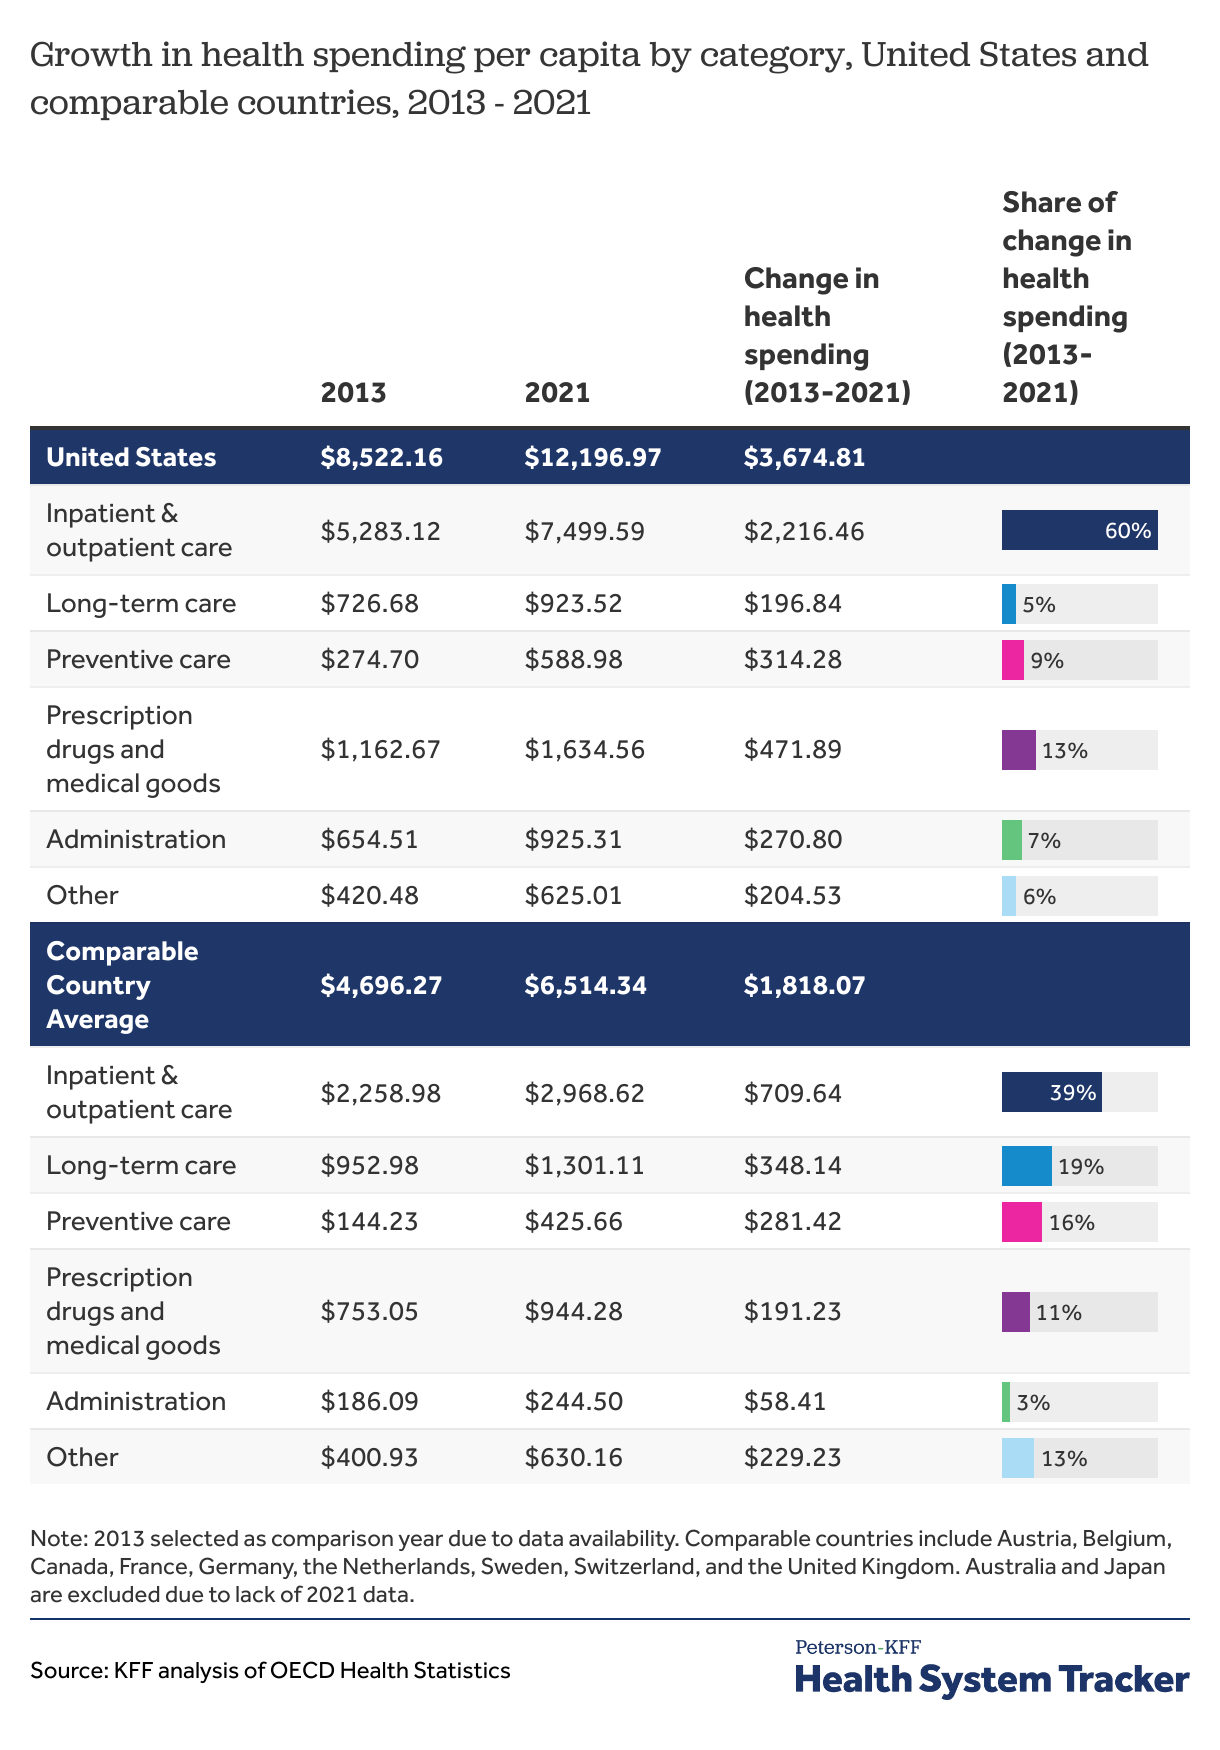
The chart above displays the change in per capita health spending in each category as a share of the overall increase in spending between 2013 and 2021. For example, increased spending on administration was the cause of 7% of spending growth between 2013 and 2021 in the U.S., but only caused 3% of spending growth in comparable countries.
In 2013, the United States spent $8,522 per capita on health, while comparable countries averaged $4,696 per capita. Between 2013 and 2021, health spending grew at a similar rate in both the U.S. and comparable countries (4.6% and 4.2% annually, respectively). However, since spending in the U.S. was significantly higher to begin with, the eight-year increase in spending in dollars was more than double in the U.S. ($3,675) than it was in peer nations ($1,818). The same is true for the growth in many specific spending categories.
In the U.S., the largest growth in terms of dollar value was for spending on inpatient and outpatient care, which grew by $2,216 per capita between 2013 and 2021 (4.5% growth annually). In the U.S. inpatient and outpatient care contributed to 60.3% of the total growth in health spending over this period. In comparable countries, the largest contributor to the growth in spending is also inpatient and outpatient care (which grew by 3.5% annually), but the dollar increase ($710 per capita) is smaller than in the U.S. and the contribution to total health spending growth was smaller (39% of total spending growth).
Notably, growth in spending on long-term care represented a far smaller share of spending growth in the U.S. versus comparable countries (5.4% vs 19.1%, respectively). Long-term care can be expensive or hard to access in the U.S. for many patients.
Methods
This brief analyzed health expenditure and financing data from the Organization for Economic Co-operation and Development (OECD) for 12 countries, including the U.S., in 2021. Data consisted of current expenditures on health expressed as per capita, current prices, current purchasing power parity (PPP), in U.S. dollars. Data in this analysis is rounded. Comparable country data was taken by averaging spending data from countries that have above median GDP and above median GDP per capita (Austria, Australia, Belgium, Canada, France, Germany, Japan, the Netherlands, Sweden, Switzerland, and the United Kingdom). Because they did not have data available for 2021, Australia and Japan were dropped from this analysis.
Current expenditures on health consisted of spending as a function of inpatient curative and rehabilitative care, outpatient curative and rehabilitative care, long-term care, ancillary services, medical goods, preventive care, governance and health system and financing administration, and other health services. In our analysis, “other” consists of other health services, ancillary services, and uncategorized spending, which is the difference between the sum of all categories and the total spending. Inpatient and outpatient care have been combined due to differences in when the same service may be performed inpatient versus outpatient depending on the country. The OECD defines outpatient care as care that “comprises medical and ancillary services delivered to a patient who is not formally admitted to a facility and does not stay overnight.” Long-term care services may be provided by hospitals, nursing homes, doctors’ offices, homes or other places. OECD data for U.S. long-term care spending exclude many of those types of spending, resulting in an underestimate of U.S. spending on long-term care services. Medical goods consist of over-the-counter drugs, retail prescription drugs, and goods used for clinical purposes, such as hearing aids, glasses, prosthetics, and medical technical devices.
The Peterson Center on Healthcare and KFF are partnering to monitor how well the U.S. healthcare system is performing in terms of quality and cost.