Browse the Latest
The Peterson Center on Healthcare and KFF are partnering to monitor how well the U.S. healthcare system is performing in terms of quality and cost.


The Health System Dashboard
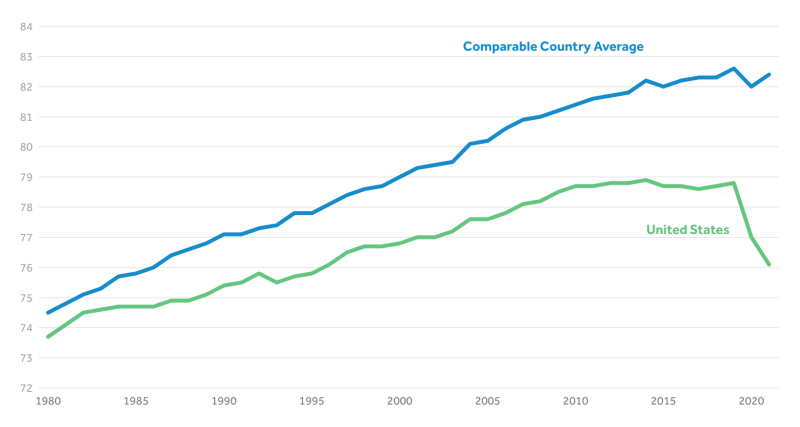
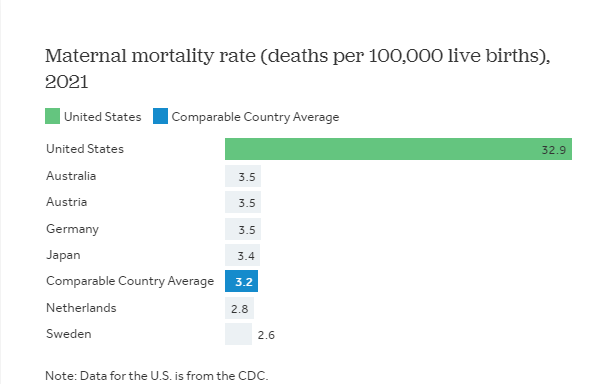
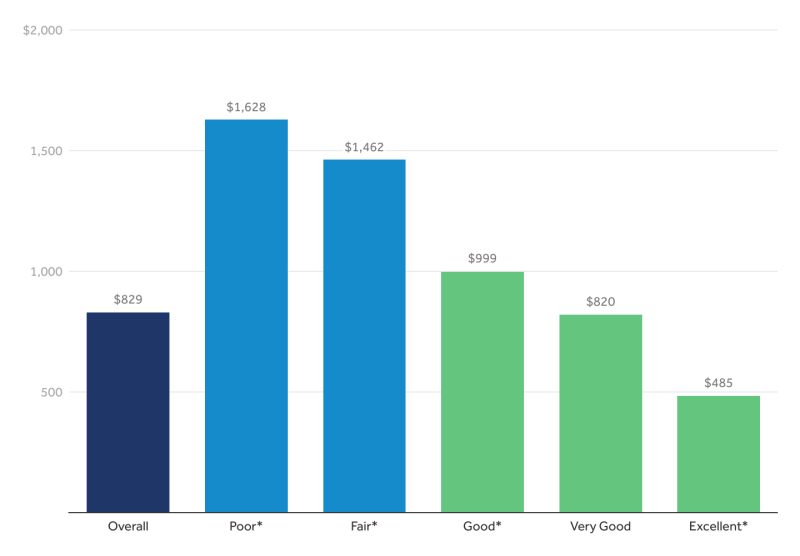
How well is the U.S. health system performing? Explore a variety of indicators of health spending, quality of care, access, and health outcomes.