An important component of most private insurance plans is the out-of-pocket (OOP) limit. These limits place an annual cap on the amount of cost-sharing (deductibles, copayments, and coinsurance) an enrollee can face for in-network covered services each year. By doing so, OOP limits provide significant financial protection for individuals who face substantial health care use in a year. Even so, these limits are typically several thousand dollars for covered workers enrolled in single coverage; families in which multiple people have health spending may face significant cost-sharing before reaching the limit.
This analysis uses economic projections to look at how the maximum allowable OOP limits may change for different types of private health insurance plans over the next decade. We show that, based on current projections, the ACA’s maximum out-of-pocket limit is likely to grow faster than wages and salaries, and is also expected to grow faster than the maximum out-of-pocket limit for HSA-qualified health plans.
How are maximum out-of-pocket limits set?
The share of covered workers enrolled in an employer-sponsored health plan with an OOP limit has grown over time, and today virtually all covered workers are enrolled in a plan which includes an OOP limit for in-network services.
The increasing share of the privately insured people covered by a plan with an OOP limit is in part a result of regulations, including the Medicare Modernization Act of 2003 and the Affordable Care Act of 2010. Starting in 2004, HSA-qualified health plans allow enrollees and employers to make tax-preferred contributions to health savings accounts (HSAs), when paired with a plan that includes a minimum deductible and has an OOP limit that did not exceed the maximum allowed by law. Over time, HSA-qualified plans have become commonplace, now covering one-fifth of covered workers. The maximum out-of-pocket limit for a single-coverage HSA-qualified health plan in 2022 is $7,050.
The ACA further expanded the prevalence of OOP limits by requiring that all non-grandfathered private health plans, including employer plans, adopt this feature for plan years starting after 2014. Under the ACA, the maximum allowable OOP limit for in-network covered services in other non-grandfathered private health insurance plans is $8,700 in 2022.
Related Content:
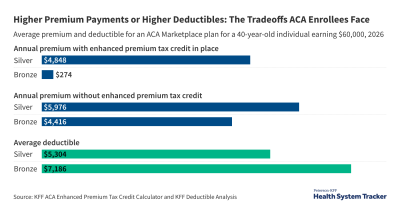
Health plans can and do set lower OOP limits than federally mandated maximums. Among covered workers with an OOP limit, the average OOP limit for single coverage is $4,272, but there is considerable variation in the size of these limits amongst those enrolled in employer-sponsored plans. In 2021, almost a quarter of covered workers had an OOP limit of more than $6,000 for single coverage. Out-of-pocket limits in the ACA Marketplace plans vary by metal level and whether the enrollee qualifies for a cost-sharing reduction based on their income. Silver plans in 2022 had a maximum OOP limit of $8,209, on average; the maximum OOP limits are much lower for those with a cost-sharing subsidy (an average of $1,208 for the lowest-income Marketplace enrollees).
How do maximum out-of-pocket limits change each year?
The maximum allowable OOP limits for HSA-qualified health plans and other private health plans increase each year. However, the two types of maximum OOP limits are pegged to separate measures and therefore grow at different rates. The maximum OOP limit for HSA-qualified plans is indexed to the overall chained-consumer price index for all urban consumers (chained-CPI-U). The ACA maximum OOP limit, which applies to other non-grandfathered private health plans, is instead inflated by the growth of employer-sponsored health insurance premiums as determined by the National Health Expenditure Accounts.
Historically, the growth in employer-sponsored health insurance premiums has outpaced general economic inflation. When the ACA’s maximum OOP limit went into effect in 2014, it was set at the same amount as that for HSA-qualified health plans, which was $6,350 for single coverage and $12,700 for family coverage. Differences in the indexing methodology have led to a growing gap in the maximum OOP limits for these two types of plans. In 2022, HSA-qualified health plans are required to have an OOP limit of $7,050 or less for single coverage, compared to $8,700 or less for other non-grandfathered private plans.
How much will maximum out-of-pocket limits grow in the future?
Using projections provided by the Congressional Budget Office (CBO) and Centers for Medicare and Medicaid Services’ (CMS’) National Health Expenditure Accounts, we look at how these limits may grow over time. Given employer-based health insurance premiums are projected to increase faster than workers’ wages, enrollees in private health plans hitting their OOP limit would be committing a larger share of their income to out-of-pocket costs in the coming years.
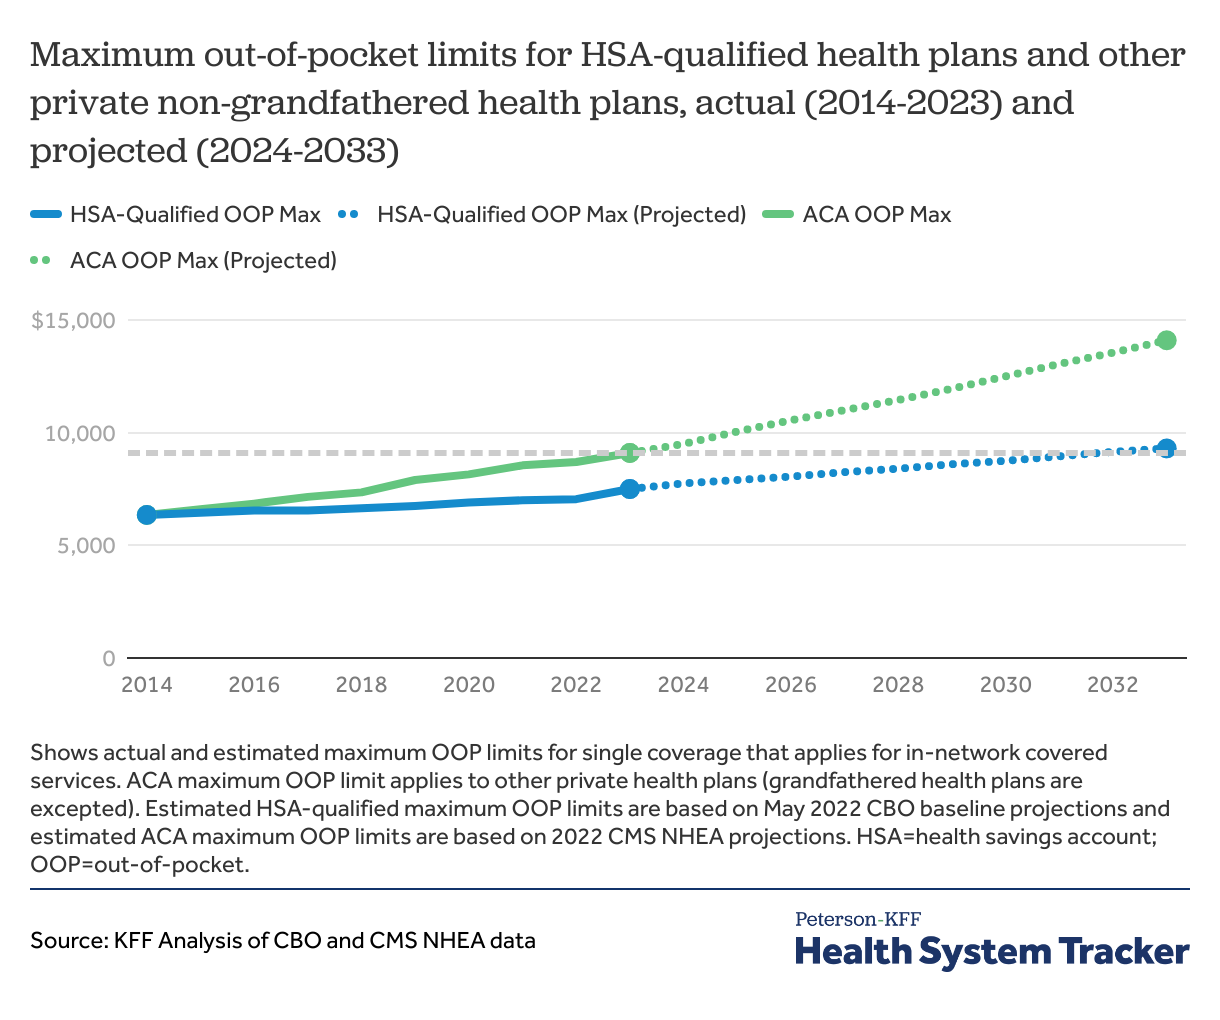
While during recent months overall inflation has been growing at over 8% over last year, the CBO recently projected that chained-CPI-U will grow at roughly 2% per year over the next decade. If these projections hold the maximum OOP limit for HSA-qualified plans will grow to $8,750 by 2030 for single coverage.
By contrast, CMS projects that employer-based health insurance spending will grow over 4% per year during the period. If these estimates hold, the ACA maximum OOP limit for other non-grandfathered private health plan single coverage will be $12,500 in 2030, which is over 40% higher than the maximum OOP limit for HSA-qualified plans in 2030.
The ACA maximum out-of-pocket limit is expected to grow faster than the limit for HSA health plans
There is considerable uncertainty in economic forecasts, making future OOP limits hard to estimate. In recent months, overall prices have grown at relatively high levels and at a faster pace than prices for health services. How overall prices and employer-based health insurance premium grow in the coming months and years will determine at what level future maximum OOP limits are set. Over time health insurance premiums have grown faster than inflation, a trend predicted to continue, even if the exact levels cannot be precisely estimated.
How does growth in maximum out-of-pocket limits compare to growth in wages?
Wages and salaries have outpaced growth in out-of-pocket limits for HSA-qualified plans, but the ACA maximum out-of-pocket limit is growing faster than wages. By next year, the ACA maximum OOP limit for other non-grandfathered private health plans will have increased 43% from $6,350 in 2014 to $9,100 in 2023. By comparison, the maximum OOP limit for HSA-qualified health plans will have grown by 18% from $6,350 in 2014 to $7,500 in 2023. Meanwhile, wages and salaries are expected to grow by 31% over the same period.
The ACA’s maximum out-of-pocket limit is growing faster than wages and salaries
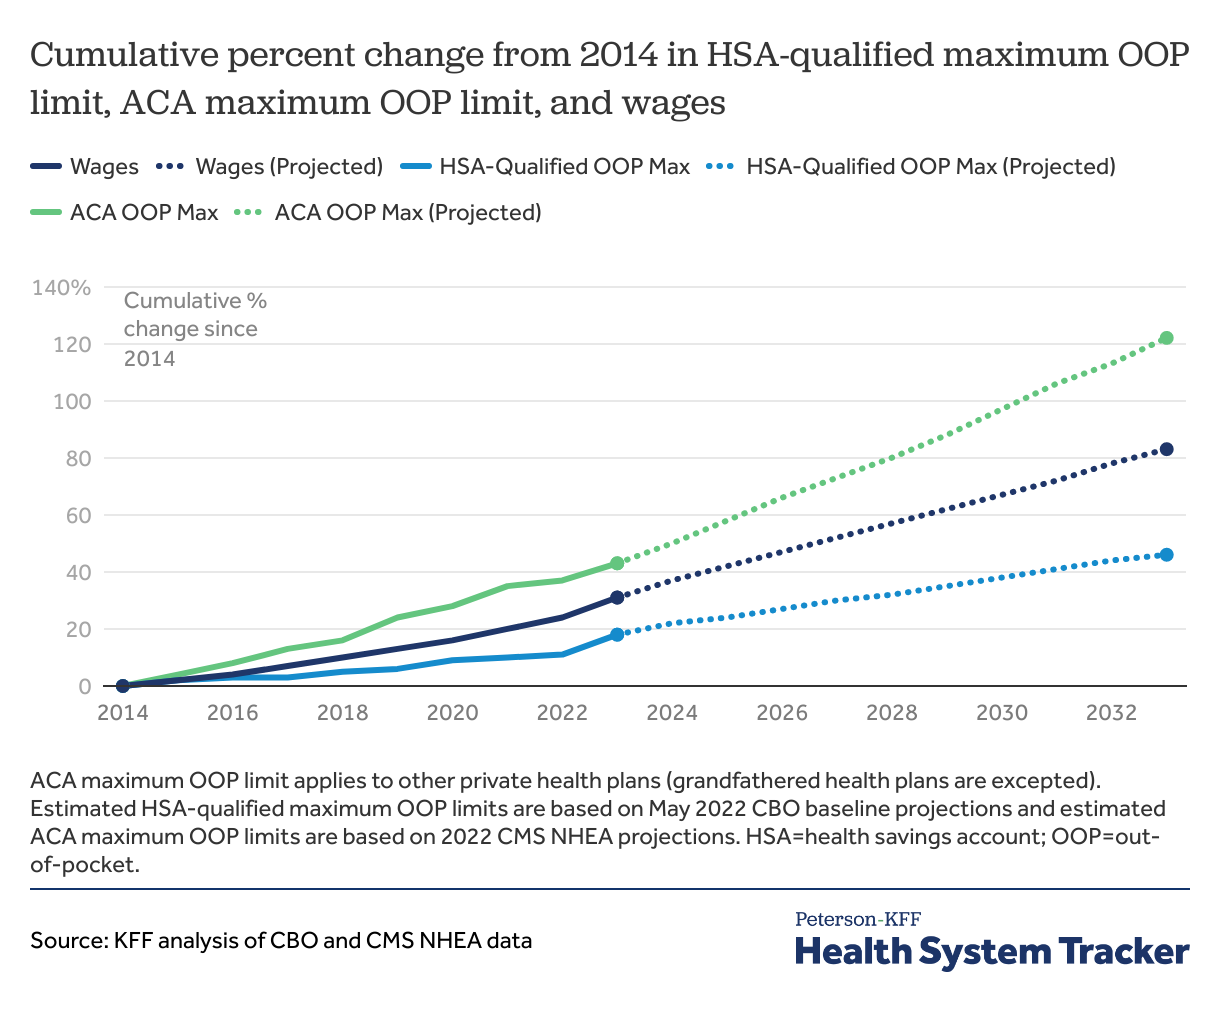
Between 2014 and 2033, CBO expects wages to grow by 83%, while we project that the ACA’s maximum OOP limit will grow by 122% over the same period.
Discussion
Over time, pegging the growth of the ACA’s maximum out-of-pocket limit to health spending means that enrollees who are subject to the maximum allowable out-of-pocket limit may have to commit a larger share of their income to their out-of-pocket health costs. By contrast, pegging growth in HSA-qualified plan’s OOP limits to prices in the economy results in a slower level of growth over time.
Our finding that the ACA’s maximum out-of-pocket limit is rising faster than wages has implications for affordability of health care, particularly for those with higher levels of health spending. An out-of-pocket limit is a significant financial protection for enrollees who face high cost-sharing and have high health care needs by limiting how much enrollees must pay in coinsurance, copayments, and deductibles. However, as out-of-pocket limits grow, and particularly as they outpace wages and salaries, they offer less protection. Our previous analysis found that many households with private health insurance coverage do not have sufficient savings to meet the typical OOP limits in employer-based and ACA Marketplace plans.
One potential policy option to address affordability for people with significant health care needs would be to reduce the ACA’s maximum out-of-pocket limit or to change the way it is indexed to bring it down over time. However, that could come with its own set of trade-offs arising from how the out-of-pocket limit interacts with other aspects of the ACA. In particular, the ACA requires plans sold to individuals and in the small group market to meet actuarial value standards within each metal level. For example, a silver plan should generally cover about 70% of the total health costs for a population, while the plan’s enrollees pay the remaining 30% out of their own pockets. If the plan’s out-of-pocket maximum is lowered, then insurers would need to adjust cost-sharing (deductibles, copayment, coinsurance) in order to maintain the same actuarial value. With a lower out-of-pocket limit, sicker people (or those who need significant health care and hit their OOP limit) would save money, while healthier people (or those who do not hit their OOP limit) would pay more than they currently do.
The diverging growth rates for these maximum out-of-pocket limits has a two-fold implication for the cost of private health plans. On one hand, enrollees with HSA-qualified health plans (who hit their OOP limit) have more financial protection from in-network cost sharing at the point of care over time. On the other, HSA-qualified private health plans will not be able to shift as much of the total costs to enrollees with a lower maximum OOP limit. That means, HSA-qualified health plan premiums will rise faster than for other non-grandfathered private health plans. Premium costs are shared with employers, while out-of-pocket cost sharing is paid almost entirely by enrollees. Lowering maximum out-of-pocket limits helps people with significant health needs, but it does nothing to lower overall health system costs paid by society.
Methods
Current Year Historical Data and Economic Projections reflect the Congressional Budget Office’s estimates as of May 2022. Wages and salaries are based on the employment cost index as described here. Projections of employer-sponsored Insurance (ESI) are from CMS’s National Health Expenditure Accounts, Table 17. ESI cost growth for 2031 and 2032 is estimated based on prior year growth projections.
The Peterson Center on Healthcare and KFF are partnering to monitor how well the U.S. healthcare system is performing in terms of quality and cost.