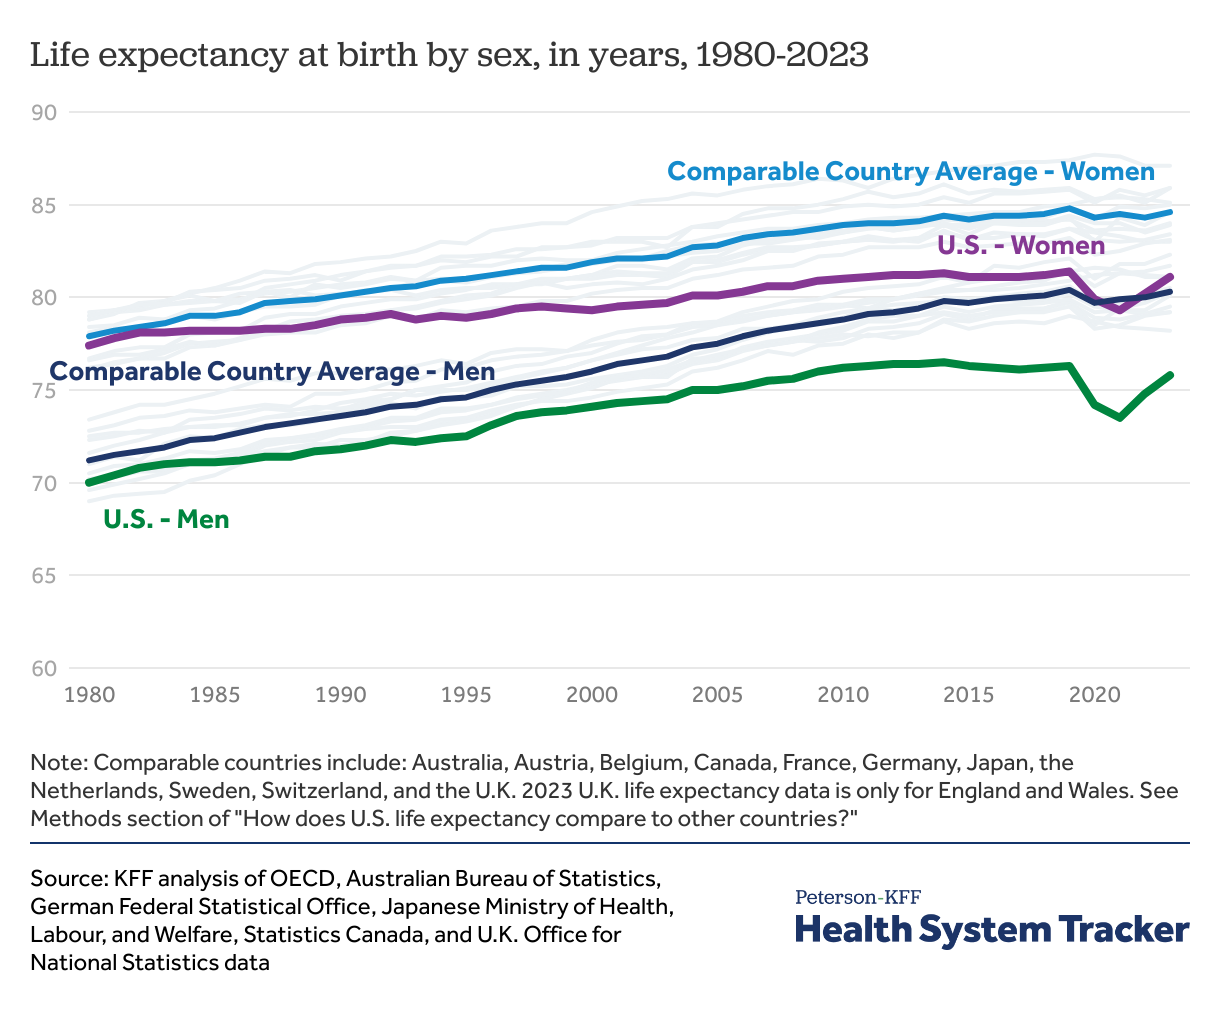
Between 2019 and 2022, the U.S. experienced a sharper decline and a slower rebound in life expectancy than peer countries, on average, due to increased mortality and premature death rates in the U.S. from the COVID-19 pandemic. Updated life expectancy estimates in this chart collection show that in 2023, life expectancy in the U.S. returned to pre-pandemic levels, but remains lower than that of comparable countries.
This chart collection examines how life expectancy in the U.S. compares to that of other similarly large and wealthy countries in the Organisation for Economic Co-operation and Development (OECD). The countries included in the comparison are Australia, Austria, Belgium, Canada, France, Germany, Japan, Netherlands, Sweden, Switzerland, and the United Kingdom.
Life expectancy at birth in the U.S. increased 0.9 years from 2022 to 78.4 in 2023. In comparable countries, life expectancy was 82.5, which is, on average, 4.1 years longer than the U.S., reflecting a persistently wide difference in life expectancy between the U.S. and comparable countries.
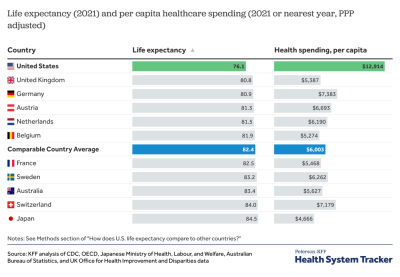
The U.S. has the lowest life expectancy among large, wealthy countries while it far outspends its peers on healthcare Share on XIn 2023, U.S. life expectancy nearly returned to pre-pandemic levels, but still lagged behind comparable countries
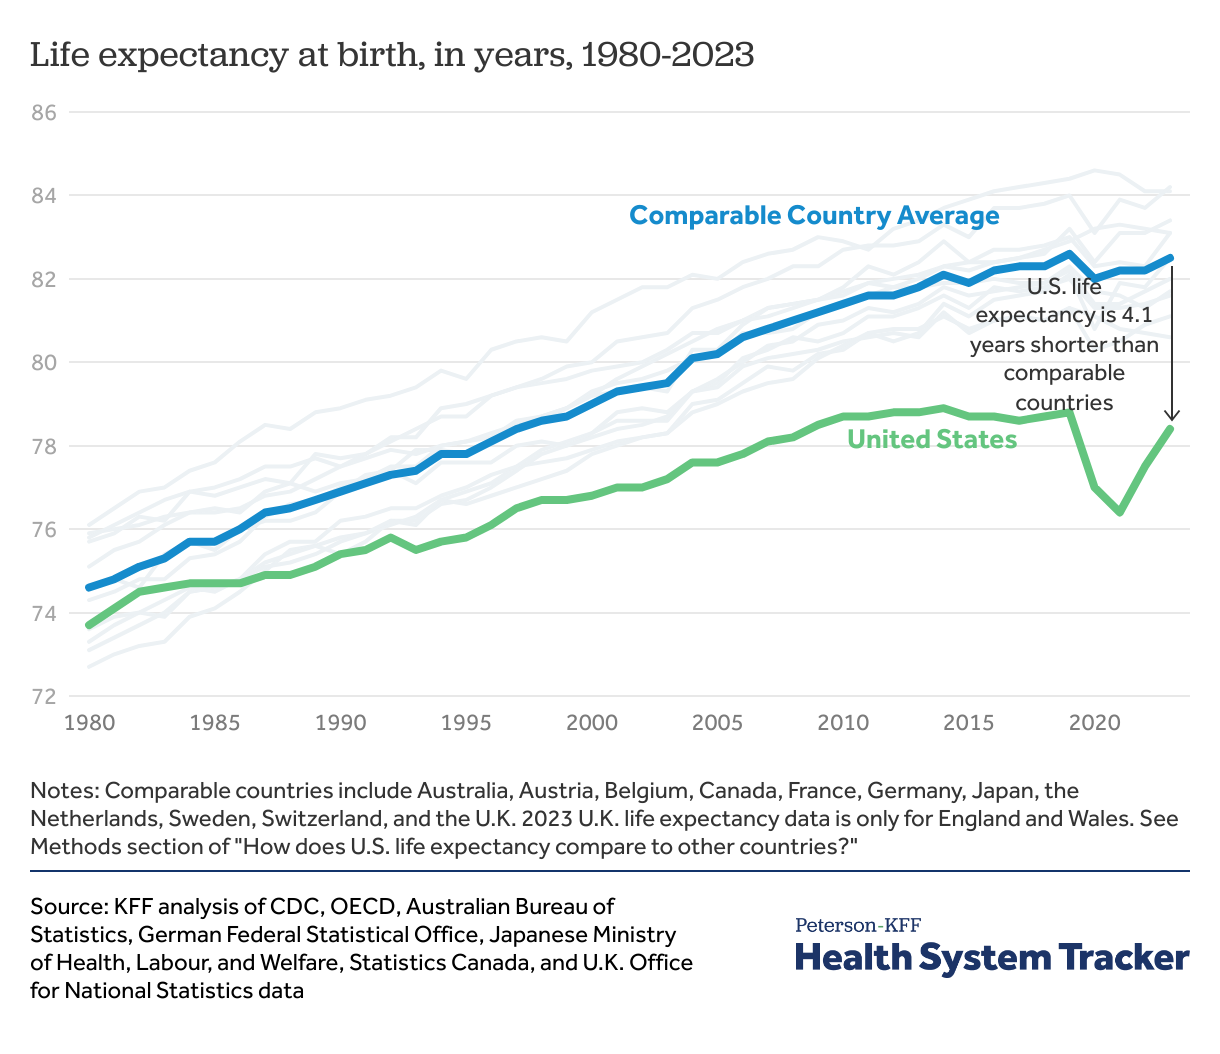
Life expectancy in the U.S. and peer countries increased from 1980 to 2019 but decreased in 2020 due to the COVID-19 pandemic. In 2021, life expectancy at birth began to rebound in most comparable countries while it continued to decline in the U.S. During this period, the U.S. had a higher rate of excess mortality per capita and a larger increase in premature mortality per capita than peer countries as a result of COVID-19. In 2022, life expectancy started to rebound in the U.S. while it stabilized in peer countries.
In 2023, life expectancy at birth in the U.S increased to 78.4 years, up 0.9 years from 77.5 years in 2022, which was still lower than pre-pandemic estimates of 78.8 years in 2019, and 4.1 years below the comparable country average of 82.5. Life expectancy varies considerably within the U.S., though life expectancy in all U.S. states falls below the average for comparable countries.
Related Content:
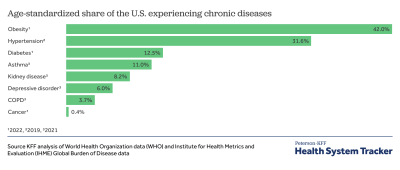
U.S. and other country life expectancy growth in 2023 was mostly driven by a decline in COVID-19 mortality. The U.S. has experienced stagnant life expectancy growth for decades. Between 2010 and 2019, life expectancy in the U.S. only grew by 0.1 years compared to an average increase of 1.2 years in peer countries, partially due to higher mortality rates for suicides and overdoses, as well as the increasing burden of chronic diseases like diabetes, kidney, and liver disease.
Among peer countries, the U.S. has the lowest life expectancy at birth for both women and men
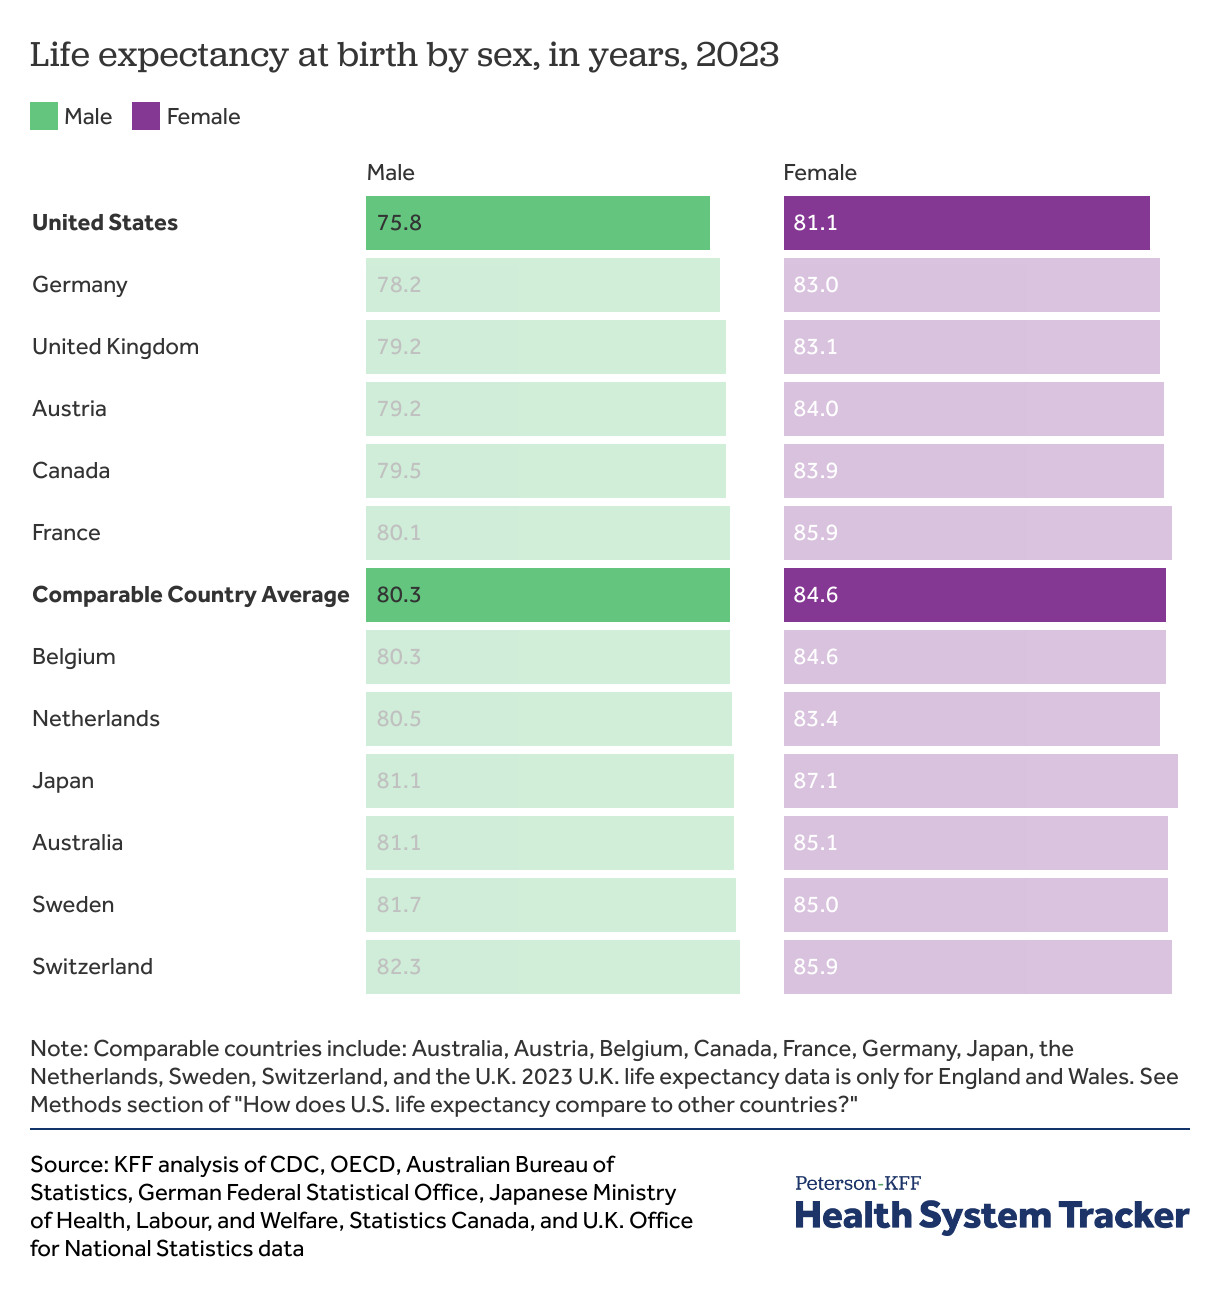
In the U.S. and all other comparable countries, women tend to live longer than men. However, the U.S. ranks lowest in life expectancy for both men and women among countries with high GDP per capita.
The life expectancy gap between men and women is wider in the U.S. than in comparable countries
Between 2022 and 2023, life expectancy at birth for men increased by 1.0 year in the U.S. and increased by 0.3 years in comparable countries, on average. Life expectancy at birth increased by 0.9 years for women in the U.S. and increased by about 0.3 years for women in comparable countries, on average. Despite these larger increases, both men and women have lower life expectancy in the U.S. than in all other countries.
The gap in life expectancy between women and men in the U.S. remains wider than the gender gap in comparable countries. From 2019 to 2021, the life expectancy difference between men and women increased from 5.1 years to 5.8 years in the U.S. and from 4.3 years to 4.6 years in comparable countries due to COVID-19. Despite U.S. life expectancy returning to pre-pandemic levels in 2023, the life expectancy gap between women and men is still 5.3 years, and the average gap in comparable countries declined to 4.3 years.
The disparity in life expectancy between the U.S. and peer countries persists at older ages
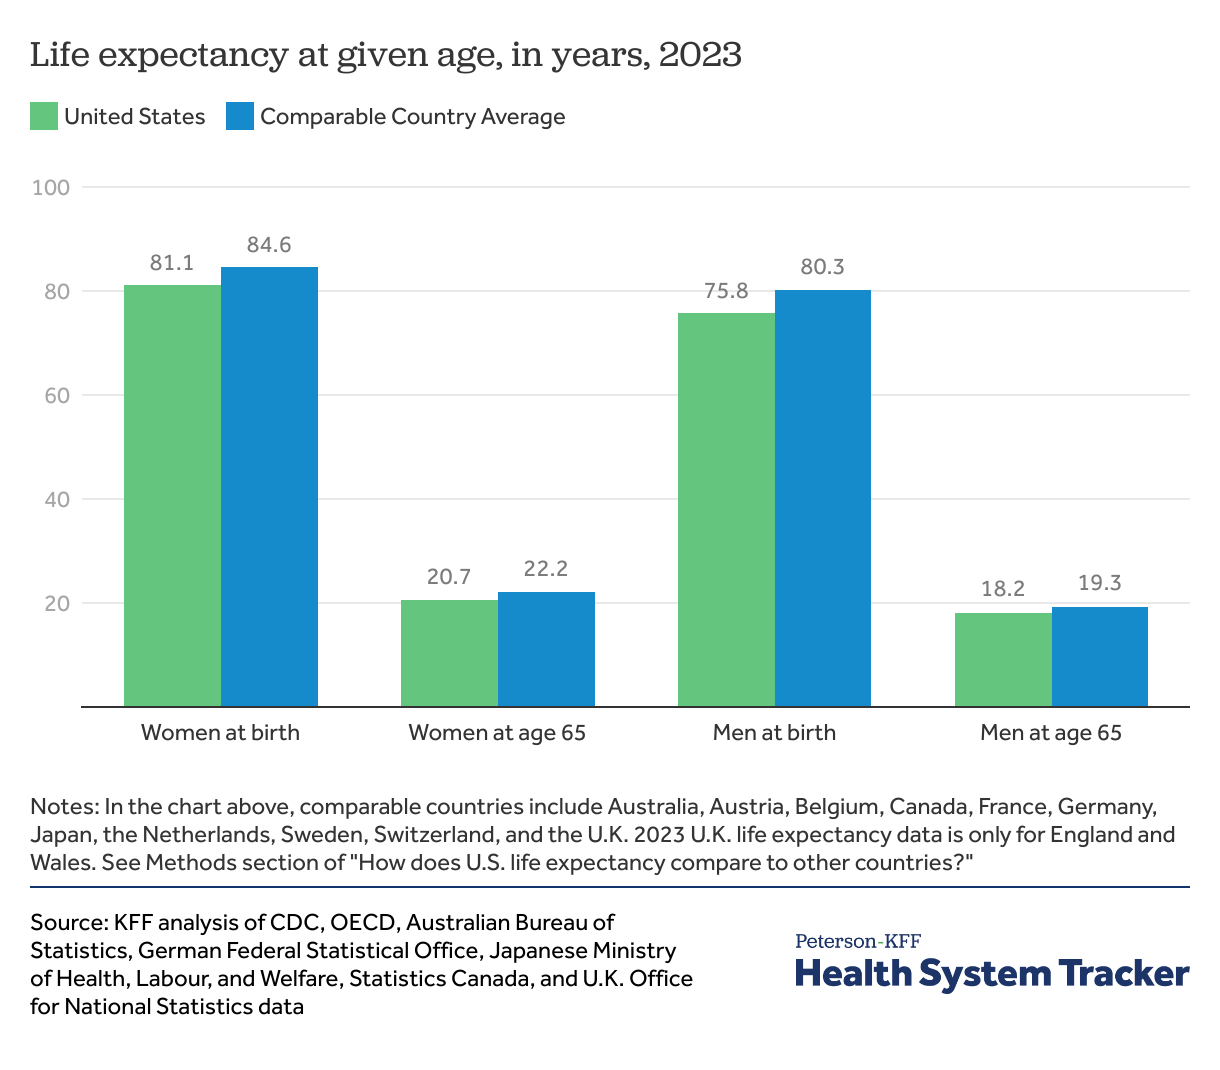
Since most people start to interact with the healthcare system more regularly as they get older, measuring life expectancy at older ages may provide a better sense of how well the health system performs (though it is still influenced by how healthy people are when they reach older ages). The disparity between the U.S. and comparable countries for women became more pronounced at older ages. In 2023, comparable country average life expectancy exceeded life expectancy in the U.S. by 4.3% at birth, and 7.2% at age 65 for women and from 5.9% at birth to 6.0% at age 65 for men.
The U.S. has the lowest life expectancy among large, wealthy countries while outspending its peers on healthcare
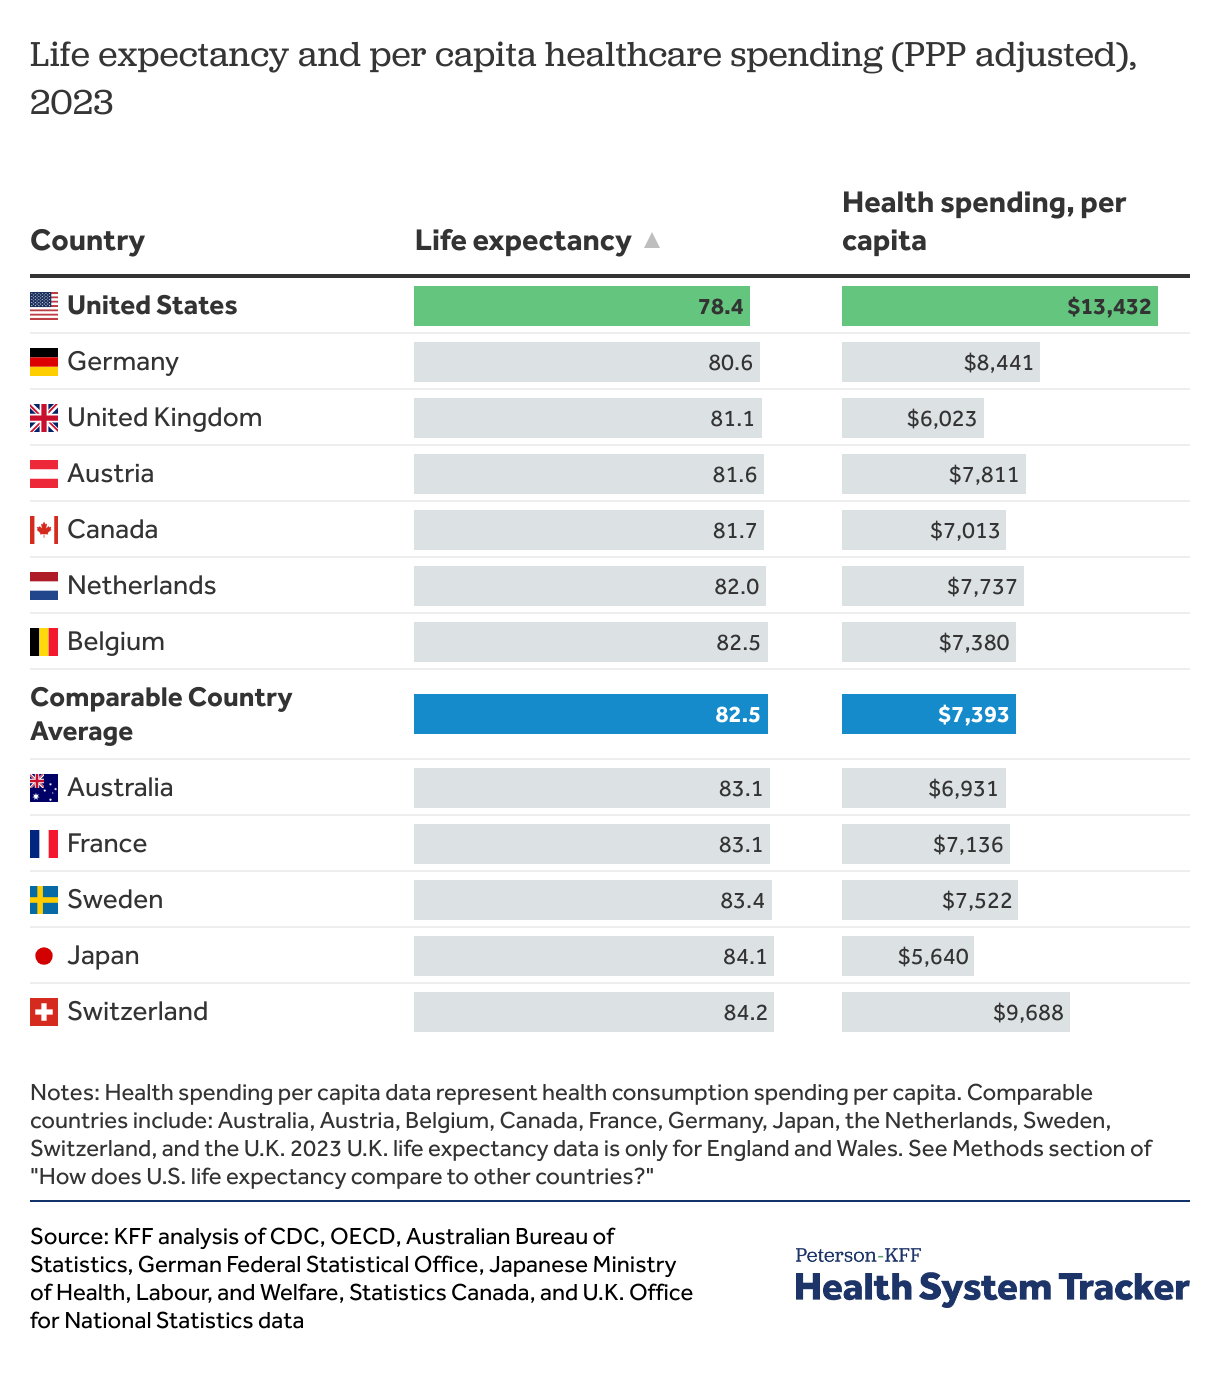
On a per person basis, U.S. health spending is nearly double that of similarly large and wealthy nations, on average. In 2023, the U.S. spent over $3,500 more per capita on healthcare than the next highest spending country, Switzerland. Meanwhile, the U.S. has the lowest life expectancy among peer countries.
Both life expectancy and health spending may be influenced by factors outside of the health system, such as income inequality, investments in social services, and other socioeconomic factors.
In 1980, the U.S. and comparable countries had similar life expectancies and health spending, but the trends have diverged in the last few decades

Among peer nations, the U.S. has the highest per person healthcare spending, reaching an estimated $13,432 per capita in 2023. However, the higher spending on healthcare in the U.S. did not translate into longer lifespans. Healthcare spending has grown faster in the U.S. than in peer countries, while life expectancy grows more slower in the U.S. than in peer countries.
Methods
Life expectancy data in this analysis were gathered from the CDC; the OECD, the Australian Bureau of Statistics; the German Federal Statistical Office; the Japanese Ministry of Health, Labour, and Welfare; Statistics Canada; and the U.K. Office for National Statistics. 2023 life expectancy data for all countries are either estimated or provisional. Numbers on charts may not average to the comparable country average due to rounding. OECD life expectancy data is unavailable for Australia in 1980. OECD life expectancy data have a break in series for Canada in 1980, Switzerland and Belgium in 2011, and France in 2013. Life expectancy data for Canada for both 2022 and 2023 come from Statistics Canada. 2023 life expectancy data for the U.K. are estimates for England and Wales. Total life expectancy estimates in 2023 for Australia, Germany, Japan, and the U.K. are simple averages of life expectancy estimates for males and females.
The life expectancy data presented here are period life expectancy estimates based on excess mortality or the observed mortality rate in a given year compared to previous years. Period life expectancy at birth represents the mortality experience of a hypothetical cohort if current conditions persisted into the future and not the mortality experience of a birth cohort. On the other hand, cohort life expectancy estimates, or estimates of how long people born in a year are expected to live, are a combination of historical and projected mortality rates for a birth cohort with the assumption that mortality rates will improve in the future. As a result, cohort life expectancy estimates are higher than period life expectancy estimates and less reflective of changes in mortality in the present.
Health spending data in this analysis were gathered from the OECD for all countries. For health spending data, the 1991 data point for Germany was unavailable; from 1980-1990, health spending data in France was only available for 1980, 1985, and 1990. Therefore, data for France was only shown from 1990 onward. OECD health spending data have a break in series for Austria in 1990 and 2004; Belgium in 1995 and 2003; France in 1995, 2003, 2006, and 2013; Germany in 1992; Japan in 2011; the Netherlands in 1998; Sweden in 1993 and 2011; Switzerland in 1995; and the United Kingdom in 1997. 2023 health spending data for all countries were either estimated or provisional.
The Peterson Center on Healthcare and KFF are partnering to monitor how well the U.S. healthcare system is performing in terms of quality and cost.