Health insurance premiums for those with employer coverage are typically shared between the employer and enrollee. In addition to these premium contributions, most enrollees also face out-of-pocket costs, such as copayments, coinsurance, and deductibles, when they use health care services. Plans vary in the extent to which enrollees are required to pay out of pocket and often use cost-sharing to encourage enrollees to consider their health care use or, in some cases, to choose preferred providers. Taken together, premium contributions and cost-sharing can represent a significant share of household income, particularly for lower-wage households or those who use more health care services.
Over the past decade, cost-sharing, referred to here as the out-of-pocket portion of household health spending, has grown faster than both workers’ wages and general inflation for those with employer coverage. In recent years, there has been a shift in which cost-sharing is now growing at a rate more similar to inflation.
This chart collection examines the most recent available trends in employee spending on deductibles, copayments, and coinsurance from 2012 to 2023 using a sample of health benefit claims for individuals under 65 from the Merative™ MarketScan® Commercial Databases with coverage for at least six months. Health care claims data show how much people pay when they use medical services. This provides additional insight into the spending patterns of enrollees in employer-sponsored health plans and beyond just the cost-sharing required by their plan.
Total annual health spending by, and on behalf of, a family of four with employer coverage tops $29,000 in 2024
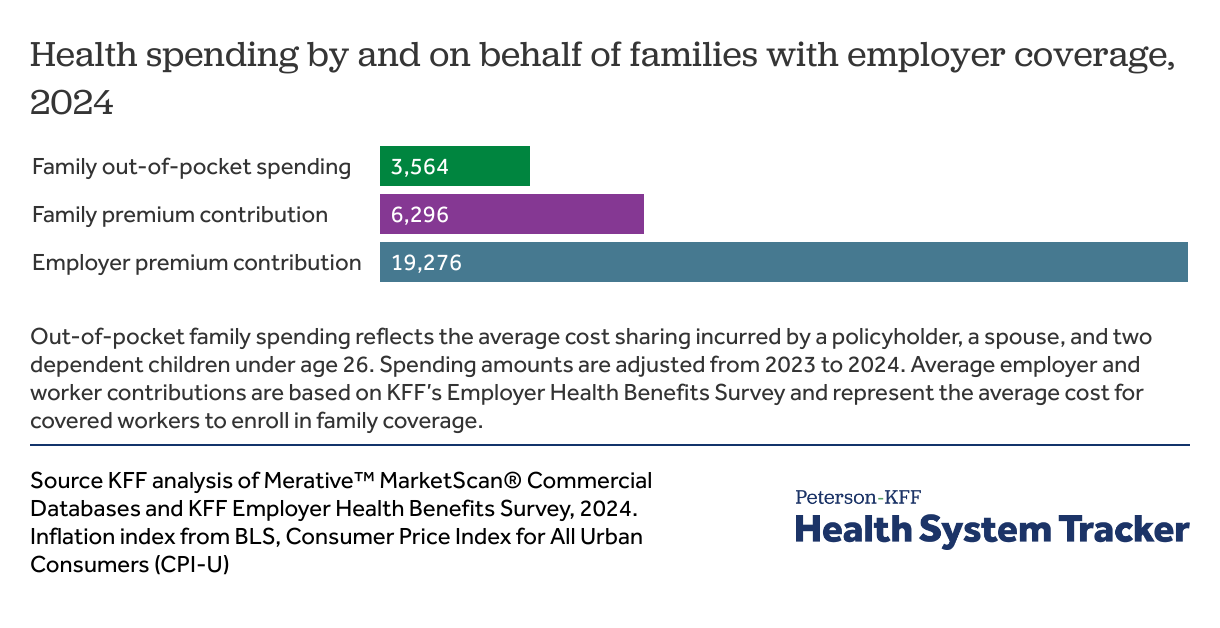
KFF’s Employer Health Benefits Survey has tracked changes in the cost of employer-sponsored health insurance for more than two decades. In 2024, the average annual premium for family coverage was $25,572, with covered workers contributing $6,296 and employers contributing $19,276. On average, covered workers paid $1,368 to enroll in single coverage.
Beyond premiums, families also face out-of-pocket costs when they use health care services. Using health care claims, we can estimate how much is paid for by plans and as out-of-pocket expenses. On average a family of four with a policyholder, spouse, and two children incurred $3,564 in out-of-pocket spending.
If this family paid the average worker contribution towards premiums and faced average out-of-pocket costs, their total health spending would be $29,136, of which $9,860 would be paid for directly from the family in premium contribution and out-of-pocket costs. While covered workers contribute about 25% of the premium for family coverage on average, this family would ultimately pay 34% of their total health spending once out-of-pocket expenses are accounted for. Both the amounts that workers contribute to enroll in coverage and the amount of cost-sharing that a family spends vary tremendously. In particular, many households have relatively low cost-sharing, and others face higher spending following a health episode.
While the relative contributions of employers and employees have been steady over time, recently, employers have begun paying a higher percentage of the overall premium, such that employers paid 75% for family coverage in 2024, up from 71% the year before. Employers pay a larger share of individual coverage, on average paying 84% of the health insurance premium.
Cost-sharing in employer plans
Using claims data, this analysis considers the average per-person out-of-pocket spending on deductibles, copayments, and coinsurance when enrollees use health care services. The growth and distribution of out-of-pocket costs has received considerable attention in recent years, particularly whether rising deductibles have created affordability challenges for low-wage households or for enrollees with greater health care needs.
Related Content:
Over the last ten years the average general annual deductible for single coverage for workers in plans with a deductible rose from $1,217 to $1,787. While some services, such as preventive care, are required to be covered before the deductible is met, the growth in deductibles means that enrollees must face larger up-front costs before the plans covers most services. Once the deductible is met, most enrollees continue to share costs through copayments and/or coinsurance paid at the time of care. Copayments are a specified dollar amount, while coinsurance is a percentage of the charge for services.
How enrollees pay cost sharing influences how people anticipate and manage health costs throughout the year. On average, spending on deductibles tends to spike early in the year and subsides after people with several health care visits meet their deductible. On the other hand, enrollees may incur copayments and coinsurance more consistently throughout the year, depending on the frequency and type of services they use. Some enrollees may also have additional spending such as on out-of-pocket payments for non-covered services or balance-billing payments to health care providers for out-of-network services.
Average annual spending on health care reaches $6,705 per person, among people with employer coverage
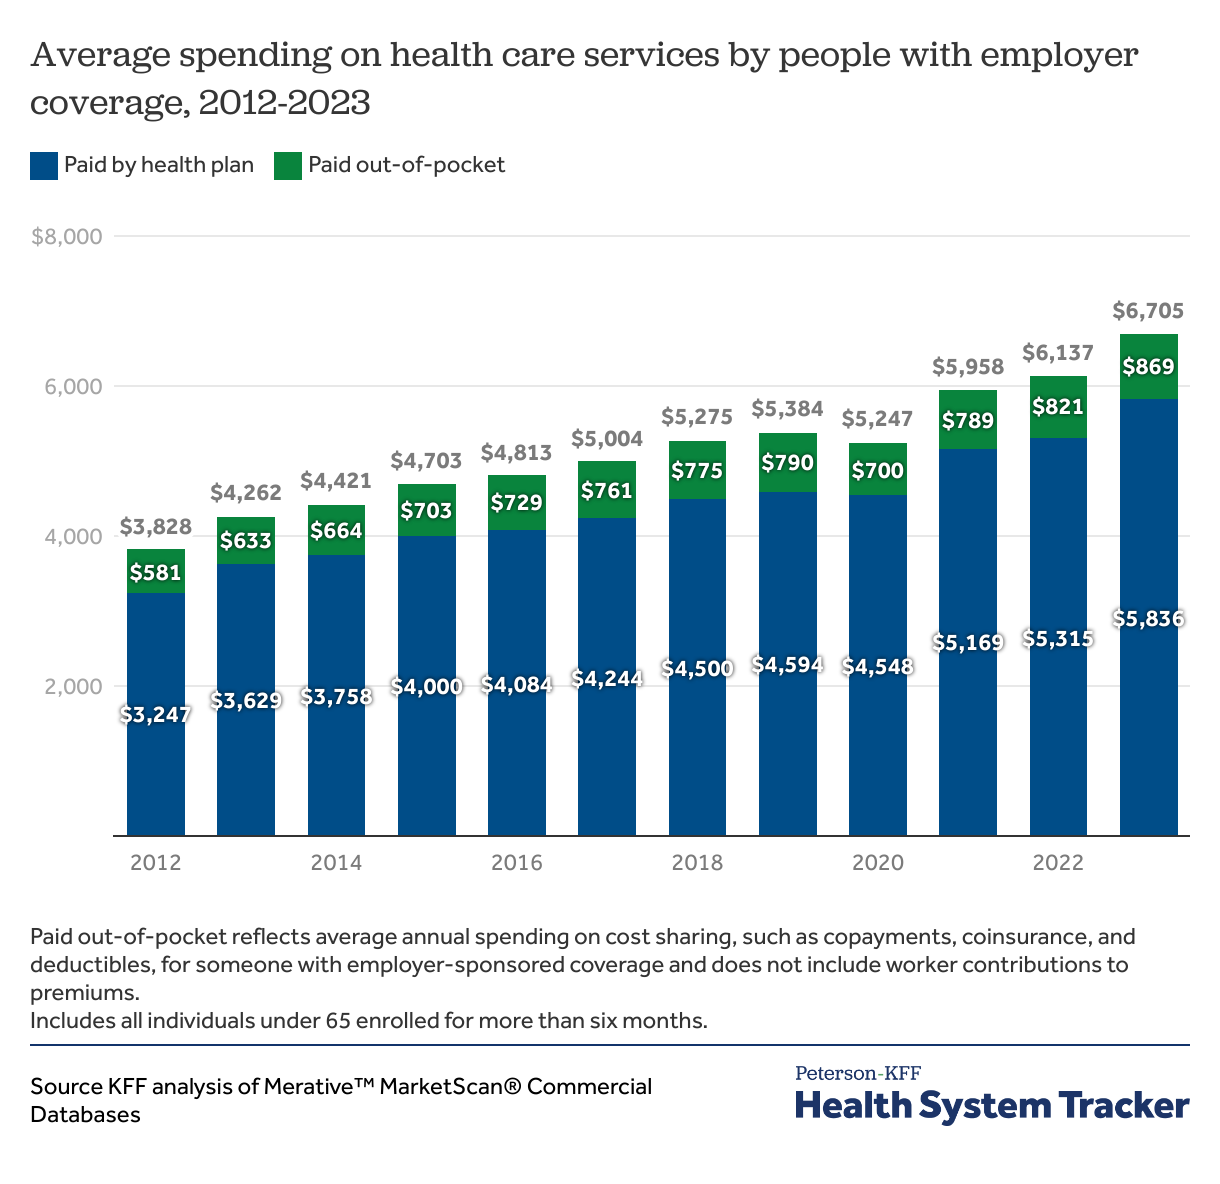
Overall, the average combined health spending for an individual with an employer plan has trended upwards. This amount reflects both the amount paid by the enrollee in cost-sharing at the point of service, as well as the cost paid for by the plan. Over the last decade, total annual health costs have increased 75% from $3,828 to $6,705. During the same period, spending by insurance plans rose by about 80%, from $3,247 to $5,836.
Plans continue to cover most of enrollees’ health costs (87% in 2023) on average, and the share paid for by the health plans have, over time, increased. The out-of-pocket share has subsequently decreased slightly from 15% of total annual health spending in 2012 to 13% in 2023.
However, even if the share that enrollees pay has decreased on average they still paid more out of pocket. Enrollees paid an average of $869 out-of-pocket in 2023, up from $633 in 2013. While there was a temporary decline in out-of-pocket spending during the COVID-19 pandemic (2019-2020), alongside a decline in spending for people with insurance generally, these costs have largely rebounded and have risen by about 24% since 2020.
Deductibles account for over half of enrollee cost-sharing payments as the distribution of cost-sharing types has remained relatively stable since 2016
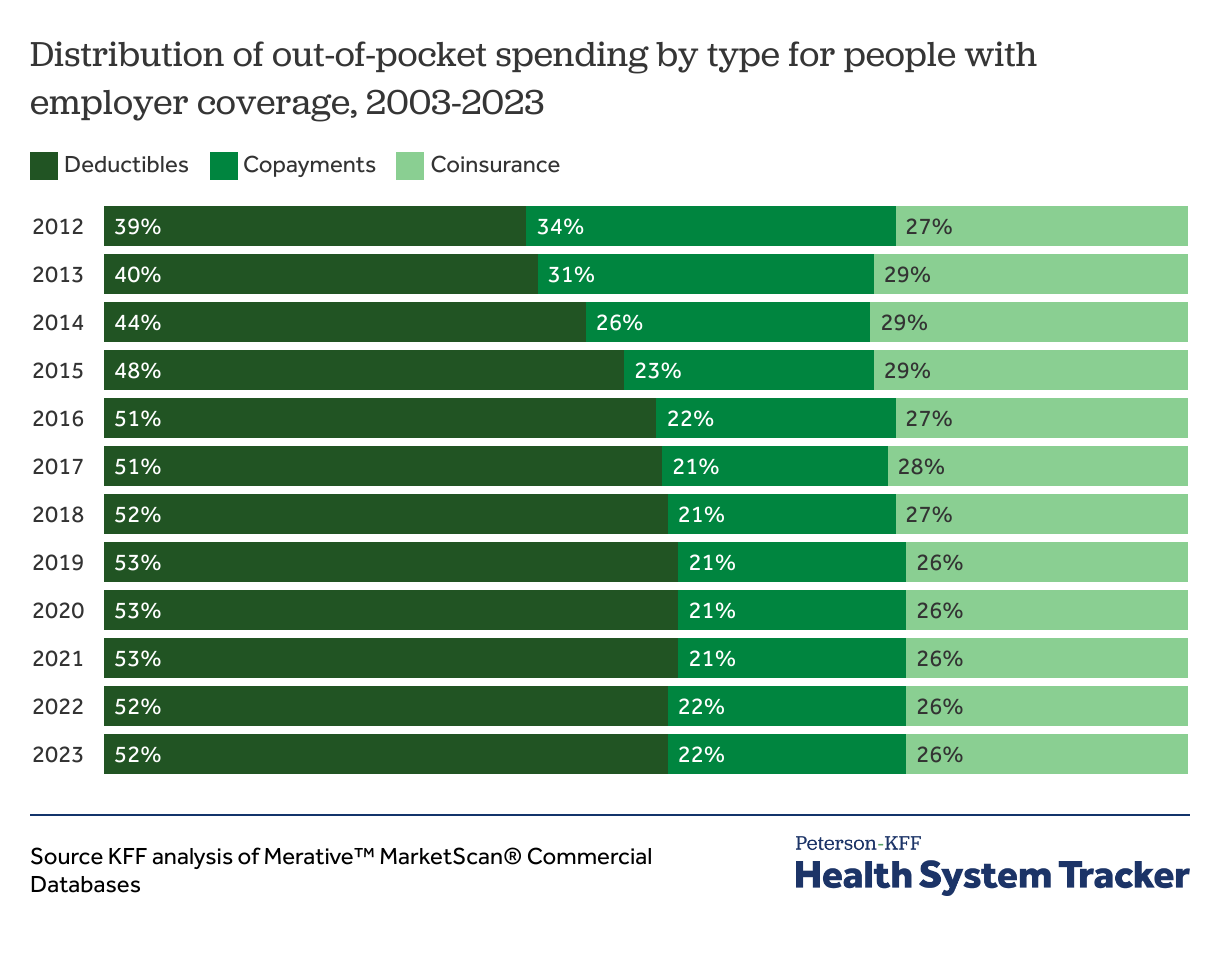
Increased cost sharing reduces health care utilization, but the structure of cost sharing may have differential impacts on how consumers use health care. In 2023, deductibles accounted for 52% of cost-sharing payments among people with employer coverage, rising by 12 percentage points from 2013. In contrast, copayments fell from 34% to 22%, while coinsurance has accounted for 26-28% of cost-sharing payments over the last decade.
In 2023, people with employer coverage paid an average of $453 in deductibles, $193 in copayments, and $223 in coinsurance, totaling $869 in annual out-of-pocket spending. By type of service, enrollees spent an average of $60 for inpatient services, $678 for outpatient services and $177 for prescription drugs.
A prior analysis of MarketScan among those enrolled in health plans and large-group employer plans found that deductibles made up around a quarter of out-of-pocket spending in 2007, showing an increasing trend toward higher deductibles in employer-sponsored insurance. This corresponds to other KFF analyses finding that, over the past twenty five years, the percentage of workers with a general annual deductible is increasing, as is the deductible dollar amount.
On average, people with employer coverage spend almost $900 per year out-of-pocket
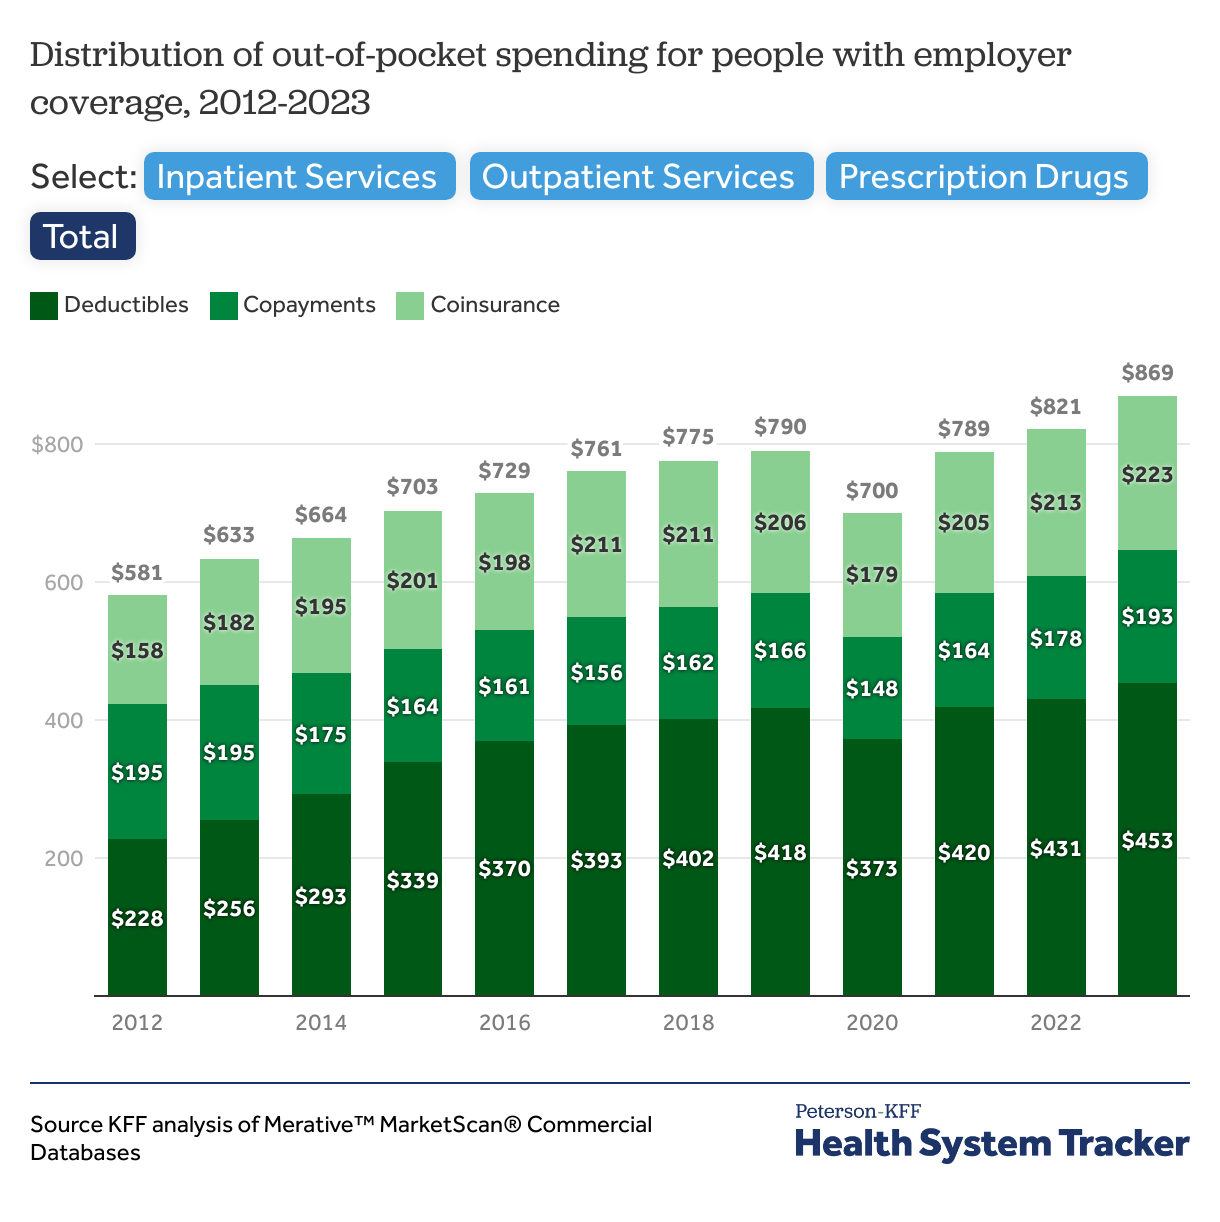
Total out-of-pocket spending averaged $869 in 2023. The majority of this spending was for outpatient services, followed by prescription drugs and inpatient services.
On average there has been a rise in cost-sharing amounts for outpatient services (increasing by 50%), especially through deductibles. The average amount paid through deductibles for outpatient care more than doubled from $198 in 2012 to $404 in 2023 making up 60% of outpatient out-of-pocket spending.
For prescription drugs, copayments remain the dominant form of cost-sharing, comprising 57% of out-of-pocket costs in 2023, or about $101 on average. However, total out-of-pocket expenditure on prescription drugs has increased by only 19% since 2012, rising from $149 to $177 on average.
Average out-of-pocket spending on inpatient care has been relatively stable over the past decade, and cost sharing for inpatient care mainly comes through coinsurance (62%). While average out-of-pocket costs for inpatient care are relatively low at $61 per person, that is largely because few people need such care in any given year. For someone who is hospitalized, the cost can be substantial. Among enrollees with any inpatient treatment and inpatient out-of-pocket spending in 2023, the average amount was $2,255. Among people with any retail prescription spending, they paid an average of $284 on prescriptions, and those with outpatient spending paid $883 on outpatient services.
Related Content:
Related Content:
Employer health plans are paying a greater share of prescription drug costs than a decade ago
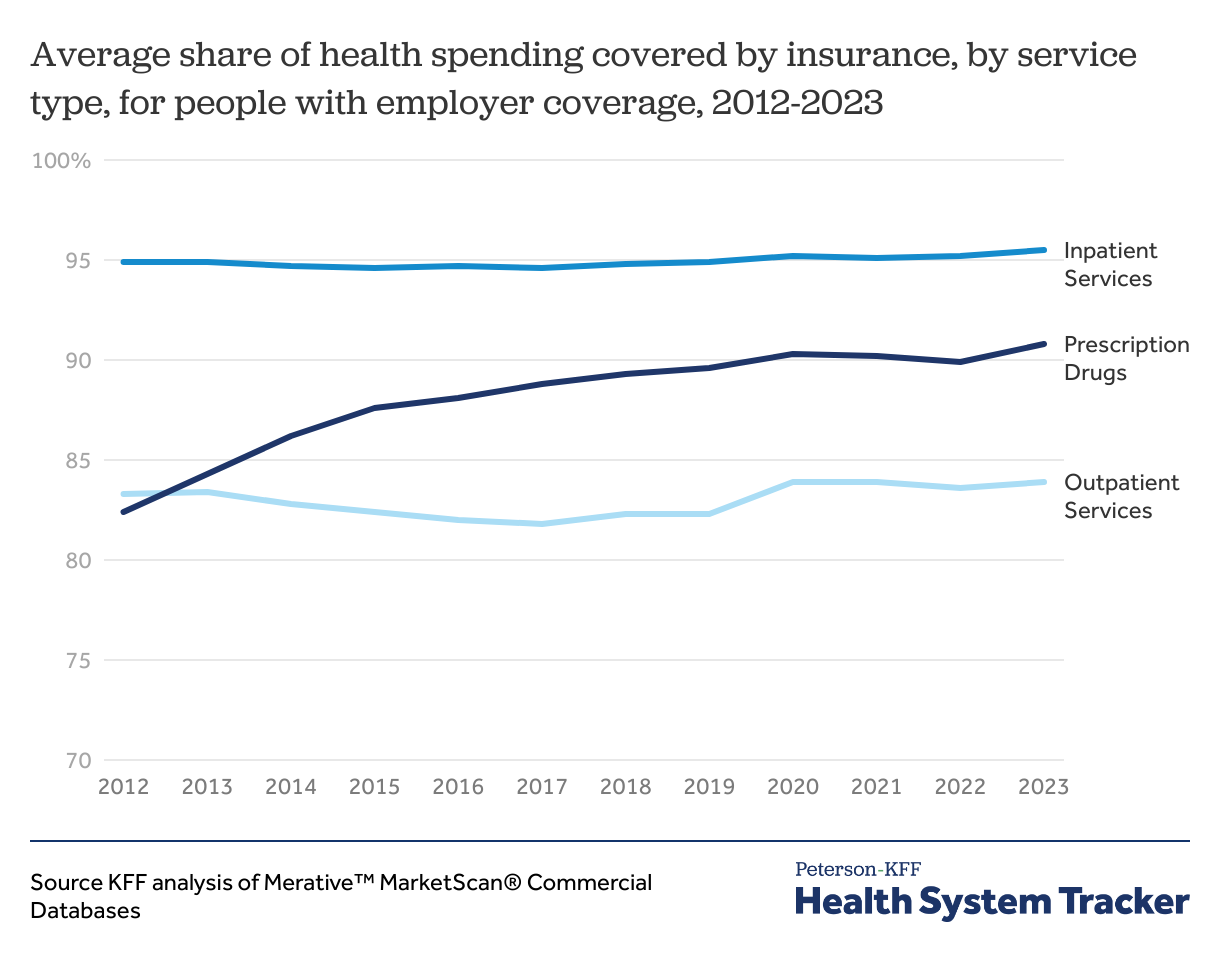
On average, employer plans covered 87% of enrollees’ health care expenses in 2023. While the share of costs covered for inpatient and outpatient services have stayed the same over time, plans now cover almost 10 percentage points more of prescription drugs costs compared to a decade ago.
Out-of-pocket costs and inflation have grown at similar rates since the COVID-19 pandemic.
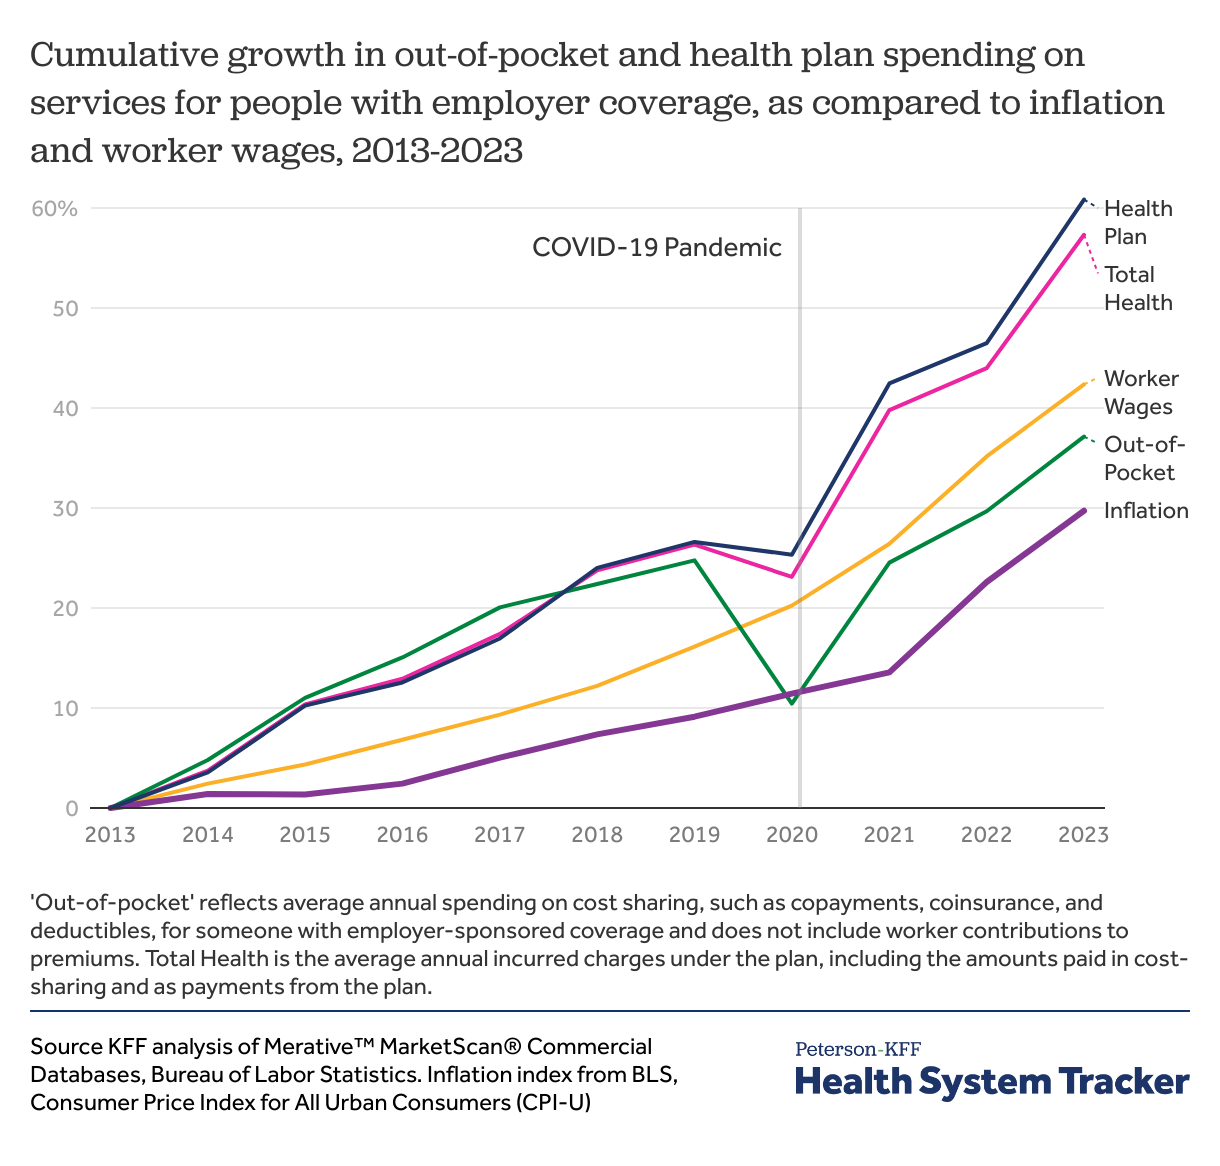
Despite the large share of costs covered by insurance, out-of-pocket spending for enrollees continues to rise. Since 2003, average out-of-pocket costs have increased by 37%. After experiencing a 15% dip during the COVID-19 pandemic, out-of-pocket spending among people with employer coverage grew 27% between 2020 and 2023. While this post-pandemic surge has outpaced inflation (19%), it has grown at a rate similar to workers’ wages (22%).
Health plan spending has also risen sharply (61%) in the last decade. Although out-of-pocket and health plan spending grew at similar rates before the pandemic, health plan spending has accelerated since 2019, rising 27% compared to 10% for out-of-pocket costs. Since 2019, health plan spending also outpaced both worker wages (23%) and inflation (19%).
Deductibles grew nearly six times faster than inflation from 2013 to 2019 but have grown at a more similar pace from 2021 to 2023.
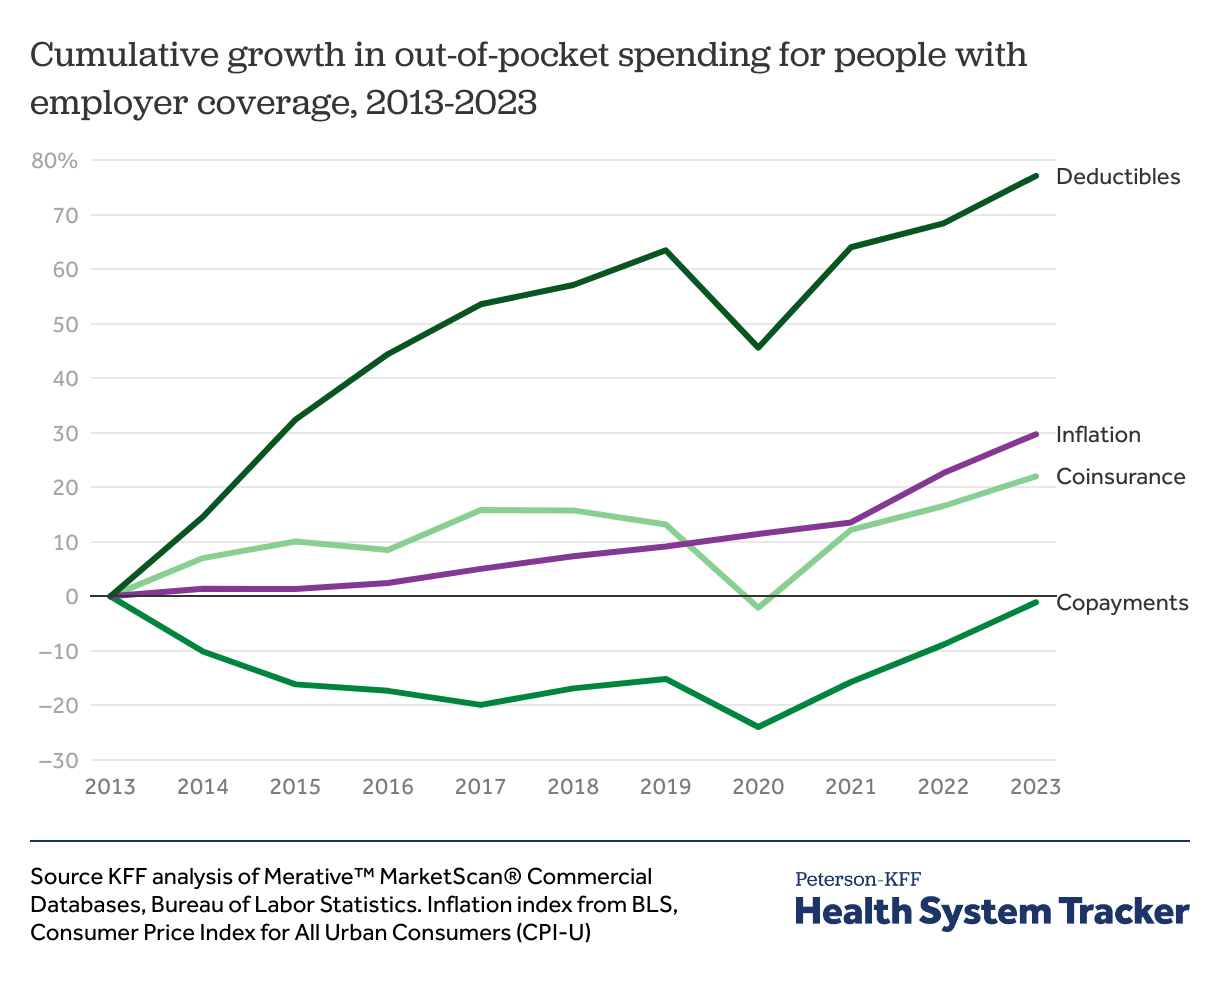
By cost-sharing type, average spending on deductibles and coinsurance has increased, while copayments have remained flat relative to inflation since 2013. However, since 2021, inflation (16%) and spending on deductibles (13%) have grown at similar rates. Deductibles rose rapidly before 2019, however starting in about 2019 employers have held deductibles constant.
A majority (66%) of people with employer coverage spent more than $100 on out-of-pocket costs in 2023
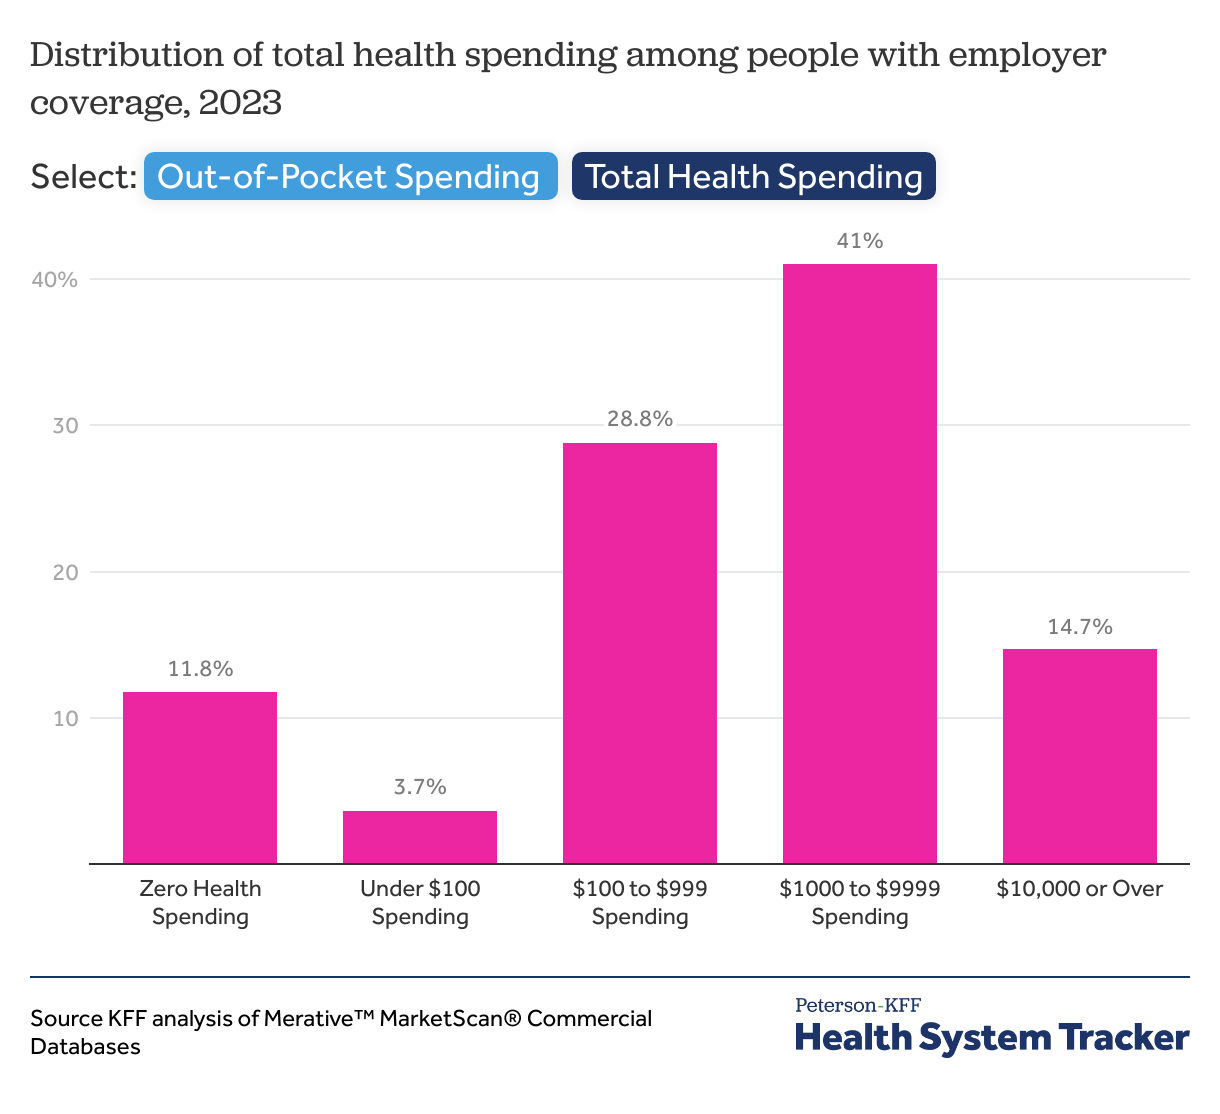
In 2023, 66% of people with employer coverage spent at least $100 on out-of-pocket health care expenses. Among them, 39.7% spent between $100 and $999 on average, while 26% spent $1,000 or more. Over time, the share of enrollees facing over $1,000 in annual out-of-pocket costs has steadily increased. Conversely, 18% of people with employer coverage incurred no out-of-pocket costs, and 15.4% spent less than $100 in 2023.
Regarding total health spending, 56% of people with employer coverage spent $1,000 or more, including 41% who spent between $1,000 and $9,999 and 15% who spent $10,000 or more. Meanwhile, 12% of enrollees used no health care billed to their health plan in the year, which further highlights the uneven distribution of health care costs across the insured population under employer plans.
Methods
This analysis uses claims from the Merative™ MarketScan® Commercial Databases, which contains claims information from employer sponsored health plans. To make MarketScan® data more representative of the American population with employer sponsored health insurance, weights were applied to match counts by state, sex, and age in the Current Population Survey. The data file contains records on 15.7 million people with at least six months of coverage, 9% percent of the 165 million people with employer coverage in 2023.
In the analysis of total health spending, out-of-pocket spending reflects the average spending of one worker over age 18, one spouse over age 18, and two dependent children under age 26. We estimated cost-sharing in 2024 by inflating 2023 spending by 3.3%, the CPI-U inflation index.
Claims data available in MarketScan® allows an analysis of liabilities incurred by enrollees with some limitations. First, these data reflect cost sharing incurred under the benefit plan and do not include balance-billing payments that beneficiaries may make to health care providers for out-of-network services or out-of-pocket payments for non-covered services, meaning that costs associated with pregnancy may be understated. Secondly, claims data show the retail cost for prescription drugs and do not include information about the value of rebates that may be received by payers.
Related Content:
The Peterson Center on Healthcare and KFF are partnering to monitor how well the U.S. healthcare system is performing in terms of quality and cost.