The United States spends more on healthcare than any other large, wealthy country. Total health spending is largely a product of two factors: 1) prices of healthcare services and 2) the volume of services and medications used. This chart collection compares indicators of health care utilization and prices in the United States and 11 similarly wealthy countries to investigate whether higher prices or higher utilization of healthcare services drives the high healthcare expenditures in the U.S. relative to peer nations.
International comparisons of healthcare systems are complex. Differences in patient populations, healthcare financing systems, and public health infrastructure can make direct comparisons difficult. Within these limitations, care was taken to identify data sources that provide as robust comparisons as possible.
According to the most updated internationally comparable data available, the U.S. has higher prices—particularly among private health plans—for many healthcare services. Meanwhile, utilization of many services, including doctor’s visits, number and length of hospital stays, and a variety of inpatient surgeries, is lower than in many comparable countries. As a result, the evidence continues to support the finding that higher prices – as opposed to higher utilization – explain the United States’ high health spending relative to other high-income countries. Data used to identify Medicare costs in the United States exclude physician fees, which vary widely by service and facility type, accounting for roughly 5-10% of the cost for inpatient hospital services, a 10–20% share for outpatient imaging and diagnostic services, and up to 50% for certain hospital outpatient department visits. As a result, international price comparisons may understate the actual gap between U.S. and peer country prices.
While additional factors like administrative overhead and intensity of care delivered may also impact differences in total health expenditures between countries, the fundamental pattern of the U.S. having higher prices for healthcare services and using less care on average has persisted for many years.
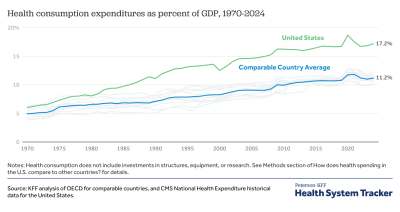
The U.S. spends nearly twice as much on healthcare per person as the average of peer nations

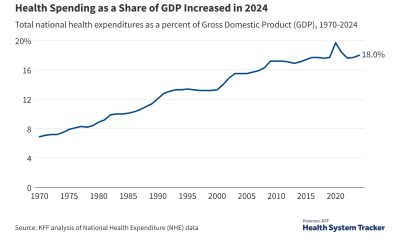
In 2023, the U.S. spent $13,432 per person on healthcare, which is 1.8 times the average amount spent in comparable countries ($7,393 per person). Spending on healthcare accounted for 16.7% of the U.S.’s GDP in 2023, compared to an average of 11.0% in comparable countries. The next highest-spending country (Switzerland) devoted 12.0% of its GDP to healthcare. Historical data shows that the U.S. has long spent a higher share of its GDP on healthcare than comparable countries, with the gap widening over the last five decades.
Related Content:
Compared to its peers, the U.S. has about half as many in-person doctor consultations per person

For decades, the U.S. has had fewer in-person doctor visits per capita than most peer nations. Only Sweden has had fewer doctor visits per capita during this period, with other countries having over twice the number of visits per person (e.g., Germany, the Netherlands, Japan). The COVID-19 pandemic caused a decrease in the number of in-person doctor’s appointments from 2019 to 2020 for all peer nations, with 2021 data showing at least partial recovery of pre-pandemic use of doctor consultations. Throughout the COVID-19 pandemic, however, the U.S. continued to have just over half as many in-person doctor visits per person as the comparable country average.
Although systematic data on average costs per doctor visit was not available to compare between countries, several studies that have compared healthcare utilization and spending in varying patient populations in the past have found that the cost per physician visit (for both primary care and specialty care) is higher in the U.S. than in eight other countries.
The U.S. has consistently had fewer hospital discharges per person than most comparable countries over the last two decades

Since 2000, the U.S. has consistently had fewer hospital discharges per capita than the average number of discharges among peer nations, with the U.S. having the least number of hospital discharges per 100,000 since 2012. The effect of the COVID-19 pandemic can be seen with a widespread dip in hospital discharges in 2020 compared to 2019, however, the overall pattern of the U.S. having fewer hospital discharges per capita remained unchanged. In 2021, comparable countries averaged 57% more discharges per capita than the U.S. (15,804 versus 10,044 discharges per 100,000 population), with Germany and Austria having more than two times the rate of hospital discharges as the U.S.
The average length of inpatient hospital stays in the U.S. is shorter than that of most peer nations
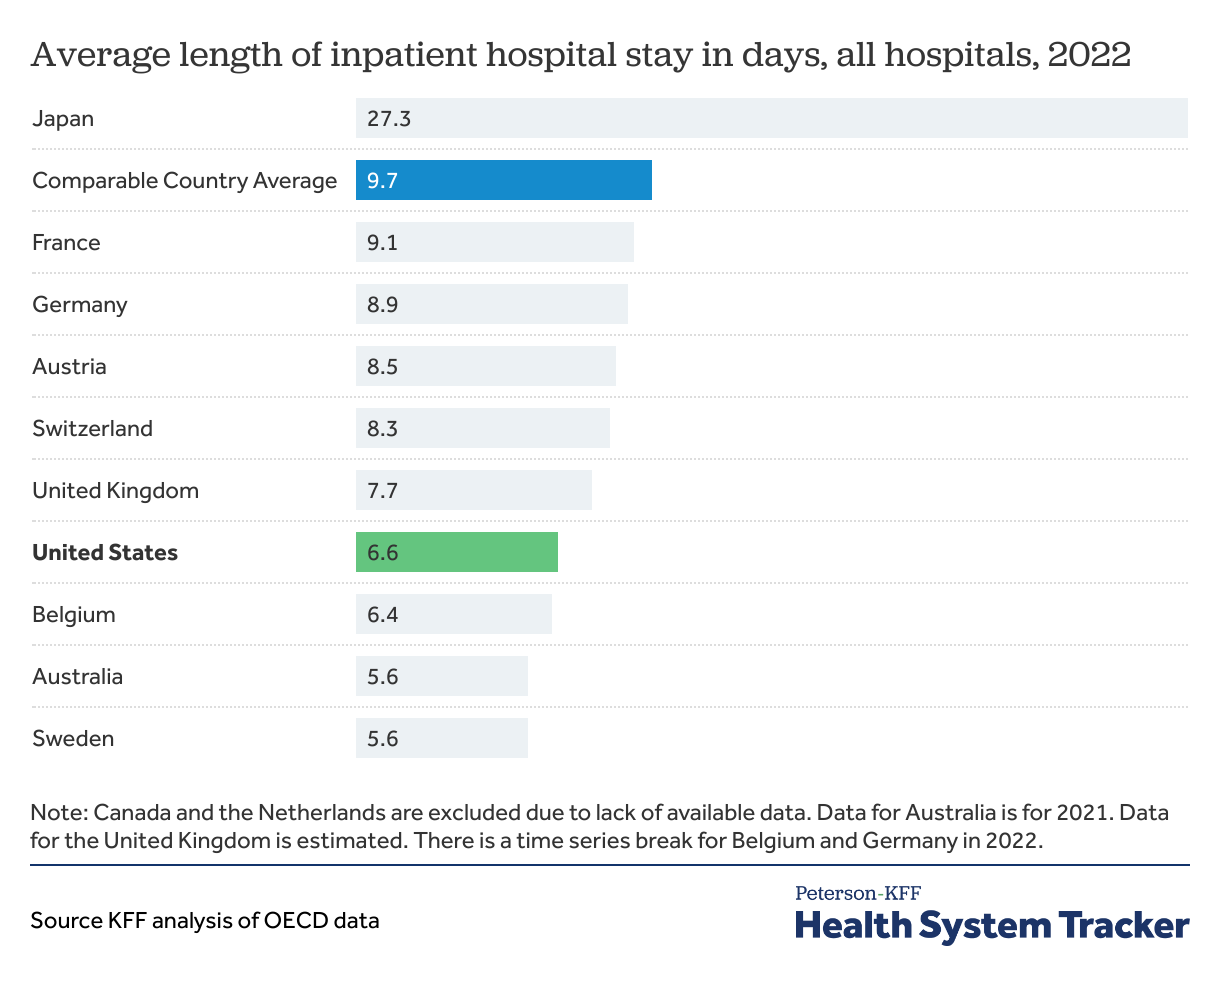
In 2022, peer nations had an average inpatient hospital stay of 9.7 days (7.4 days excluding Japan from the average), compared to 6.5 days in the U.S. Only three countries had shorter average hospital stays than the U.S., while the six other countries with available data had average hospital stays that were one or more days longer than the U.S. average.
Comparing prices and utilization of specific services
While the above charts show a high-level view of overall health care spending and use, the following series of charts look more closely at specific health care services and procedures, with examples from both inpatient and outpatient settings. Costs for specific services are provided for both public/government-regulated insurance plans and private insurance plans, data permitting. Costs within traditional fee-for-service Medicare are used as the “public” insurance option in the U.S. for comparison to public insurance schemes in peer nations. Medicaid, another public payer in the U.S, is known to pay lower prices than Medicare, but is not presented here due to lack of available data.
Of the three diagnostic imaging studies and nine inpatient surgeries examined, use of only cesarean sections, CT scans, and coronary bypass surgeries is higher in the U.S. than in peer nations. Meanwhile costs for all 12 services studied were consistently higher in the U.S. than in peer nations, across both private and public insurance plans.
The U.S. performs fewer coronary angioplasty surgeries than comparable countries, with costs per surgery that are often multiple times higher

Coronary angioplasties are used to open blocked blood vessels in the heart to treat heart attacks and other forms of coronary artery disease. The U.S. performs fewer inpatient coronary angioplasties than most comparable countries, with the average number of inpatient angioplasties per 100,000 people among comparable countries being 1.8 times the rate in the U.S. in 2022.
The differences in cost per inpatient angioplasty are even larger: in 2022, the average cost within the U.S. traditional Medicare program was 2.9 times the average cost among peer nations with public/government-regulated health insurance schemes. Comparisons of average costs within private insurance markets show a similar pattern, with U.S. costs ranging from 3.1 times the United Kingdom’s cost to10.3 times Germany’s cost.
Moreover, the average cost per coronary angioplasty among U.S. private insurers was more than double the Medicare cost, which is consistent with prior KFF work and a growing body of research that has shown that private U.S. health insurers pay significantly higher prices than Medicare. Other researchers have suggested that the price disparity between public and private insurers is a key factor in explaining why the U.S. spends more on health than peer nations, as private insurers account for a larger share of health spending in the U.S. relative to peer nations.
Although the U.S. averages more coronary bypass surgeries than most comparable countries, associated costs are higher in the U.S.

Coronary artery bypass grafts (CABGs), or coronary bypass surgeries, treat severe cases of coronary artery disease. In 2022, only one country (Belgium) performed more inpatient CABGs per 100,000 population than the U.S., with the U.S. performing 45% more CABGs per capita than the average among other wealthy, OECD countries. Costs per surgery in the U.S. remain higher than costs in comparable countries across both private and public health insurance.
In 2022, the average cost per inpatient CABG in the U.S. traditional Medicare program was $44,149 compared to an average cost of $24,847 among public insurance schemes in peer nations. Like the pattern seen with coronary angioplasties, private insurers in the U.S. paid twice as much as traditional Medicare per CABG, which further increases the price difference per surgery between the U.S. and peer nations that primarily rely on government insurance schemes.
The U.S. performs fewer inpatient cholecystectomies than most comparable countries, with costs more than twice as high

A cholecystectomy is the surgical removal of the gallbladder, often performed for complications arising from gallstones. On average, peer nations performed 1.7 times as many inpatient cholecystectomies per 100,000 population than the U.S. in 2022. Only three countries – Canada, the Netherlands, and the United Kingdom – performed fewer inpatient cholecystectomies than the U.S.
Again, the available cost data shows that the U.S. paid more per inpatient laparoscopic cholecystectomy than comparable countries in 2022. Among public/government insurance schemes, the average cost per surgery for the U.S. Medicare program ranged from 1.4 times as high as Sweden’s cost to 3.4 times France’s cost. Similarly, the average cost among private health plans in the U.S. was often 3 times the cost to private plans in other countries.
The U.S. performs half as many inpatient knee replacement surgeries as peer nations, while paying more per surgery on average

In 2022, the U.S. performed the lowest number of inpatient knee replacement surgeries per capita among all comparable countries. Meanwhile, the cost per inpatient knee replacement in 2022 was higher in the U.S. (for both Medicare and private insurers) than the cost in most peer nations. In one case (Switzerland), the public cost was higher than the U.S. Medicare cost, although the cost among U.S. private insurers was still significantly higher than the cost in Switzerland.
Data from the AHRQ HCUP National Inpatient Sample show that since 2017, the rate of inpatient knee replacements in the U.S. has been rapidly decreasing – from 254 per 100,000 persons in 2017 to 79 per 100,000 persons in 2021 and 68 per 100,000 in 2022. Simultaneously, the rate of outpatient knee replacements has been increasing. The shift from inpatient surgeries to performing certain low-risk surgeries in outpatient settings may be a factor in why the U.S. performs the fewest inpatient knee replacements. Both U.S. policymakers and private insurance companies have noted the potential cost savings of this shift, as inpatient surgeries often cost more than the same surgery performed in an outpatient setting.
Compared to other large, wealthy nations, the U.S. performs the fewest number of inpatient hip replacements with the highest cost per surgery

Comparable countries averaged 3 times the number of inpatient hip replacement surgeries per capita as the U.S., with each of the countries with available cost data paying less per surgery than the U.S. in 2022. On average, public costs in comparable countries were 38% lower than the average U.S. Medicare cost per total hip replacement, although there were two countries (Switzerland and Australia) with a similar cost per surgery as Medicare. Again, the average cost among U.S. private health plans was significantly higher than U.S. Medicare costs.
Data from the AHRQ HCUP National Inpatient Sample suggests that the rate of inpatient hip replacements in the U.S. decreased precipitously in 2020 with further decreases in 2021 and 2022. Although OECD data shows that comparable countries also experienced a decrease in inpatient hip replacements in 2020, their rates increased through 2022, likely suggesting a temporary COVID-19 related impact. The continued decrease in the U.S. may point to other factors affecting utilization patterns, such as the shift of certain surgeries from inpatient to outpatient settings as discussed above.
The U.S. averages the least number of inpatient appendectomies among peer nations while having the highest cost per surgery

No other country performed fewer inpatient appendectomies per 100,000 persons than the U.S. in 2022, with comparable countries performing an average of 2.5 times the number of inpatient appendectomies per capita as the U.S. In contrast, the U.S. had the highest cost per inpatient appendectomy in 2022, across both public and private insurance plans.
Notably, data from the AHRQ HCUP National Ambulatory Surgery Sample suggest the U.S. has performed more appendectomies in outpatient settings than inpatient settings each year since 2019. Data on outpatient appendectomies in other countries is not available, which makes direct comparisons of total utilization challenging.
Peer nations perform over twice as many inpatient prostatectomies per capita than the U.S., although the U.S. pays more per surgery

Total or radical prostatectomies (i.e., non-transurethral procedures) are used to treat prostate cancer or severely enlarged (non-cancerous) prostates. The U.S. performed the fewest inpatient prostatectomies per 100,000 men in 2021, although rates in Australia and the United Kingdom were similar. On average, comparable countries performed 61 inpatient prostatectomies per 100,000 men, which was 2.7 times the rate in the U.S.
Overall, costs per surgery were generally higher in the U.S. than in peer nations for both private and public health plans. However, the difference in costs between the U.S. and peer nations was smaller for prostatectomies than for other surgeries, with the cost in Switzerland even surpassing the U.S. Medicare cost.
Similarly to knee replacements, data from AHRQ HCUP National Inpatient Survey and National Ambulatory Surgery Survey suggest that use of inpatient prostatectomies in the U.S. has been decreasing since 2018, while use of outpatient prostatectomies has been increasing. Equivalent international data is not available to compare use of outpatient prostatectomies in peer nations.
More C-sections are performed on average and cost more in the U.S. than in comparable countries

In 2022, the U.S. performed 15% more C-sections per 1,000 live births than the average rate in peer nations. Of the surgeries with available data, the U.S. had higher utilization for only C-sections and cardiac bypass surgery. Like the other procedures in this analysis, however, the cost per C-section in the U.S. in 2022 was higher than the cost in peer countries.
The U.S. performs similar numbers of MRIs at similar prices as comparable countries

In 2021, the U.S. performed similar numbers of MRIs per capita when compared to the average of its peer nations. When comparing 2022 costs for an outpatient MRI of a leg joint (e.g., knee), the average U.S. Medicare cost was only slightly higher than the average cost among 7 peer nations with public/government-regulated insurance schemes. The cost per MRI among U.S. private health plans was more than three times the U.S. Medicare cost, which again highlights the impact of the high prices paid by private insurers on total health spending in the U.S.
The U.S. averages similar numbers of PET scans per capita with prices at or above those of peer nations

Utilization and cost for PET scans, which are used in cancer diagnosis and treatment, follow a similar pattern as MRI exams. In 2020, the U.S. performed slightly more PET scans per 100,000 population than the average among comparable countries (6.7 versus 6.3 per 100,000 population), although the use of PET scans widely varied among the comparable countries (from 1.8 to 10.3 per 100,000 population). The cost per outpatient PET scan among private health plans varied greatly among peer nations, with the U.S. and Germany having the highest but similar costs.
The U.S. performs more CT scans than comparable countries and pays more than some countries

In contrast with many of the other metrics of health care utilization presented in this chart collection, the U.S. performs more CT (“computed tomography”) scans per capita than other large, wealthy nations. Cultural trends driving demand for imaging and fear of malpractice litigation among providers may be contributing to the increased utilization of CT scans in the U.S. relative to comparable countries.
Available 2022 data for the cost of an outpatient CT scan of the abdomen with contrast shows that the U.S. traditional Medicare program pays slightly more per CT scan than the average public cost among peer nations. Like with the cost of MRIs, the price paid by private health plans was higher for all countries with available data.
Physicians and nurses in the U.S. have historically had higher annual earnings than their counterparts in peer nations
Comparisons of average nurse and physician wages between countries are difficult due to a lack of comparable data and differences in how these health care workers are paid between countries. A landmark study that compiled estimates of earnings for primary care physicians and orthopedic surgeons in 2008 found that U.S. physicians earned significantly more than physicians in five peer nations, even after accounting for educational debt burden. The authors also concluded that because U.S. physicians did not have higher practice volumes than physicians in peer nations, the disparity in pay was driven by higher fees for services.
A similar study that compared annual earnings of oncologists and radiologists in 2011 between the U.S. and four peer nations also found that physician earnings were higher in the U.S. A more recent study that estimated 2016 earnings showed that both physicians and nurses in the U.S. have higher annual earnings than other wealthy, OECD countries.
Drug prices negotiated by Medicare are higher than those in peer nations

Making comparisons of net drug prices between the U.S. and other countries is challenging due to the complex landscape of how drugs are priced and paid for. The list prices of drugs in the U.S., which are publicly reported, do not account for drug manufacturer discounts to insurance companies, pharmacy benefit managers, and patients. Although the amounts and recipients of these discounts are not publicly available, researchers have estimated that prescription drug rebates can account for more than 50% of the stated list price of some drugs in the U.S.
The recent creation of the Medicare Drug Price Negotiation program offers a rare glimpse into how the net price of some drugs in the U.S. compares to what other countries are paying. The table above was originally published in another brief that compared the new Medicare-negotiated drug prices to the prices in 11 countries of similar size and wealth. The drug prices reported for peer nations represent the upper bound of prices paid as additional discounts/rebates can lower net drug prices, although the size of discounts, if any, vary by country. In all but one instance, the Medicare-negotiated prices are higher than the prices in all comparable countries for all 10 drugs. Moreover, on average, Medicare-negotiated prices are 2.8 times the average of drug prices in the 11 comparable countries. These findings suggest that net drug prices in the U.S. are likely higher than prices in peer nations.
Methods and Data Sources
Estimates for the prices of specific health services are derived from multiple sources: estimates for costs in private health plans come from a claims-based analysis conducted by the International Federation of Health Plans (iFHP), while cost estimates for public and government-regulated health plans were sourced from fee schedules and data reports on individual country websites.
Data on costs in private health plans from iFHP were only available for a few comparable countries (Australia, Austria, Germany, and the United Kingdom) in which private insurance is not the main source of coverage. In Austria, Australia, and the United Kingdom, private insurance is voluntary and offers supplemental coverage in addition to the compulsory public/social health insurance scheme. In 2022, private health insurance accounted for 2.5% of total health spending in the United Kingdom, 6% in Austria, and 7.7% in Australia. In Germany, around 11% of the population has substitutive private health insurance instead of the public, statutory health insurance, with private insurance accounting for about 8% of total health spending in 2022.
When sourcing cost data from country websites, retrospective cost data was preferentially used; prospective fee schedules were used when retrospective data was unavailable. For comparison to costs in public and government-regulated health plans in peer nations, the average costs of healthcare services within traditional fee-for-service Medicare were used to represent the U.S. All international currencies were converted to U.S. dollars using yearly average exchange rates for 2022.
For inpatient surgeries, most countries with cost data for public/government-regulated insurance schemes reimburse for inpatient care episodes using cost weights assigned to diagnosis-related groups (DRGs). In Canada and Sweden, DRGs are not directly used for the reimbursement of inpatient care; however, national organizations retrospectively calculate the average cost of inpatient admissions by DRG for use in research and health care improvement. As such, the average (retrospective) cost per DRG in 2022 was available at the following links for: the U.S. Medicare program, Canada, Australia, Sweden, and England, which is used to represent the United Kingdom as a whole. For the United Kingdom, the cost per DRG was calculated as the weighted average of costs for each DRG across all elective inpatient, non-elective long stay, and non-elective short stay admissions.
The cost per DRG for Austria, France, Germany, and Switzerland was calculated using prospective costs (Austria and France) or cost weights (Germany and Switzerland) assigned to each DRG for 2022. For these countries, costs were calculated using the average length of stay for the DRG, as defined by each data source. For Switzerland, the cost weight for each DRG was multiplied by 9,661 Swiss francs, which was the median hospital base rate in 2022. For Germany, the cost weight for each DRG was multiplied by 3,833.07 Euros, which was the federal base rate in 2022; this amount was added to the costs of nursing care for the hospital stay (calculated by multiplying the daily nursing care cost weight by the average length of stay in days by 200 Euros per day). For Austria, costs per DRG were only available for 2024, so those amounts were used to estimate 2022 costs.
For outpatient CT scans and MRI exams, 2022 retrospective cost data was available for the U.S. Medicare program and England (representing the United Kingdom). Cost estimates for Australia, Belgium, Canada, France, Germany, and Japan represent the prospective amounts provided in each country’s fee or benefits schedule for 2022. Because each province in Canada determines its own fee schedule, Ontario’s fee schedule was selected to represent Canadian costs (since Ontario is the most populous province).
Although medical coding systems vary between countries, codes for specific services were selected to provide the best comparability between countries and data sources. The table below shows the billing code (e.g., DRG) that was used for each service and country.

The Peterson Center on Healthcare and KFF are partnering to monitor how well the U.S. healthcare system is performing in terms of quality and cost.