In the final months of the Trump Administration, the United States Department of Health and Human Services (HHS) released final rules establishing price transparency requirements for healthcare services. Generally, health insurance companies and healthcare providers negotiate prices for services and products. These negotiated prices have typically not been publicly available, meaning that patients often do not know how much they will be charged until after they receive care and the associated bills. As of January 1, 2021, hospitals are required to make payer-negotiated rates for common services available to consumers on an online tool, and for all services in a machine-readable file. A second rule requires insurers in the individual and group markets and self-funded employer plans to make rates and individualized cost-sharing estimates for certain common services available to enrollees by January 1, 2023, and for all services by the following year. However, ongoing litigation challenging the constitutionality of the Affordable Care Act (ACA) and the price transparency rule aimed at hospitals could affect the implementation and impact of these new rules. President-elect Biden expressed support for greater healthcare price transparency during the campaign, but has not commented specifically on the Trump Administration regulations.
This brief summarizes the key requirements for hospitals, insurers, and self-funded employer plans under the new price transparency rules. We then analyze price variation for select health services covered under these rules. We examine prices specifically for health services that are fairly standard and often planned, meaning that patients could theoretically shop for care in advance. Overall, we find that the prices of select services — i.e., knee and hip replacements, cholesterol tests, and Magnetic Resonance Imaging (MRIs) — vary widely even within a given geographical region. In the brief, we also discuss the implications of the new rules for patients and the market. While the evidence shows that price transparency might not reduce cost, the new rules could shine a greater light on where health care costs are particularly high, helping to inform policy.
Federal rules on price transparency
Prices for routine healthcare services can vary across the U.S. and even within a given region. Advocates of price transparency argue that it will lower consumer health costs by increasing competition among providers and giving patients the option of “shopping” for the best price. While the federal government and states set reimbursement rates for the Medicare and Medicaid programs, there is generally no price regulation in the private insurance market. The notable exception is Maryland where the state sets hospital rates for all payers. The Affordable Care Act (ACA) requires that hospitals publish a list of standard charges for all given services, which are the unnegotiated, undiscounted rates for services. The Centers for Medicare & Medicaid Services’ (CMS) price transparency rules draw on the legal authority established under the ACA and interpret its transparency requirement to include payer-negotiated rates.
The latest final rule requires that insurers in the individual and group markets and self-funded employer plans provide enrollees with price and cost-sharing information for covered health services in non-grandfathered plans. The first requirement in this rule to take effect requires that insurers and plans make public the following detailed price information in three separate “machine-readable files” by January 1, 2022, with monthly updates: 1) negotiated rates for all covered items and services between the plan and in-networks providers; 2) historical payments and billed charges from out-of-network providers; 3) in-network negotiated rates and historical net prices for all covered prescription drugs at the pharmacy location level. Insurers must make this pricing information and personalized cost-sharing estimates ( i.e. deductible payments, co-pays, and coinsurance) available to enrollees on an online consumer-usable tool for 500 “shoppable” services by January 1, 2023, and then for the remainder of all covered serviced and items by January 1, 2024. The 500 common “shoppable” services are identified in the rule by HHS, the Department of Labor, and the Department of the Treasury. State insurance regulators will oversee enforcement of the transparency rule for fully insured plans, the Department of Labor will oversee group plans subject to ERISA, the Treasury will oversee church plans, HHS will oversee non-Federal governmental plans, and the Office of Personnel Management will oversee the Federal Employees Health Benefits Plans.
The final rule builds on the Trump Administration’s initial price transparency rule requiring hospitals to publish descriptions and standard, discounted, and payer-negotiated rates for at least 300 common medical services – 70 identified by CMS and 230 that can be selected by the hospital – to the public in a “consumer-friendly manner.” Additionally, hospitals are required to provide data on standard, discount and negotiated rates for all offered items and services on their website, in a machine-readable format. CMS retains enforcement authority, and the process for assessing hospital compliance could be triggered by complaints to CMS or hospital system audits. Hospitals that do not comply after January 1, 2021 may face a fine of up to $300 per day.
Related Content:
Insurers and hospitals generally oppose the new rules. The American Hospital Association and other groups sued HHS arguing that the rule “exceeds the agency’s statutory authority, violates the First Amendment, and is arbitrary and capricious under the Administrative Procedure Act.” A federal court dismissed the plaintiff’s motion, and ruled in favor of HHS; the case is being appealed. Another case currently before the Supreme Court, California v. Texas, could also affect the transparency rule. This case seeks to overturn the entire ACA; depending on the outcome, HHS could lose the statutory authority under the ACA to require hospitals and private payers to publish prices for health services, and new legislation would be required to pass through Congress before price transparency regulations could be enforced.
Prices for many standard health services vary both across and within geographic regions
Certain health services may be better suited for price transparency efforts. For instance, emergency, specialty, or complex care are harder to anticipate and shop for given the varying complexity in care and time and potential limitations to specialized providers. Price transparency tools are more suited for health services that can be scheduled in advance and are relatively standardized procedures. We selected three such services – joint replacements, MRIs, and cholesterol tests – the prices for which must be made public for patients under the HHS’ transparency rules. We analyzed prices for these health services across 20 large core-based statistical areas (MSAs) using IBM’s MarketScan® Commercial Claims and Encounters Database of large employer claims in order to examine the extent to which prices vary for a given service. In this analysis, price refers to the allowed charges, which is the amount paid under the plan for a given service, including both the plan’s and the enrollee’s share but excluding any balance billing.
A limitation of these data is that they reflect cost sharing incurred under the plan and do not include balance bills that beneficiaries may receive from out-of-network providers for care. Enrollees typically pay less in cost-sharing for in-network services, which are performed by providers who have agreed to a contracted rate with the plan. Additionally, we are comparing variation in average allowed charges, without any adjustment for the quality or intensity of care provided. For more information see the methods section.
As shown below, prices for a common surgical procedure, imaging test, and cholesterol test all share one thing in common: they vary widely.
The price for a knee or hip replacement varies drastically depending on where you receive the service
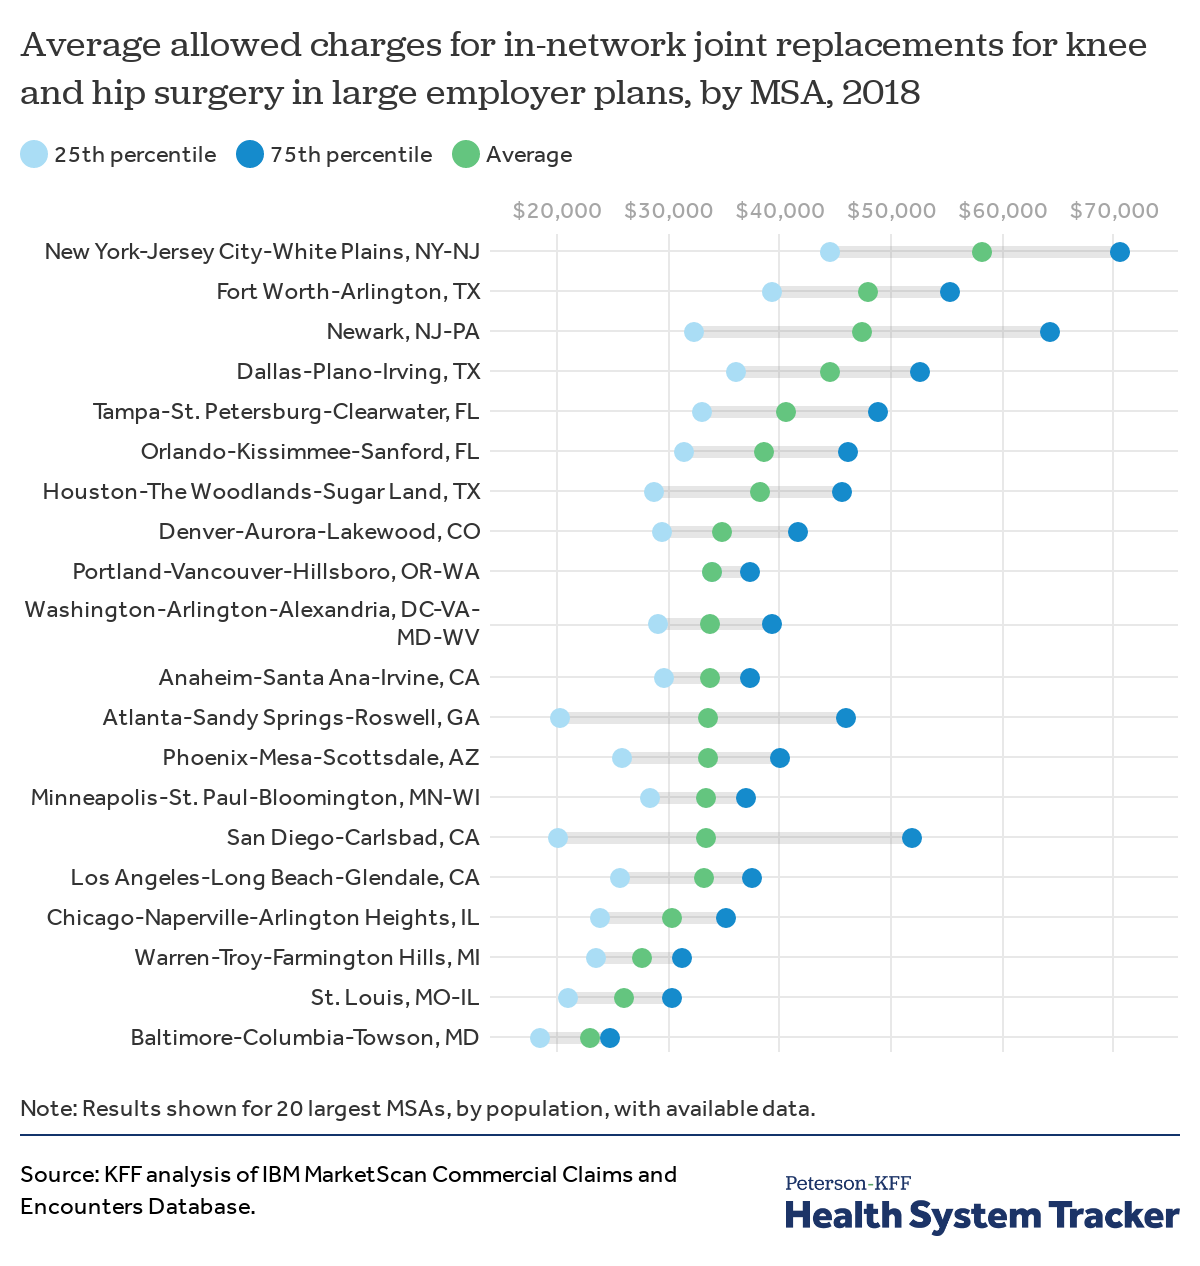
Knee and hip replacements are common surgical procedures. The average price (allowed charge) of a joint replacement for knee or hip surgery in an in-network facility varies widely across the country. The price includes in-network room and board and allowed charges for the procedure, but excludes any balanced billing that may occur if the providing clinicians were out-of-network. The average price in the New York metro area ($58,193) is more than double the average price in the Baltimore, MD region ($23,170).
The price of knee and hip replacements also varies within a region. The Baltimore region had the lowest average price for inpatient joint replacements and had relatively small variation within the region, possibly because inpatient hospital services are subject to the state’s all-payer rate setting system.
The analysis shows that in some areas, patients may face widely varying prices based on the hospital and their insurance plan, even within a given MSA.
In 20 highly populated regions, the average price of cholesterol tests was three times greater in the highest-price region than in the lowest
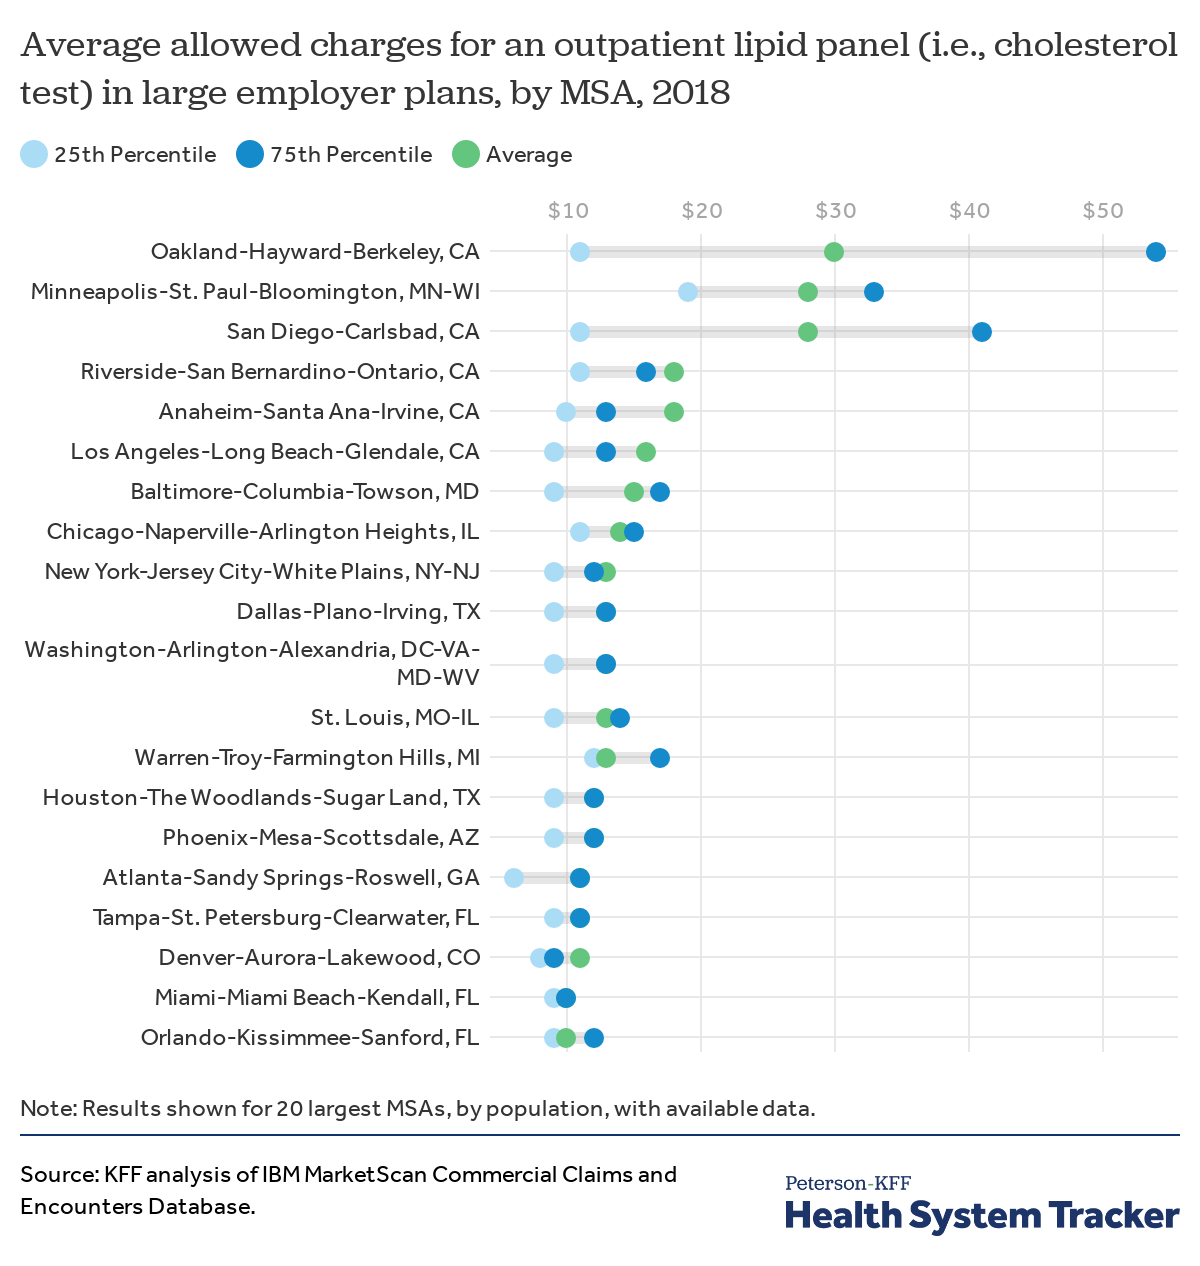
Lipid panels are routine screening tests to measure cholesterol levels in the blood. The average price for an in-network lipid panel in an outpatient setting allowed by large employer plans in the Oakland, CA area ($30) is 3 times higher than in the Orlando, FL area ($10). Even within the Oakland area, a quarter of panels were above $54, while a quarter were below $11. In the case of lipid panels, higher price areas like Oakland tend to have wider variation than lower-price areas like Orlando. In most of the MSAs shown, the average price of a lipid panel in an outpatient setting allowed by large employer plans ranged between $10-15.
Average MRI price varied by more than $500 across regions
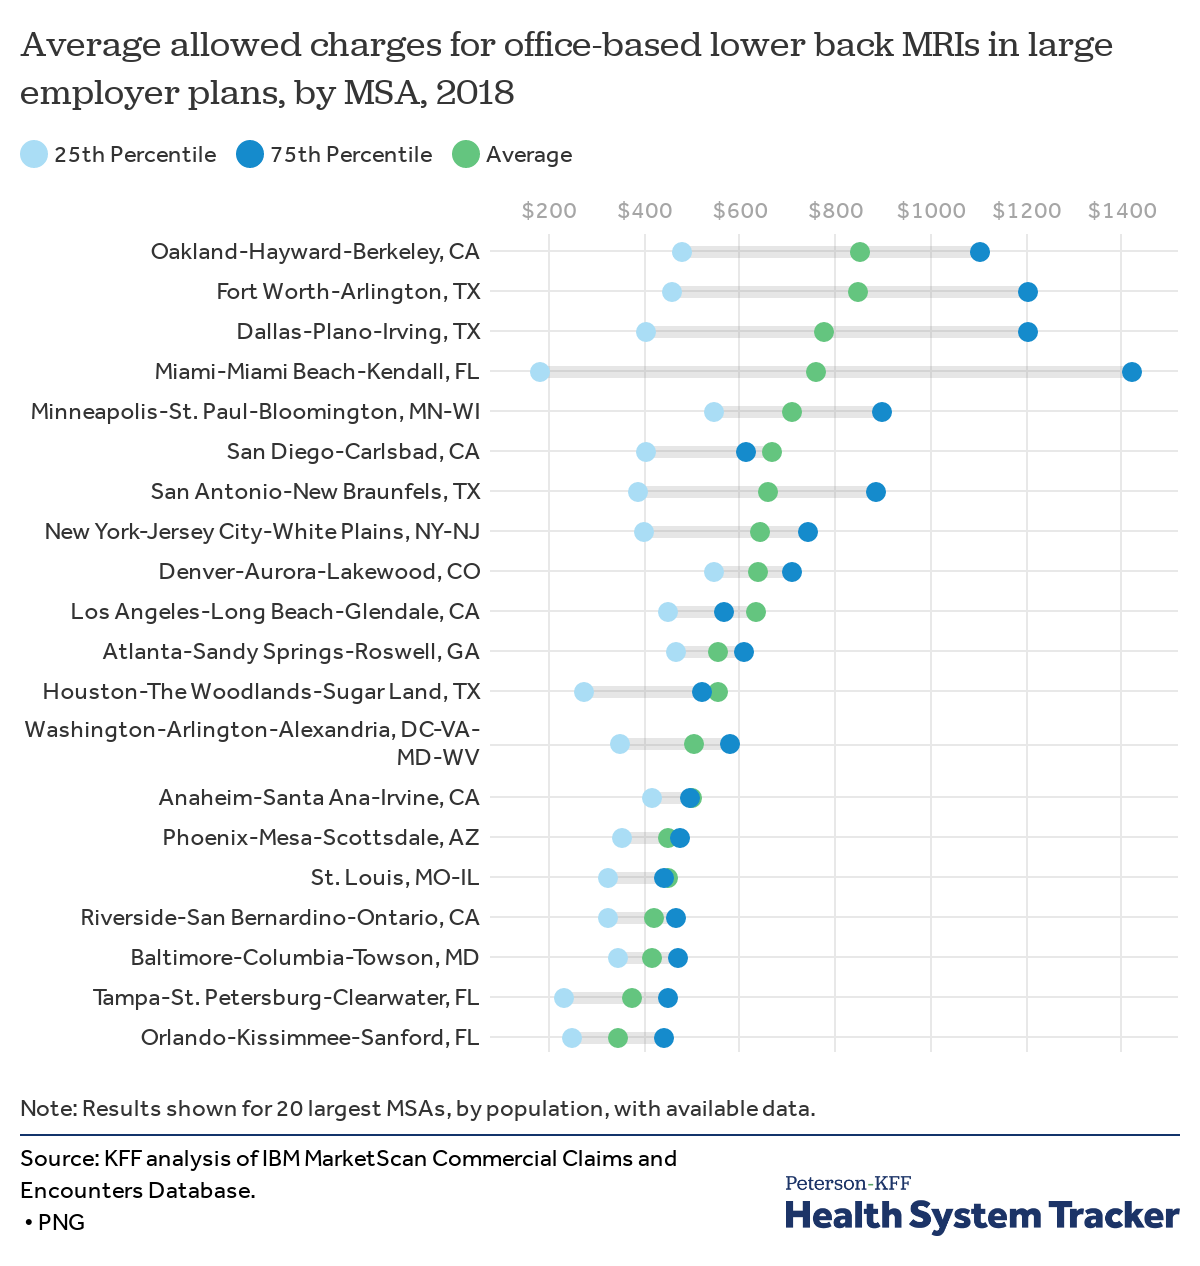
We examined the price of a lower back MRI performed in a physician office. The average price of this type of MRI allowed by large employer plans was 144% higher in Oakland, CA region ($853) than in the Orlando, FL region ($349). These prices include out-of-network providers, but do not include any balance billing incurred by the patient.
Prices allowed by large employer plans also vary within regions. For example, in the Minneapolis region, half of MRI claims were priced between $550 and $900, In the Phoenix region, however, that range was much smaller, with prices for half of MRIs falling between $355 and $478.
Evidence of price transparency initiatives’ impact on market pricing
Proponents of price transparency initiatives argue that by making prices public, health systems will face pressure to lower prices to compete for consumers shopping for health services, and insurers will face greater pressure to negotiate discounts. While there is general agreement that patients should have access to information about what they will be charged for care, some experts disagree on whether the mechanism of transparency is an effective tool to curb rising costs.
Some price transparency initiatives have found modest decreases in health costs. A study of New Hampshire’s statewide online price transparency database found that the total cost of medical imaging procedures decreased by 3% over a five-year period, and both insurers and consumers (particularly those with a deductible) experienced savings. Another study in 2014 of an employer-sponsored price transparency platform was associated with lower spending for common procedures.
Perhaps counterintuitively, price transparency could also lead to increased prices, an outcome experienced in other industries. As health systems and provider groups are made aware of what other providers are charging for the same care, providers could try to negotiate higher rates to match their competitors, especially in more highly concentrated markets. Studies show that existing price transparency tools are not associated with decreases in spending. A study of two large employers published in JAMA in 2016 found that offering a tool for employees was not associated with decreased patient outpatient out-of-pocket spending. Similarly, in Massachusetts – a state that requires payers to have cost estimator tools for patients to estimate cost for services at various sites of care – evidence did not show that the tools were associated with decreased spending.
The cost of implementing price transparency tools can be quite expensive for employers and insurers. While some employers and insurers already provide enrollees with estimates of potential cost, the requirement for real-time data on individual cost-sharing requires more advanced technical input, management, and compliance. In the latest final rule, the federal government estimates that while insurers and enrollees could save $154 million in reduced medical costs, the three-year average annual burden and cost of implementation of the rule will range between $5.7 billion to $7.9 billion for insurers. Additionally, the federal government estimates that the rule will contribute to higher premiums in the individual market, potentially harming individuals who do not receive subsidies in the marketplace.
Challenges in price transparency efforts for patients
There are many factors that play into whether patients will be able to make informed choices based on price transparency data. Patients must first be made aware of the availability of price information tools for non-emergency services. Even then, patients may have to make decisions based on their cost-sharing liability and who is in their provider network; for example, patients might not be able to access higher value care if the lower-priced providers are not in-network.
Patients are often unaware of existing price transparency tools or do not use them
A number of states require information on pricing to be made available to patients. Some insurers and employers also have tools making price information more accessible for enrollees. However, evidence suggests that most individuals do not seek pricing information even when tools are available, and when they do, most do not compare providers. Patients report difficulty in obtaining price information and a desire to keep their providers as barriers to shopping for care. In Massachusetts – a state that implemented an online-tool for patients to compare costs for health services across providers – 78% of surveyed consumers stated that they’d like to know the cost of care before obtaining it, but over half (54%) of individuals were unaware of the existing price comparison tool.
Many health services cannot be planned in advance
Much of health spending occurs unexpectedly in a medical crisis or emergency like a heart attack or stroke, and there is limited evidence on how many services can actually be shopped for in advance. Some estimates find that roughly 30% to 40% of health spending was for services that could be scheduled in advance. These two estimates define health services and products as shoppable if they can be scheduled in advance, if there is price information available to the patient, and if there are two or more places through which the individual could receive the service or product (i.e., there is competition in the market).
Even if patients have shopped and planned for specific services, they may need additional medical services that were not accounted for in their original estimate. For example, a screening medical service may become diagnostic during the procedure, and additional services or tests may result in unexpected medical bills. CMS’s price transparency rules requires services that are generally packaged together have one price for the service and ancillary fees – such as room and board, facility fees – but this might not include provider fees. While insurers are now required to provide historical estimates of out-of-network prices and billed charges under the new rule, those estimates could vary significantly from what a patient faces.
Knowing the price of a given health service might not inform patients of how much they owe
Patients contribute to the cost of the healthcare they use through cost-sharing such as co-payments, co-insurances, and deductibles. A patient’s cost-sharing may vary across covered benefits, the provider they select and other plan provisions. The new rule requires insurers and plans to tailor cost-sharing information to each individual’s health insurance plan structure. However, there may still be challenges in getting accurate real-time information on out-of-pocket estimates, since the amount a patient may owe under their deductible depends on if they have received other services and whether those services have been accounted for at the time they are using the transparency tool. For example, a patient will not face additional cost-sharing for in-network services if they have met their out-of-pocket maximum, but if the online price transparency tool is not up to date with an enrollees other spending cost-sharing estimate will be much higher than what is actually required.
Shopping for care based on price leaves gaps in accounting for the quality of care
Patients may want to factor in the quality of care along with the price of care when seeking health services. Current federal price transparency requirements do not require reporting on quality alongside price. There is debate on how to factor in quality of care into pricing, since higher prices do not necessarily correlate with improved quality of care or outcomes. Additionally, quality can be difficult to measure and compare across providers, and quality metrics might not capture the characteristics of providers that patients may be interested in. For example, common quality metrics at the hospital level include mortality rates, cesarean sections, or hospital re-admissions. Such metrics, while important, might not be the most relevant for patients shopping for certain non-emergency services. In the absence of usable quality information, patients might perceive a higher price as being an indicator of higher quality.
Discussion
Prices for common health services vary widely across regions and within regions. There is general consensus that patients should have access to the cost of care prior to receiving that care. The new price transparency rule aims to make that price and out-of-pocket cost information available to patients. Yet whether this information will help patients access lower-priced care depends on a variety of factors, including the type of care patients need, the choices available within a given network, and, perhaps most importantly, how providers, purchasers, and payers respond to increased price transparency. The availability of price information could alter the dynamics of negotiations between providers and insurers by allowing each to see what their competition charges and pays, respectively. Insurers and large employers may be able to utilize the information to configure their networks to include lower-priced providers. Alternatively, lower-priced providers could demand higher prices. Overall, it is unclear whether transparency will lead to decreased prices or consumer savings. However, greater transparency could shine a spotlight on the cost of health care generally in the U.S. and on specific providers or communities where prices are especially high, helping to galvanize and inform future policy action.
Methods
We analyzed a sample of medical claims obtained from the 2018 IBM Health Analytics MarketScan Commercial Claims and Encounters Database, which contains claims information provided by large employer plans. This analysis used claims for 18 million people representing about 22% of the 82 million people in the large group market. Weights were applied to match counts in the Current Population. Survey for enrollees at firms of one thousand or more workers by sex, age and, state. Claims for people age 65 and over and from Puerto Rico were excluded. Weights were trimmed at eight times the interquartile range. We did not control for differences in quality, intensity or health risk of individuals accessing services.
This analysis examines allowed charges, which represent the total billed amounts, including both the plan and enrollees’ share, minus any balancing billing. Both in- and out-of-network claims were analyzed, except when directly noted that only in-network claims were included. In determining allowed charges, we excluded claims that were very high or unreasonably low.
MSAs and population counts are defined by the US Census Bureau. Most MSAs are Metropolitan Statistical Areas, but some of the largest areas (Boston, Chicago, Dallas, Detroit, Los Angeles, Miami, New York, Philadelphia, San Francisco, and Washington) are subdivided and reported at the Metropolitan Division Level.
MRI: Outpatient MRIs include the cost of outpatient claims with a CPT code of 72148, a lumbar spine MRI. The cost of an MRI may be split between professional charges, facility fees and the technician charges. In order to ensure that we were capturing the cost of the MRI, and not just the technicians’ time or facility fee, we only selected some days which include an MRI charge that had both a professional and facility fee with a CPT code of 72148, days with at least one professional fee without a procedure modifier of 26 or TC and days where all of the professional claims had a CPT code of 72148 (and the facility fees did not have another CPT code). Observations below $100 or above the 99.5th percentile were excluded. We consider MRI’s which took place at an office, independent clinic or out-patient not elsewhere classified as taking place in an office visits. Only MSAs with more than 500 unweighted observations are reported. Charges include a small percentage of out-of-network visits. A limitation of these data is that they reflect cost sharing incurred under the benefit plan and do not include balance-billing payments that beneficiaries may make to providers for out-of-network services.
Lipid Panel: Lipid Panels are claims with a CPT code of 80061. This does not include the venipuncture or other lab work that may be performed. Two percent of cases were out-of-network and were excluded. Observations were limited to lipid panels billed from doctor’s office, health clinic, or independent laboratories. Lipid panels performed at hospital tend to be more expensive and were excluded. Claims were also trimmed below $5 and above the 99.5% percentile. Estimates are not reported for MSAs with fewer than 1,500 observations.
Joint Replacement: In-network admissions were defined as admissions that included exclusively in-network room and board charges. Roughly 90% of all admissions met these criteria, but some may include other out-of-network charges. Admissions were classified as joint replacement when the associated diagnosis-related group (DRG) was 470, “major hip and knee joint replacement or reattachment of lower extremity without major complications”. Results are only reported for MSAs with more than 125 unweighted observations. We did not control for the cost of comorbidities, or other factors which may increase the cost of the admission; 96% of admissions are three or fewer days. In addition, the cost of an admission was trimmed below $500 and above the 99.5% percentile.
The authors would like to thank Julie Hudman, PhD for her contributions.
The Peterson Center on Healthcare and KFF are partnering to monitor how well the U.S. healthcare system is performing in terms of quality and cost.