The cost of an outpatient visit to a physician’s office, urgent care center, or emergency department depends in part on the level of service provided. Providers and facilities generally charge higher prices for more complex visits, and insurers pay larger reimbursements. Patients with deductibles or co-insurance may have higher out-of-pocket costs for more complex visits, too. Although there are standardized guidelines for how to determine the complexity of a visit, there is a trend towards visits being billed at higher levels over time. This could reflect increases in actual acuity and the intensity of services required, or changes in billing practices, or both. There is concern that providers may be inappropriately billing for more complex—and thus more expensive—services, a practice known as “upcoding.”
In this analysis, we review the literature on coding practices, and using claims data we examine trends in complexity coding across outpatient practice settings from 2004 to 2021. We look at private, large employer-based insurance claims from the Merative MarketScan Commercial Claims and Encounters database for non-elderly people. We examine the distribution of code levels in physician offices, urgent care centers, and emergency departments over time, for all evaluation and management claims and for specific diagnoses. This analysis only includes evaluation and management claims and does not include additional visit-associated bills such as laboratory tests or other services.
Over the 18-year period of our analysis, we find that claims across all three sites of care trended towards higher level codes, even among specific, common diagnoses like urinary tract infections and headaches. The average age of this population stayed consistent over time. However, we do not assess whether health status worsened with time, so we are not able to assess whether increases in billed complexity represent actual changes in clinical characteristics. These trends could therefore be explained by multiple factors beyond upcoding, such as increasing clinical acuity, changes in services provided, or care for some diseases shifting from the inpatient to the outpatient setting.
These changes are contributing to higher outpatient health spending. We find that in 2021, outpatient evaluation and management spending was 4% higher in both physician offices and emergency departments than it would have been if visits were coded at the same levels as in 2011.
How is visit complexity determined, and how might it affect costs?
Visit complexity is determined by the level of evaluation and management services billed by the provider or hospital. Evaluation and management services are billed using American Medical Association Current Procedural Terminology (CPT) codes, and AMA guidelines for assigning these codes are approved by the Center for Medicare and Medicaid Services. Level 1 visits are the lowest complexity cases, with less time required or straightforward medical decision making, while level 5 visits are the highest complexity cases, with more time required or very complex medical decision making. Payers generally reimburse a higher rate for more complex cases to reflect the increased resources and time required to treat these cases.
Related Content:

Several prior studies have shown that outpatient costs are increasing and that providers are billing for more complex services. A KFF analysis of U.S. healthcare price growth found that the average price of an outpatient office visit grew faster than inflation from 2003-2019, and that the share of level 4 visits increased from less than 1-in-5 (19%) to more than 1-in-3 (36%) during the same period. Similar trends have been documented in the emergency department and inpatient hospital setting. While the reasons behind increasing visit complexity are likely multifactorial, these trends have raised concerns whether some providers might be “upcoding,” or inflating medical complexity to receive higher payments.
Some of this trend toward more complex coding may be explained by an aging and more medically complex population requiring more outpatient services. In the emergency department, there is some correlation between number of services provided and complexity billed, but this relationship does not completely explain the increases in complexity levels billed. One study found that of all physicians who provided outpatient, inpatient, or other evaluation and management services for Medicare beneficiaries in 2010, physicians who consistently bill at the highest complexity levels treat patients who are similar in age and diagnoses to their counterparts.
Regardless of the reason behind it, the trend toward billing for higher complexity services appears to have led to increased spending on outpatient services. The Center for Public Integrity found that higher codes for routine office visits led to a $6.6 billion increase in Medicare payments from 2001-2010, and that higher codes in the emergency department increased costs by $1 billion from 2001-2008.
Outpatient claims are billed at higher levels over time
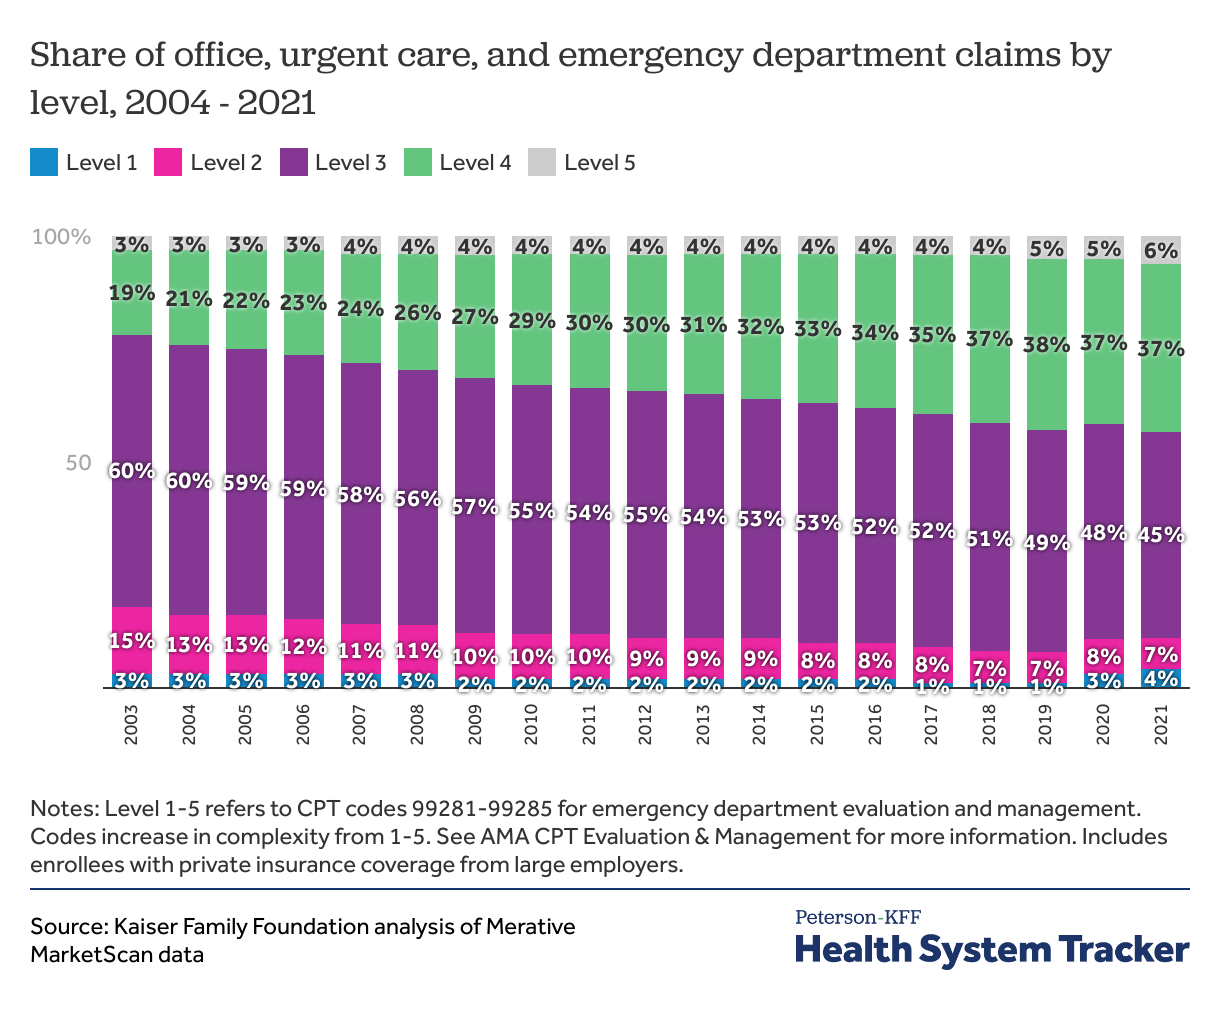
In this analysis, we find a trend toward higher level claims in physician offices, urgent care centers and emergency departments, though this trend is most pronounced in emergency departments. Taking claims from all three settings, we find that the share of moderate intensity (level 3) claims decreased from the majority (60%) of claims in 2004 to less than half (45%) in 2021. Meanwhile, higher intensity level 4 claims almost doubled in frequency, from 19% in 2004 to 37% in 2021. The shares of claims at each level remained relatively stable during the COVID-19 pandemic in 2020 and 2021. Levels 3 and 4 claims continued to be the most common during this time; however level 5 claims continued to increase in frequency to 6% in 2021. During the pandemic, level 1 and 2 claims also increased to 4% and 7% respectively by 2021.
In emergency departments, level 4 and 5 codes now make up the majority of claims
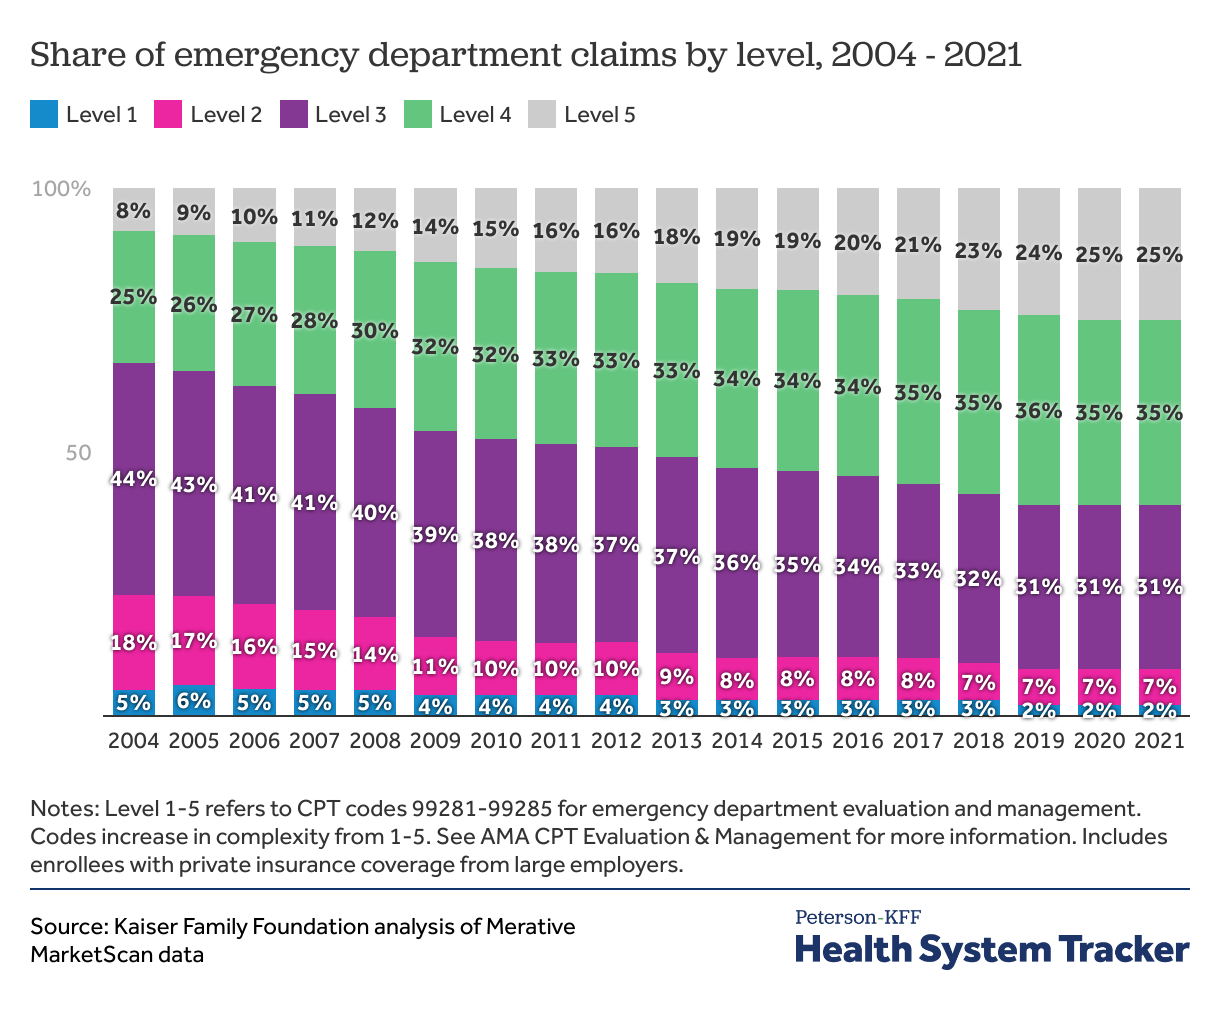
In the emergency department, the most common claim in 2004 was level 3. However, by 2021, level 4 was the most common and accounted for over one third (35%) of claims. Level 5 claims increased in frequency from 8% of emergency department claims in 2004 to a quarter of claims by 2021. The growing number of urgent care centers in the past two decades may contribute to increased acuity in emergency departments by siphoning less sick patients away from emergency departments. However, we also find that visit complexity is rising outside of the emergency department.
In outpatient physician offices, the share of level 4 claims has grown
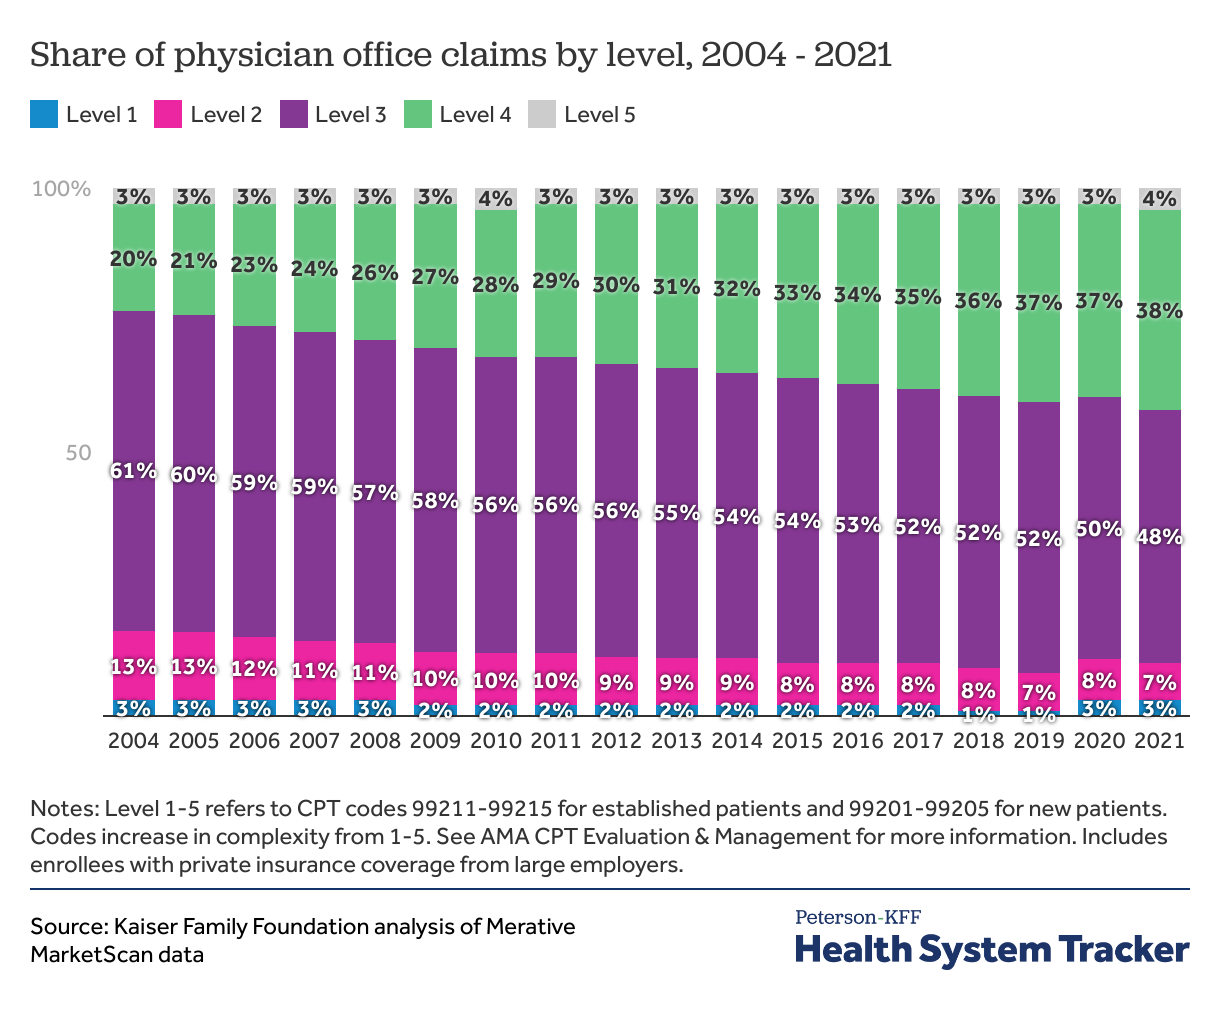
In outpatient physician offices, the share of higher level claims also grew over time. Level 3 claims remained the most common from 2004 to 2021, but the share of level 3 claims reduced from 61% in 2004 to 48% in 2021. In 2004, level 4 claims accounted for 1-in-5 outpatient office claims, which increased to over one third of claims in 2021 (38%). Across the period of our study, outpatient physician offices had a relatively low proportion of the lowest level (level 1) and the highest level (level 5) claims.
In urgent care centers, higher level claims are also becoming more common
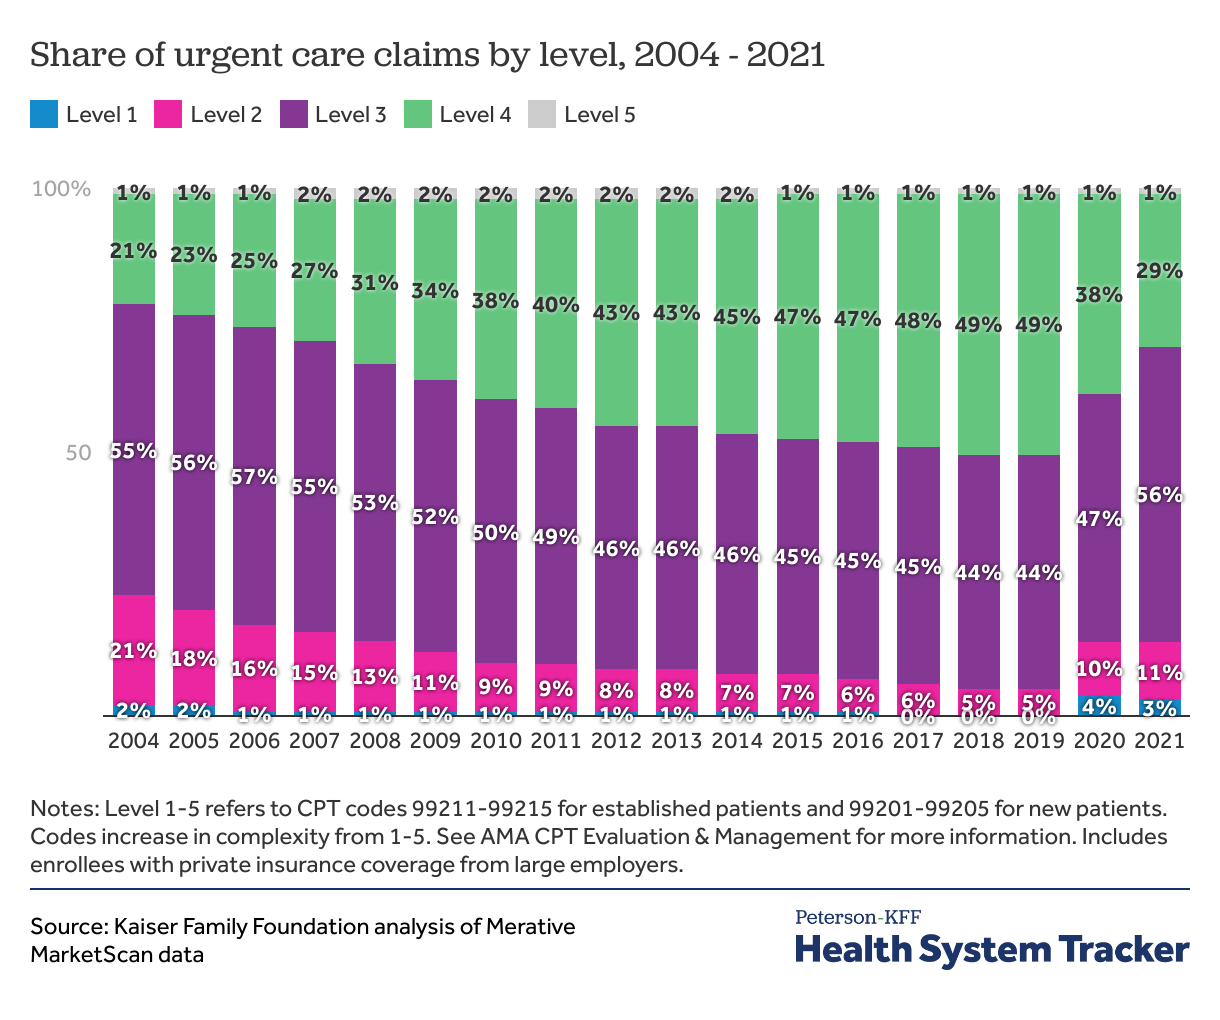
In urgent care centers, level 3 and 4 claims accounted for 76% of claims in 2004 and reached 93% of claims by 2019, before down trending during the pandemic years. Level 4 claims grew from less than a quarter (21%) of all urgent care claims in 2004 to almost half (49%) before the pandemic. The share of lower complexity claims decreased during this time. In 2004, almost a quarter of claims (23%) were level 1 or level 2. By 2019, level 2 claims made up 5% and level 1 claims made up 0% of all claims in urgent care centers. During 2020 and 2021, we observed a growth in level 1-3 claims at urgent care centers, and a decrease in level 4 claims. These changes may represent shifting health care utilization during the pandemic, changes in billing practices, or a combination of multiple factors.
Even for specific diagnoses, trends in claim levels are consistent over time
Over time more people in the U.S. have been diagnosed with comorbid conditions, which may make patients more complex or resource intensive to treat and may contribute to the increasing complexity of outpatient claims. However, we find that trends in coding levels are reflected even in diseases that are less likely to be worsening over time or in which comorbidities have a smaller impact. We restrict our analysis to younger people (<65), who are less likely to have chronic conditions, and we also find that the average age of our population remained consistent during our analysis, suggesting that the aging population is not a contributor to the increases in billing complexity we find.
For urinary tract infections visits are increasingly coded at higher levels
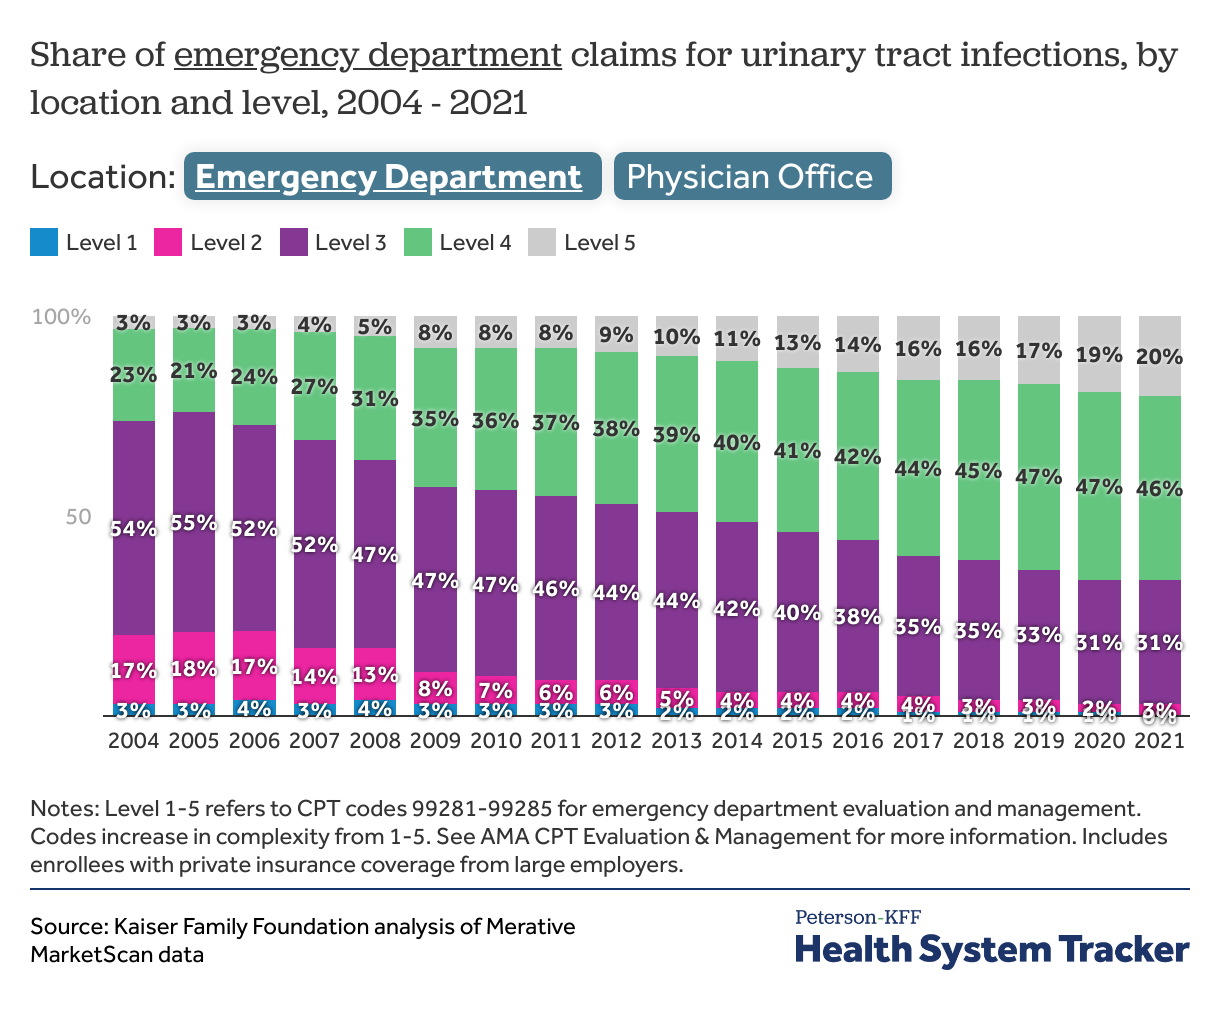
For urinary tract infections, moderate complexity (level 3) claims were over half (54%) of emergency department claims and two-thirds (67%) of all outpatient office claims in 2004. By 2021, level 3 claims accounted for only 31% of emergency department claims and 57% of outpatient office claims. In the emergency department, 1-in-5 claims for urinary tract infections was level 5 in 2021.
The majority of headache claims are now level 4 or 5
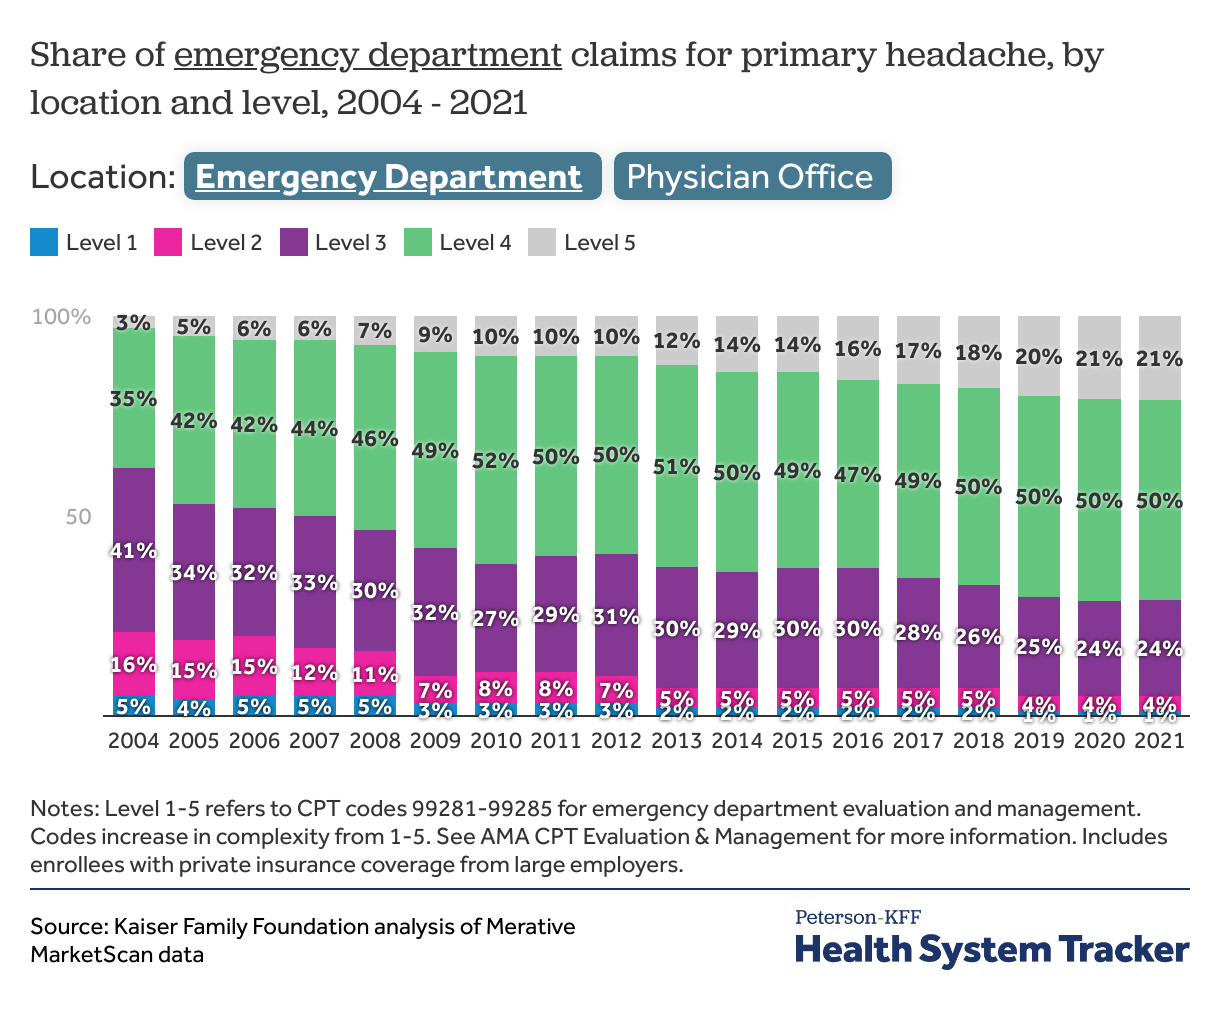
For headache, level 3 claims were the most common in 2004 in both physician offices (58%) and emergency departments (41%). By 2021, level 4 claims were the majority in both settings. In the emergency department, the share of level 5 claims more than tripled from 2004 to 2021.
Emergency evaluation and management claims are 4.5 times as expensive as office claims, on average
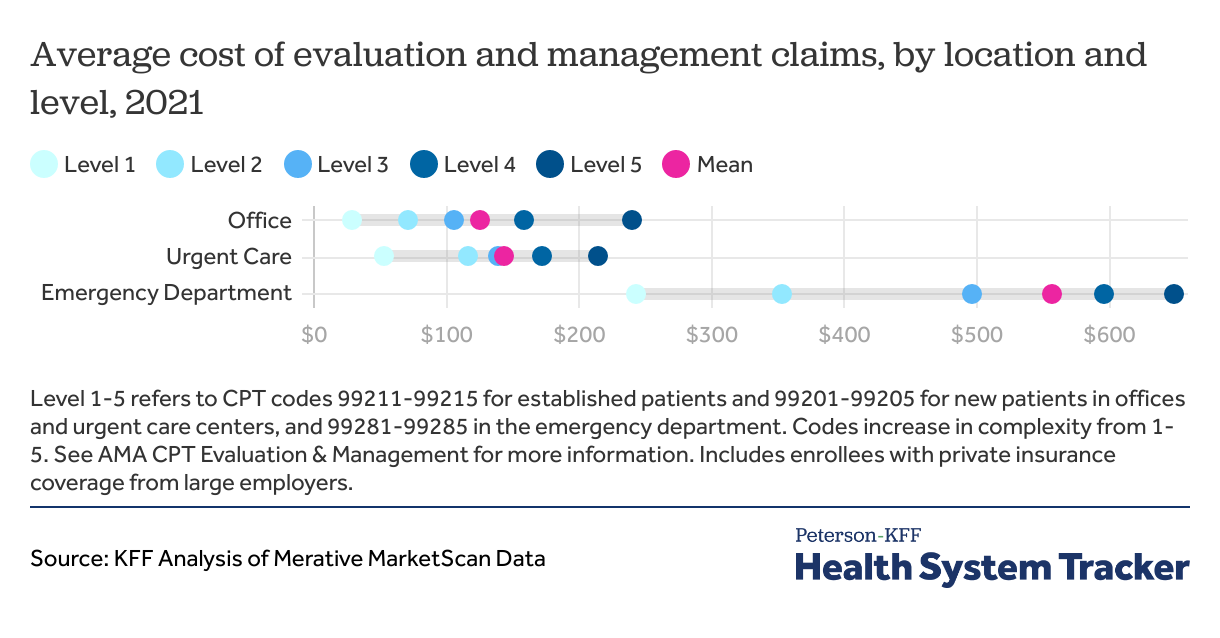
In 2021, the average cost of evaluation and management services was almost 5 times as expensive in the emergency department ($556) compared to outpatient physician offices ($125). Emergency department claims also have the most variation in cost by level. The average level 5 claim is over $400 more expensive than the average level 1 claim. Urgent care evaluation and management claims cost $147, on average.
The cost of higher level claims are growing faster than the cost of lower level claims
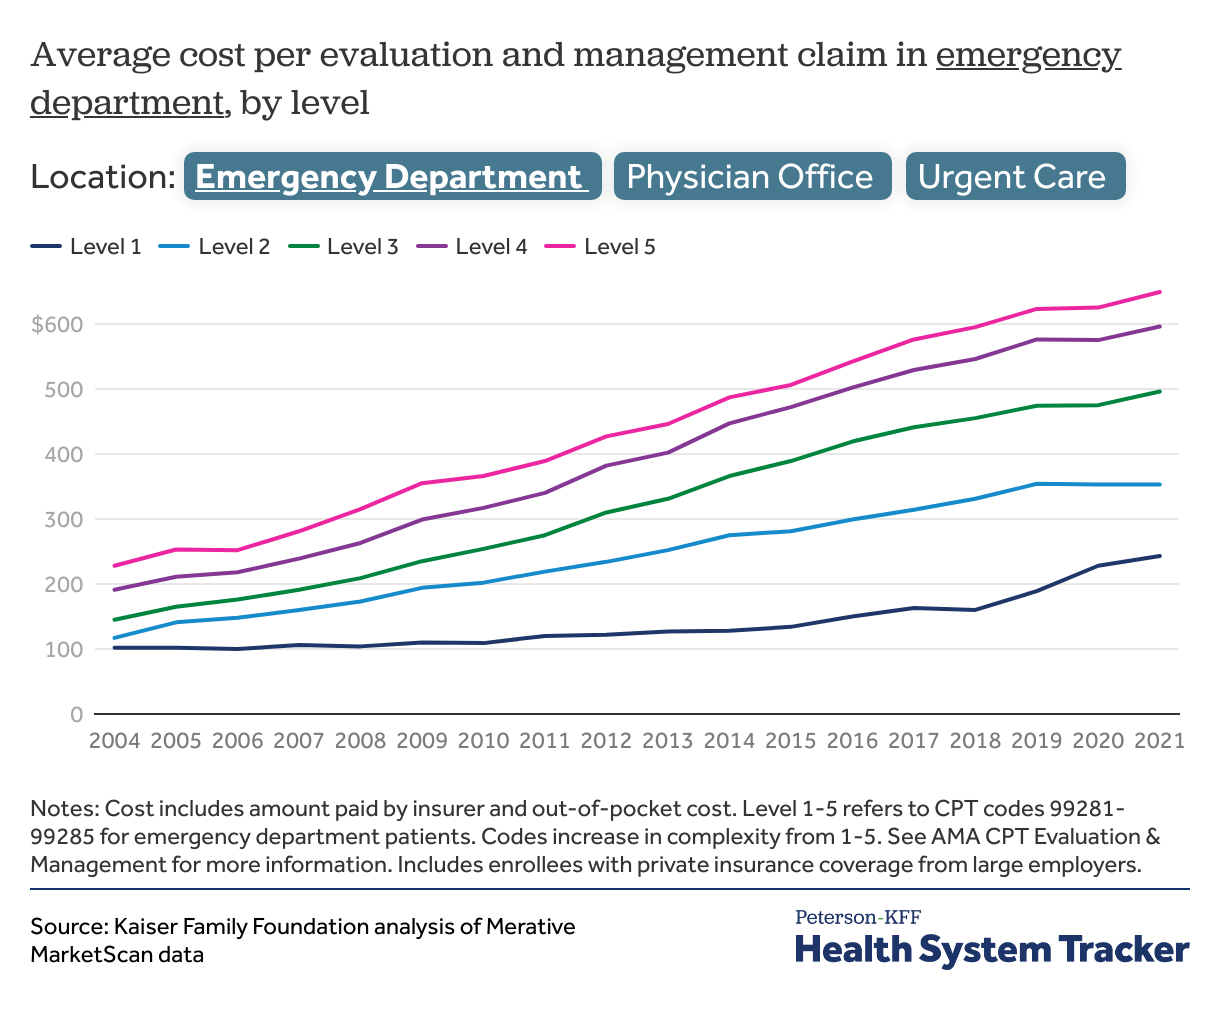
For each practice setting, costs of claims are growing at different rates. The emergency department saw the largest relative increase in evaluation and management costs at all levels. Level 1 claims increased in cost by 138%, and level 5 claims increased by 185% from 2004 to 2021. In offices, the cost of Level 1 visits remained relatively flat, increasing by 3%, while the cost of the highest complexity (Level 5) outpatient office claim increased by 79%. In urgent care centers, the gap between the lowest complexity and highest complexity claims also widened. The cost of level 1 claims remained flat, while the cost of level 5 claims increased by 59%.
Implications for outpatient spending
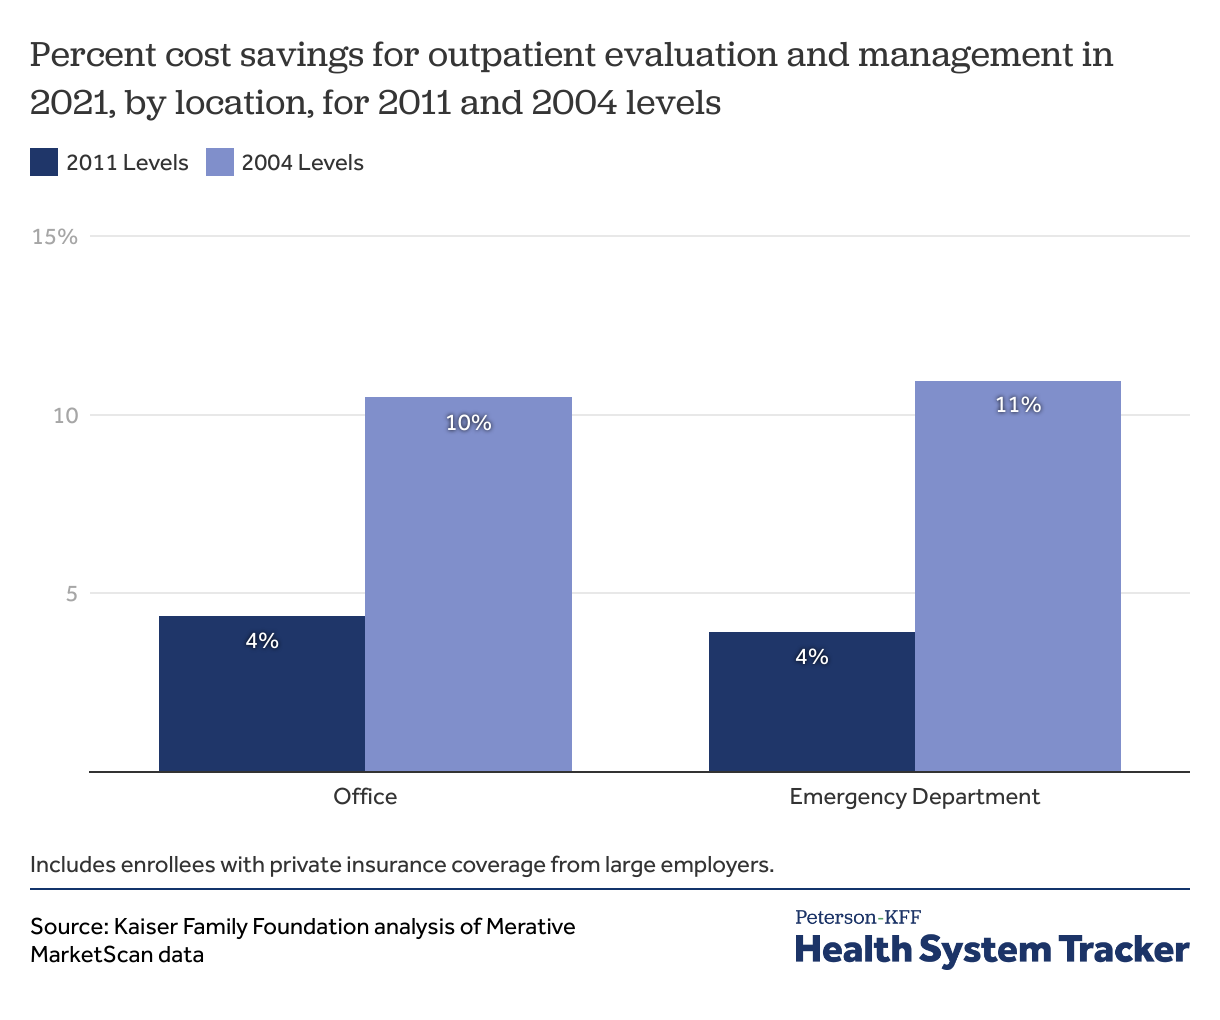
Next, we examine how much lower 2021 spending would have been if visits were billed at the same levels as 10 years earlier. To do this, we multiply the average cost of each level claim in 2021 (e.g., the average level 5 emergency visit in 2021 was $556) times the share of visits that were billed at that level in 2011 (e.g., 16% of emergency visits were billed at level 5 in 2011). We calculate hypothetical total spending on evaluation and management services for the 2021 population using 2021 costs and 2011 levels, and we compare this to the actual 2021 spending using 2021 levels.
We find that if outpatient visit levels were coded the same in 2021 as they were in 2011, there would have been significant cost-savings in 2021. Both physician office and emergency department evaluation and management spending would have been 4% lower in 2021 than 2021 actual spending. Using 2004 levels instead of 2011 levels, emergency department spending would be 11% lower and office spending would be 10% lower in 2021 than actual 2021 spending. The majority of the cost saving would come from outpatient office claims because they make up a larger share of the outpatient evaluation and management spending we studied (69%) compared to emergency departments (27%) and urgent cares (3%). These numbers do not identify the portion of cost savings related to changes in services provided versus changes in billing patterns, since we did not control for clinical characteristics of the population.
Discussion
Over time, outpatient visits are being coded at higher levels, thus resulting in higher costs. We find that if the distribution of claim levels had stayed consistent over the prior ten years, outpatient evaluation and management costs would have been 4% lower in 2021. Of the outpatient settings we studied, emergency department evaluation and management claims are coded at the highest levels and are the most expensive, on average; however, outpatient office visits are the largest contributor to aggregate outpatient health expenditures because of the larger number of office visits.
The trend toward higher levels is seen across all outpatient settings, including emergency departments, urgent care centers, and physician offices. Increasing levels of visit complexity could reflect changes in billing, services provided, patient acuity, or a combination of factors. We did not control for clinical acuity; however, we did observe a trend towards higher claim levels even for specific conditions that are less likely to be worsening over time or for which comorbidities have a smaller impact, like headaches and urinary tract infections.
Overall, our findings demonstrate that regardless of the driving factors, increasing billing at higher levels for outpatient care has led to substantial increases in outpatient visit spending at the health system level. For consumers who bear the marginal costs of more expensive services—those with co-insurance or deductibles—this trend impacts out-of-pocket costs in addition to overall health system costs.
Methods
This analysis is based on data from the Merative MarketScan Commercial Database, which contains claims information provided by a sample of large employer plans. This analysis used claims for almost 14 million people representing about 17% of the 85 million people in large group market plans (employers with a thousand or more workers) from 2004-2021. To make MarketScan data representative of large group plans, weights were applied to match counts in the Current Population Survey for enrollees at firms of a thousand or more workers by sex, age and state. Claims were included if they were below the 99.5th percentile of costs.
Claims were included and classified by location if their place of service was in the emergency department, office, or urgent care. We included claims that were classified as both professional and facility charges, if they were associated with evaluation and management procedure codes. Evaluation and management claims in the emergency department included 99281-99285, which are evaluation and management CPT codes that are specific to the emergency department. Note that in 2023, 99281 is no longer being used for physician encounters and these codes are now based only on complexity of medical decision-making; however these changes do not affect the time period included in our analysis. In the office, we included the outpatient established patient evaluation and management codes, which are 99211-99215, because the vast majority of visits in outpatient physician offices were for established patients. In urgent care, visits were relatively evenly divided between new and established patients, so we created an aggregate complexity level from 1-5 combining CPT codes 99211-99215 (established patients) and 99201-99205 (new patients). Primary headache, upper respiratory tract infection and urinary tract infection were defined by ICD-9 and ICD-10 codes included in each claim. Enrollees were considered to have a certain diagnosis if the relevant ICD code appeared in the “Diagnosis 1” on the claim.
This analysis has some limitations. First, we analyzed only spending that happened within the specific place in our analysis (emergency department, office, or urgent care). Some visits, especially emergency department visits, have testing such as imaging or lab studies that occur outside of the emergency department in a different part of the hospital, and these are not included in our analysis. Second, the MarketScan database includes only charges incurred under the enrollees’ plan and do not include balance billing to enrollees which may have occurred during the study period.
The Peterson Center on Healthcare and KFF are partnering to monitor how well the U.S. healthcare system is performing in terms of quality and cost.

