Over the last couple of years, there has been increased attention on the price of prescription drugs; polling data has shown that almost eight in ten people in the U.S. say the cost of prescription drugs is unreasonable, and three in ten report they have not taken a prescription medicine as directed because of the cost.
This chart collection explores trends in spending on prescription drugs among people with employer coverage, with a particular focus on people with high drug spending. Having previously explored national trends in prescription drug spending using data from the National Health Expenditures Account, in this analysis, we look at trends specifically for nonelderly people with large employer coverage (including employees and their covered spouses and dependents), using a large sample of claims data. Doing so allows us to understand more about the demographics of people who have high drug spending, and whether they are more likely to have certain health conditions.
We use a sample of the IBM MarketScan Commercial Claims and Encounters Database that includes claims provided by employers with more than 1,000 employees. This analysis focuses on spending for drugs purchased from a pharmacy, also called retail drugs. While people also face costs for drugs administered at a physician’s office or hospital (non-retail drugs), these costs are not as easily identified in claims data. One important limitation of this analysis is that the claims data do not include information about the value of rebates to insurers or patient assistant programs administered separately from the plan. We note when rebates are accounted for in these graphs, and when their absence is particularly limiting.
We find that about 4% of people with employer coverage have prescription drug costs totaling $5,000 or more, and about 3% have out-of-pocket prescription drug costs exceeding $1,000. Enrollees with total prescription drug spending exceeding $5,000 are more likely to be older and have health conditions such as infectious and parasitic diseases, respiratory conditions, mental illness, cancers and tumors, digestive diseases, endocrine disorders, and circulatory diseases.
Related Content:

Growth in prescription drug spending increased a bit in 2018, but has generally been moderate in recent years
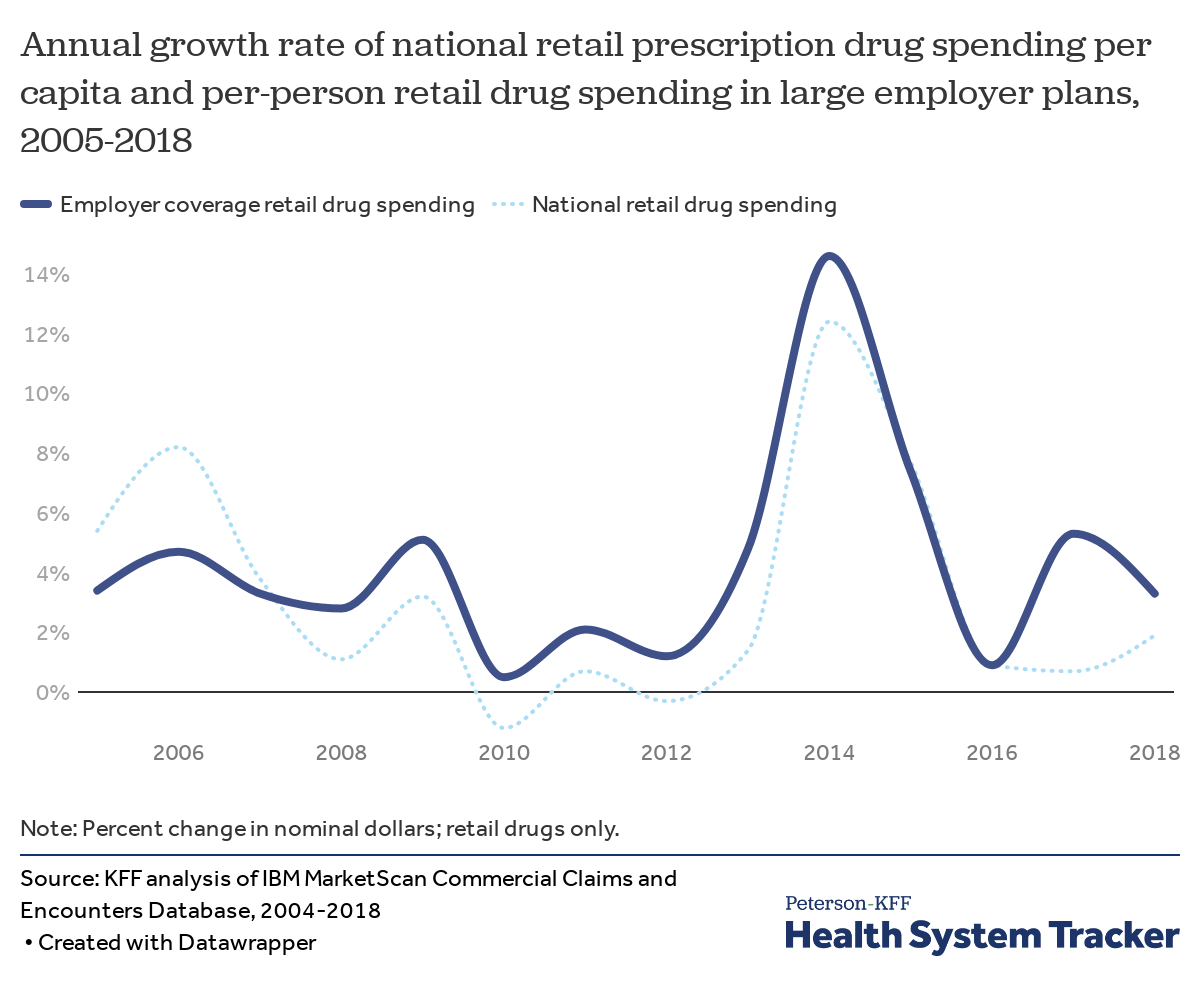
In 2018, prescription drug spending grew by 1.9% nationally (based on data from the National Health Expenditures Accounts) and by 3.3% for large employer plans.
In the 2010s, there was relatively low growth in drug costs in large employer plans, but, much like national spending, employer plans saw a large spike in drug spending of 14.6% in 2014 following the introduction of highly-priced specialty drugs and price increases for some brand name drugs. Spending growth moderated over the following two years, with almost no growth in 2016, followed by 5.3% growth in 2017 and 3.3% growth in 2018.
Even after rebates, drugs account for a large share of employer-sponsored health spending
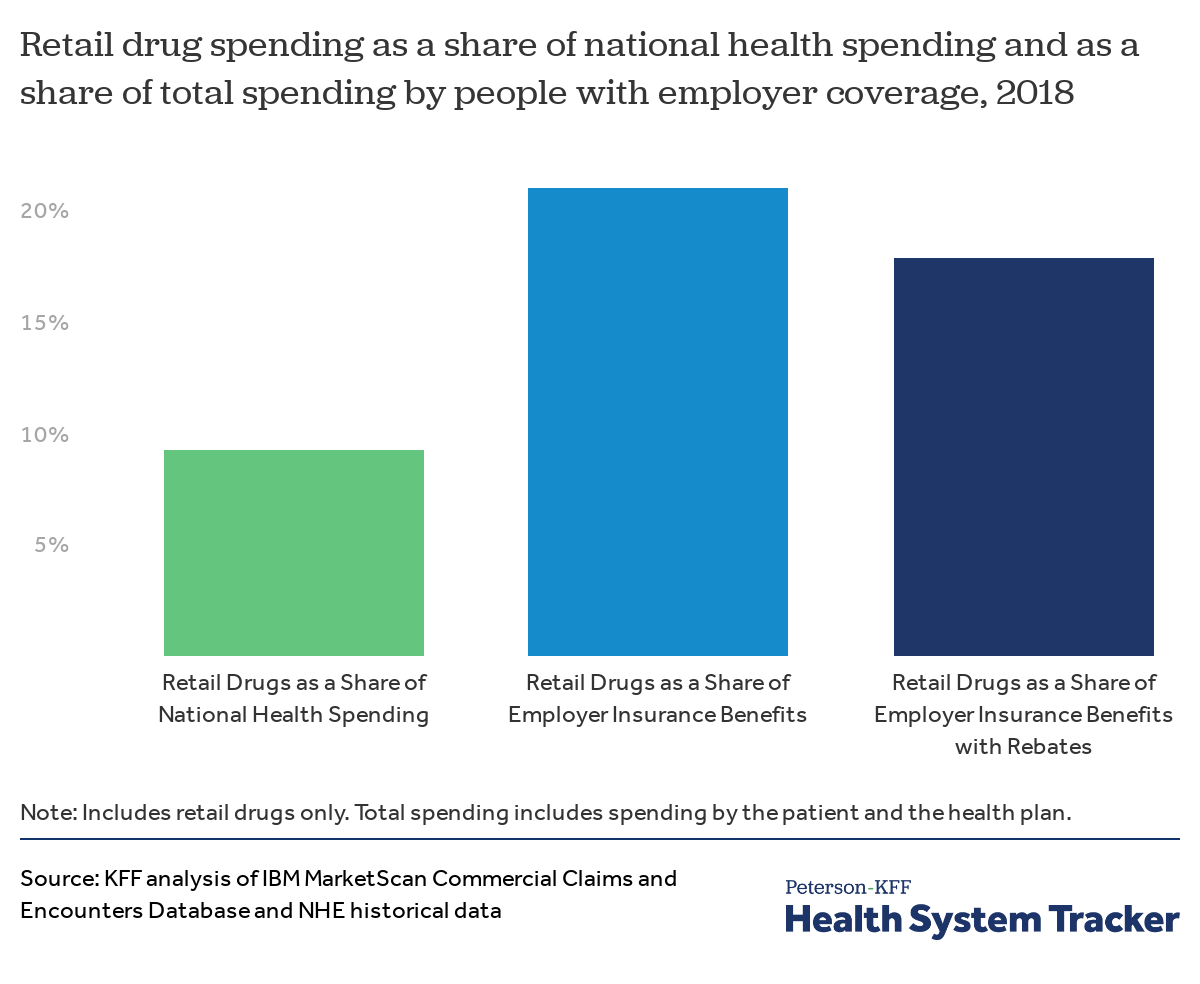
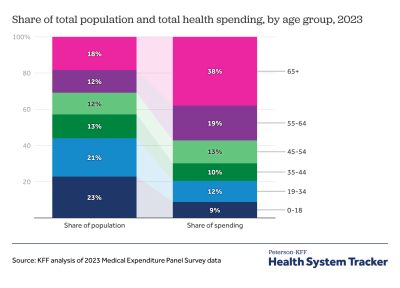
Looking at overall national health spending, drugs accounted for just 9% of total health spending in 2018. (The NHE data does adjust for rebates). Meanwhile, in the employer market, where enrollees tend to be healthier on average, drugs represent a larger share of total spending.
Retail prescription drug spending accounted for 21% of total spending in employer-sponsored health plans in 2018, before accounting for rebates drug manufacturers give to insurers and pharmacy benefits managers. Because drug spending represents a larger share of employer plans than for public programs, changes in drug prices or utilization can have a big effect on premiums and patient costs.
Adjusting for an estimate of rebates lowers the share of spending in employer plans for drugs to 18%. We calculated the aggregate impact of rebates by applying the same proportion reported manufacturer rebates are of total prescription drug point-of-purchase spending by private insurance, using a method similar to that described by Altarum. As we are only able to do this calculation in the aggregate, and not for specific drugs, the rest of this analysis shows spending before accounting for rebates.
A small share of enrollees have high levels of retail drug spending
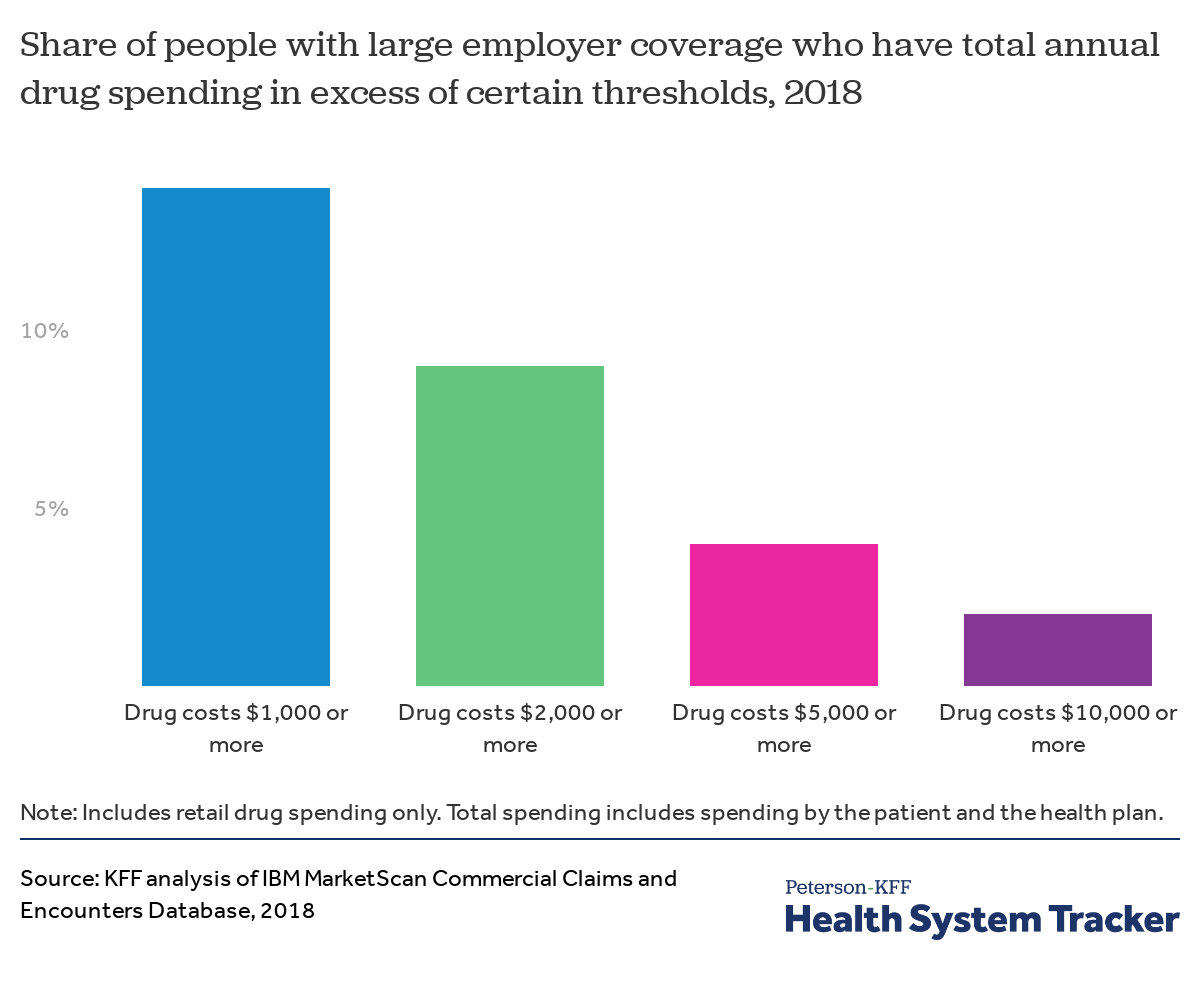
Each year, a relatively small share of people with large employer coverage have very high total retail drug spending. In 2018, 14% of enrollees had $1,000 or more in total retail drug spending, and a smaller share of enrollees saw even higher levels of drug spending: 9% of enrollees had $2,000 or more in drug spending, 4% had $5,000 or more, and just 2% had $10,000 or more in drug spending. This spending reflects the cost borne both by the health plan and by enrollees through cost-sharing, such as deductibles or copays.
People with high drug spending are older, on average, than those with little or no drug spending
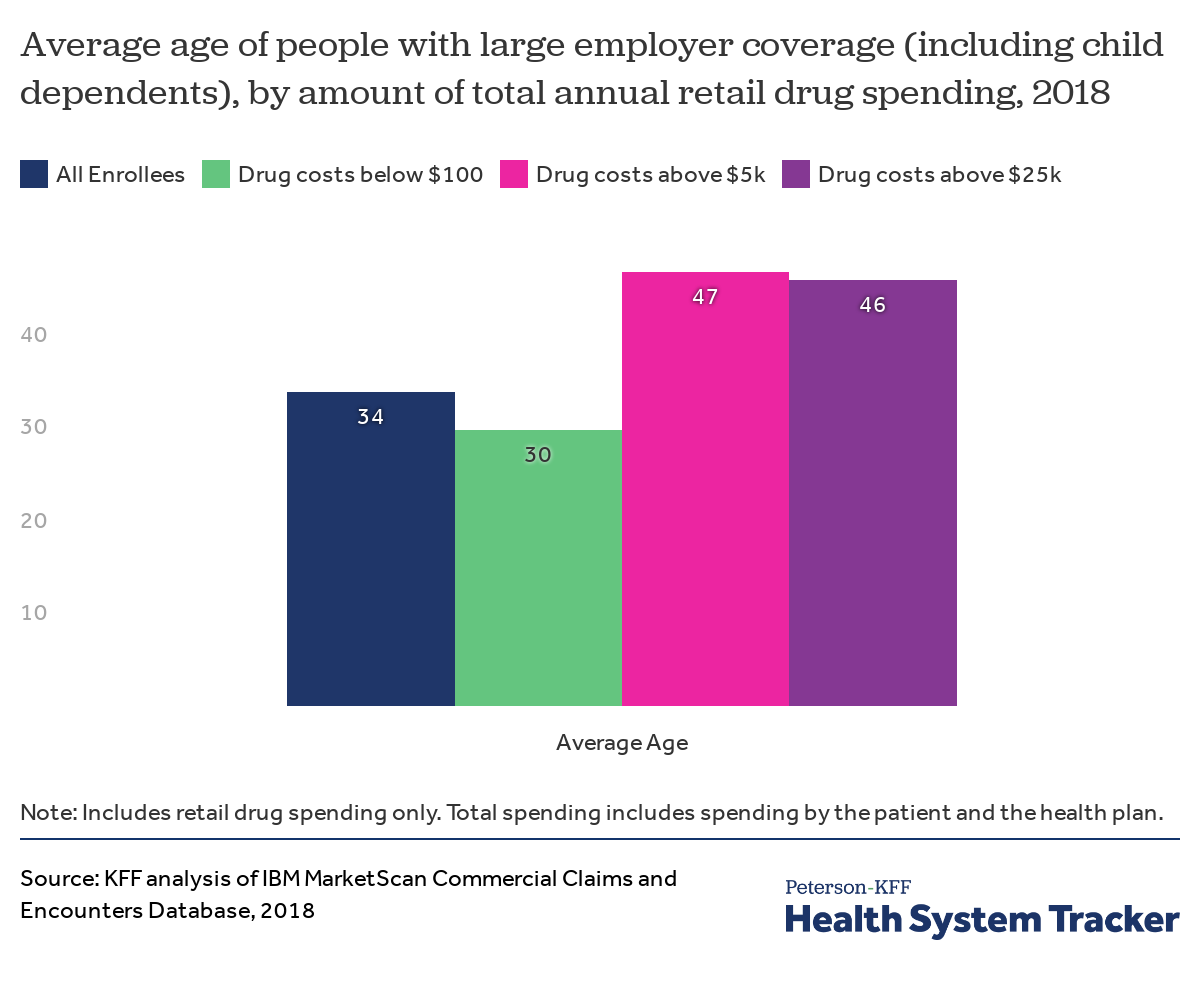
People with employer coverage whose drug spending exceed $5,000 are about 47 years old on average, while employees or their family members with drug costs below $100 are about 30 years old on average.
Female and male enrollees are similarly likely to have high drug spending, but male enrollees are more likely to have little to no drug spending
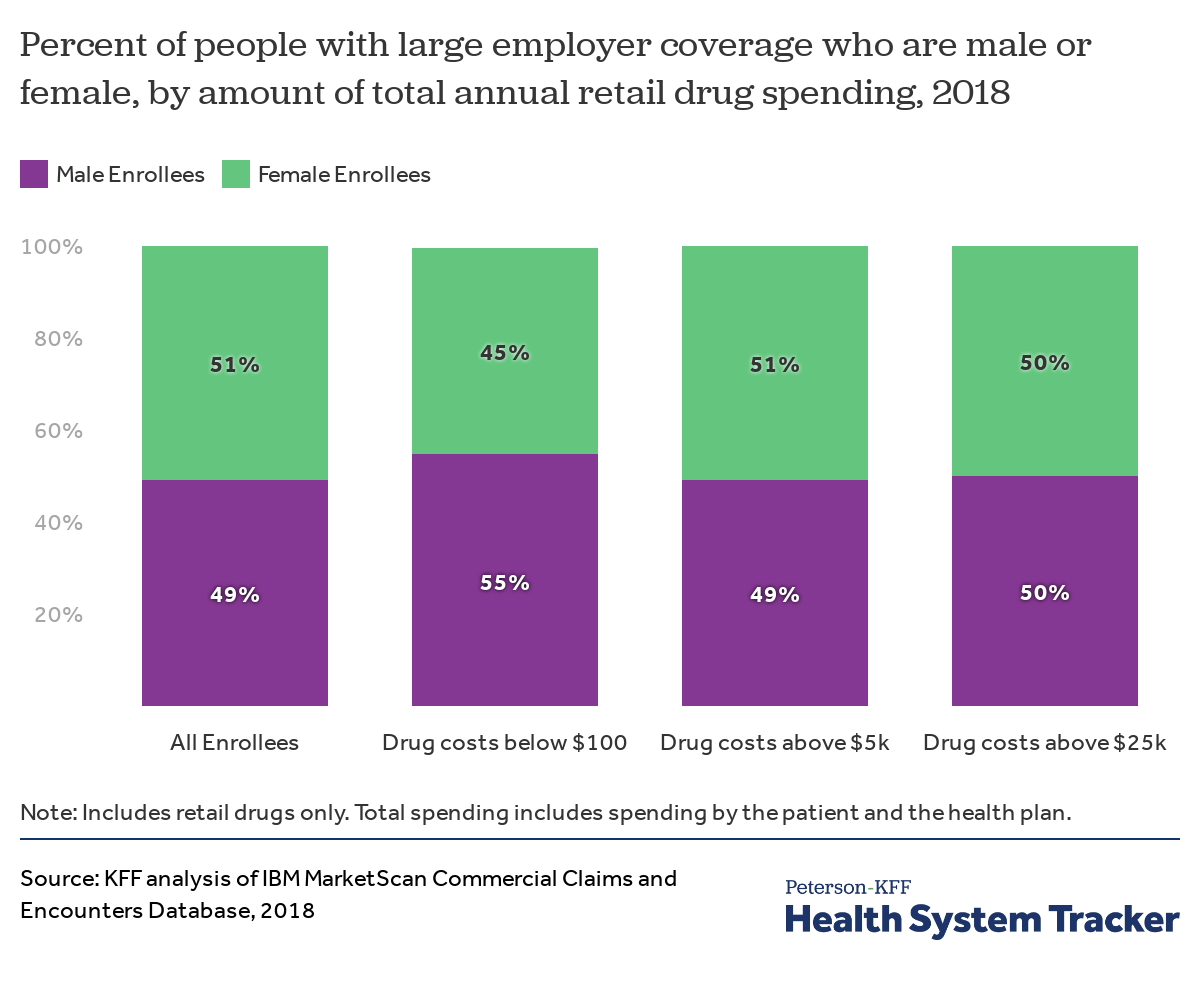
Male enrollees are more likely than female enrollees to have very low drug spending (from $0 to $100), in large part due to many women taking oral contraceptives. However, male and female enrollees are similarly likely to have high drug spending.
Related Content:
Enrollees with certain diagnoses have much higher average drug spending
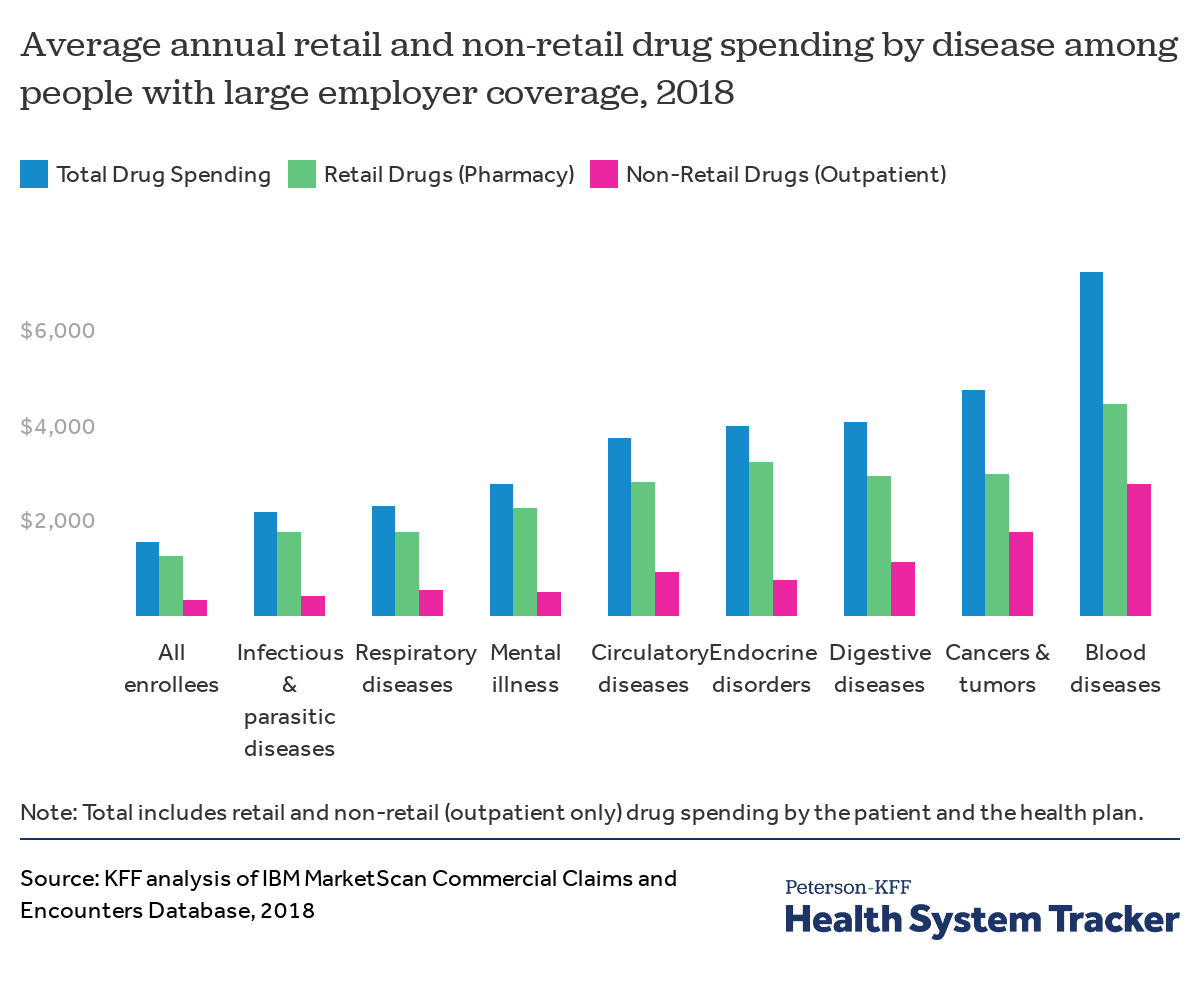
Workers and their family members with certain health conditions tend to have higher total drug spending (the amount paid by insurance and out of pocket combined). For example, large employer plan enrollees diagnosed with diseases of the blood (such as hemophilia), cancers and tumors, digestive diseases, circulatory conditions, and endocrine disorders (such as diabetes and obesity) on average have total drug spending that is more than twice as high as the average across all enrollees.
In addition to having high pharmacy (retail drug) spending, people with some health conditions also have high costs for drugs administered at a physician’s office or hospital (non-retail drugs). For example, many types of chemotherapy are administered in a physician’s office and would therefore not be counted as a retail drug. This chart also shows the costs of non-retail drugs administered in an outpatient setting (such as in doctors’ offices and clinics). Most drugs administered in an inpatient setting (such as in a hospital) are not itemized in a way that would allow us to show those costs.
Enrollees with certain diagnoses are more likely to have exceptionally high drug spending
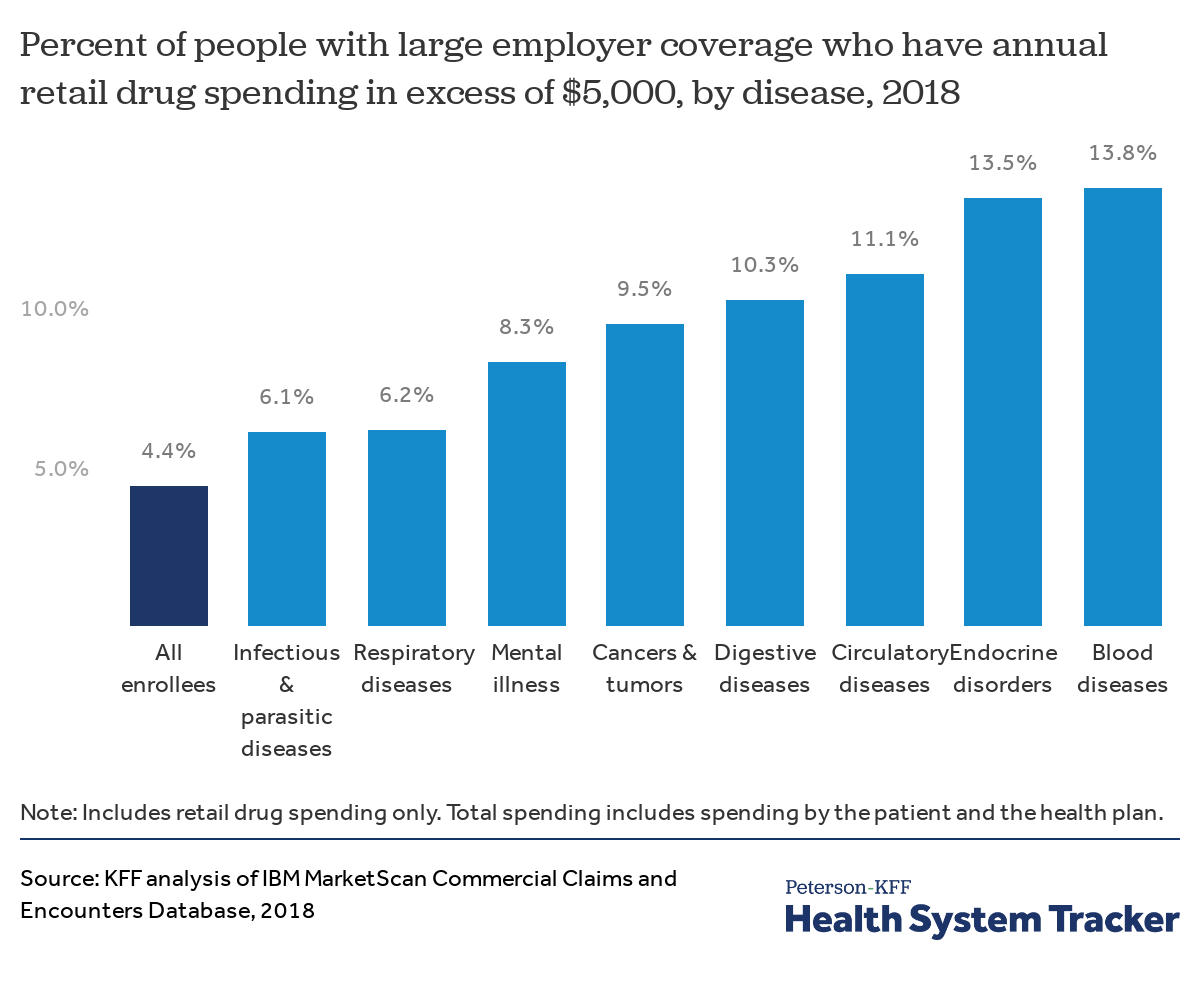
Workers and their family members with certain diagnoses are more likely to have exceptionally high retail drug spending. Just 4.4% percent of all enrollees in large employer plans have retail (pharmacy) drug spending that exceeds $5,000 in a given year. However, people diagnosed with conditions including infectious and parasitic diseases, respiratory conditions, mental illness, cancers and tumors, digestive diseases, endocrine disorders, circulatory diseases, and diseases of the blood are all more likely to have retail drug spending in excess of $5,000.
On average, insurance covers a larger share of retail prescription drug spending than a decade ago
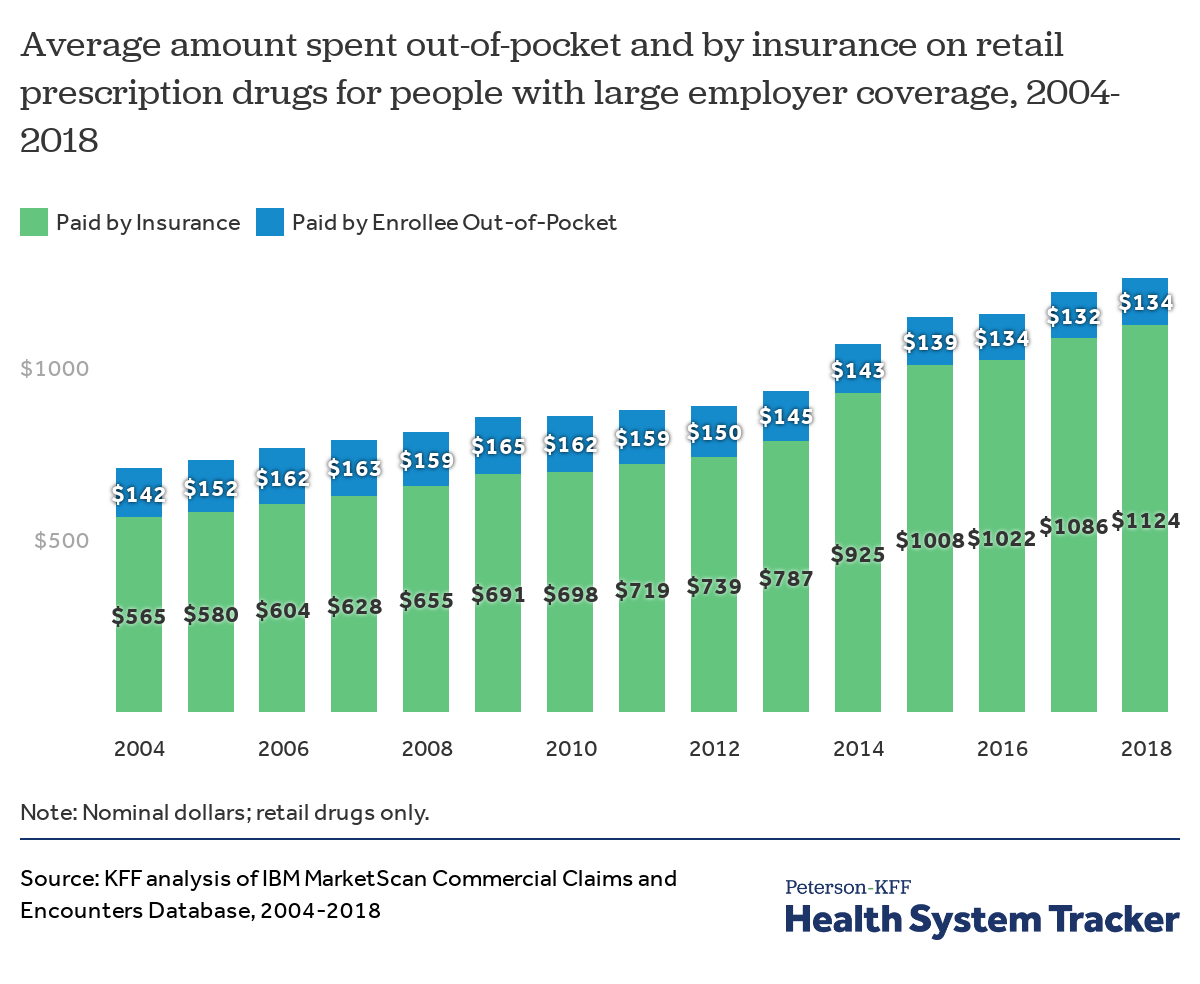
Out-of-pocket spending on retail prescription drugs declined from a recent high of $165 per person in 2009 to $134 in 2018, on average among people with employer coverage. When adjusted for inflation, average out-of-pocket retail drug spending for people with large employer coverage declined 29% from $190 per person in 2004 (in 2018 dollars) to $134 in 2018.
Driving this drop in out-of-pocket spending on drugs was both a “patent cliff,” when several drugs faced generic substitution, and the Affordable Care Act’s requirement that oral contraceptives (and other preventive services) be covered without cost-sharing. Additionally, even as new high-priced specialty drugs entered the market, employer plans picked up a larger share of the costs.
As drug costs have risen overall, large employer health plans have taken on a greater share of the costs, with drug coverage becoming more generous over time. Some of this increased generosity is potentially offset by increased rebates paid to insurers by manufacturers, which are not reflected in the amounts shown here. In 2018, large employer health plans covered about 89% of retail prescription drug spending on average, up from 80% in 2004.
In 2004, people with large employer coverage had drug spending averaging $707, of which insurance covered $565 and enrollees paid the remaining $142 out-of-pocket. By 2018, average drug spending had increased to $1,258 per person, while out-of-pocket spending decreased to $134 on average, leaving insurers paying substantially more for retail drugs.
Related Content:

Over time, people with employer coverage have become more exposed to the underlying cost of drugs through deductibles and coinsurance
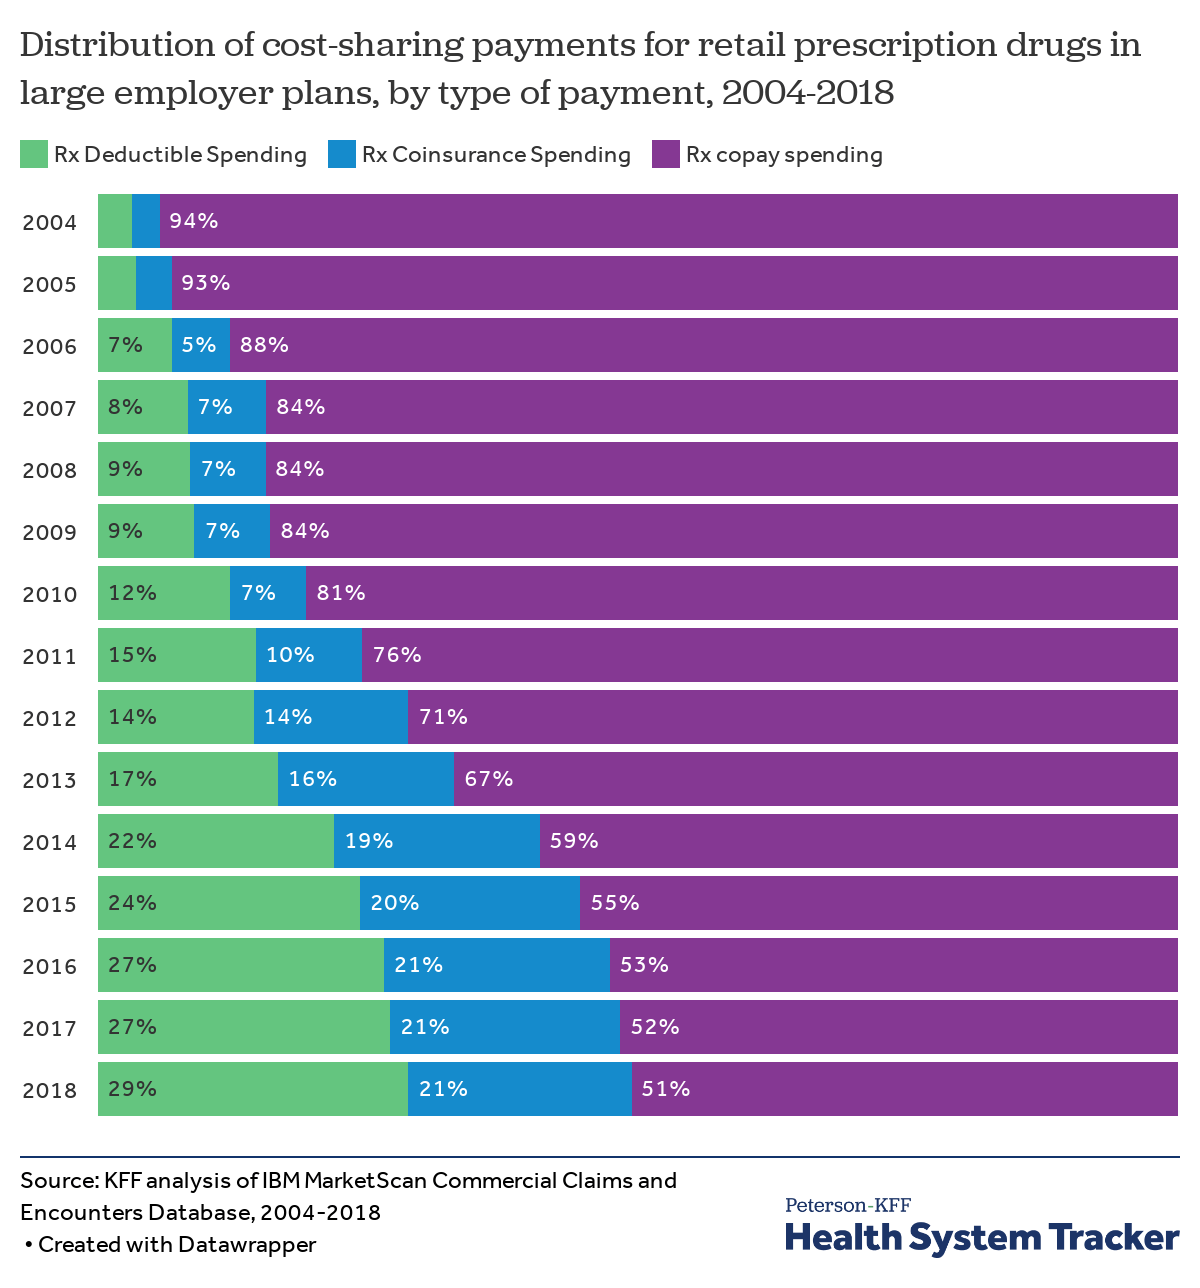
Over time, out-of-pocket spending for prescription drugs has shifted from being paid almost entirely through copayments towards greater deductible and coinsurance spending (reflecting a general trend of higher deductibles in employer plans). Enrollees may be more sensitive to the actual price of prescription drugs and other healthcare when they must pay deductibles and coinsurance than they are with copays, which are flat dollar amounts. Additionally, copays require smaller, periodic payments that may add up over time, while a deductible may need to be met at once, potentially causing affordability challenges.
About three percent of people have out-of-pocket drug spending exceeding $1,000 per year
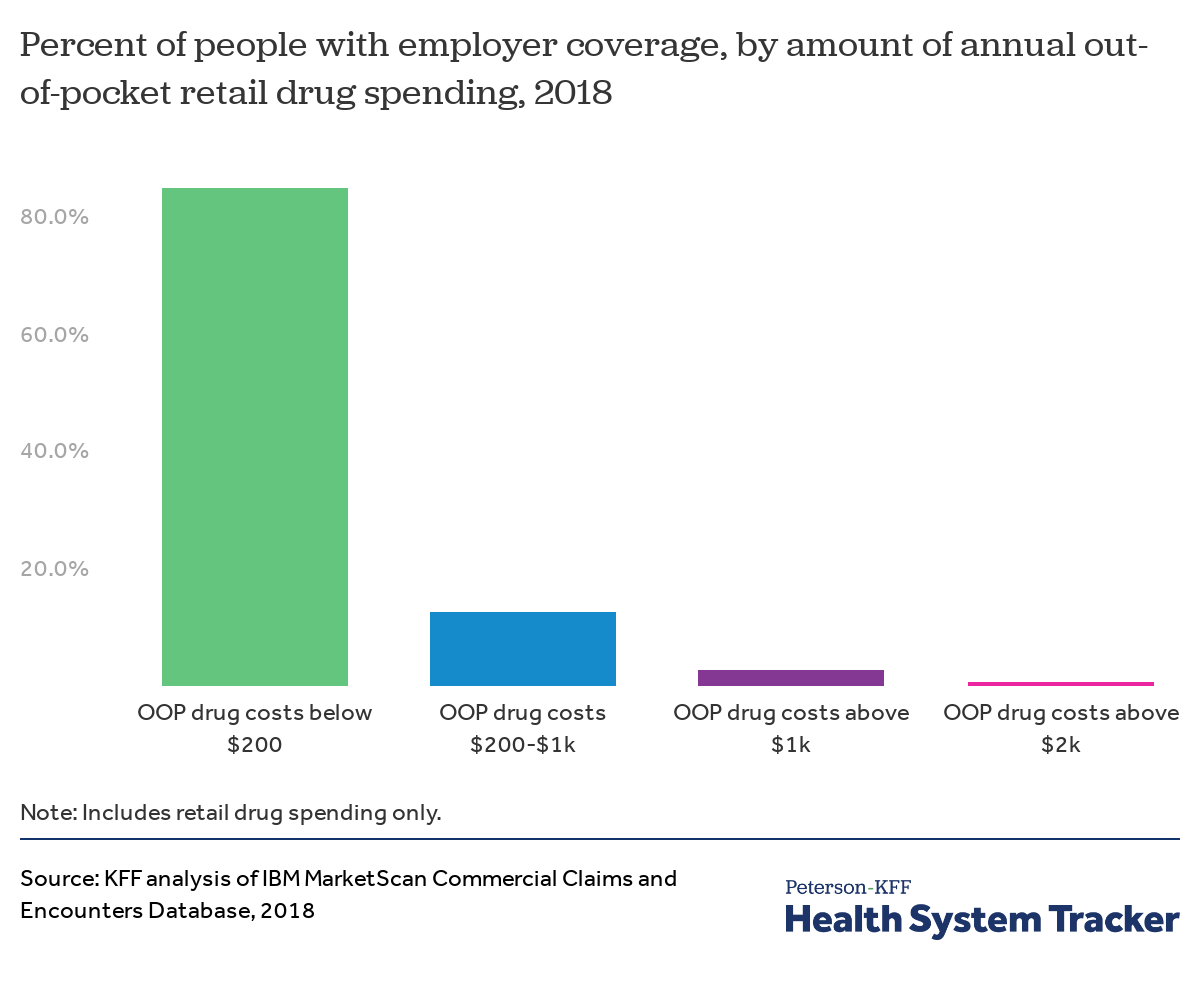
Most people with large employer coverage have little or no drug spending, and thus little or no out-of-pocket spending. However, some people have very high out-of-pocket costs for prescription drugs. In 2018, 2.6% of people with large employer coverage had out-of-pocket drug exceeding $1,000 per year, and just under 1% had out-of-pocket spending over $2,000. Note that these data include out-of-pocket spending for covered services (cost sharing), but some enrollees may purchase drugs that are not covered and pay all of that cost without submitting a claim.
People with certain health conditions are more likely to have high out-of-pocket drug spending
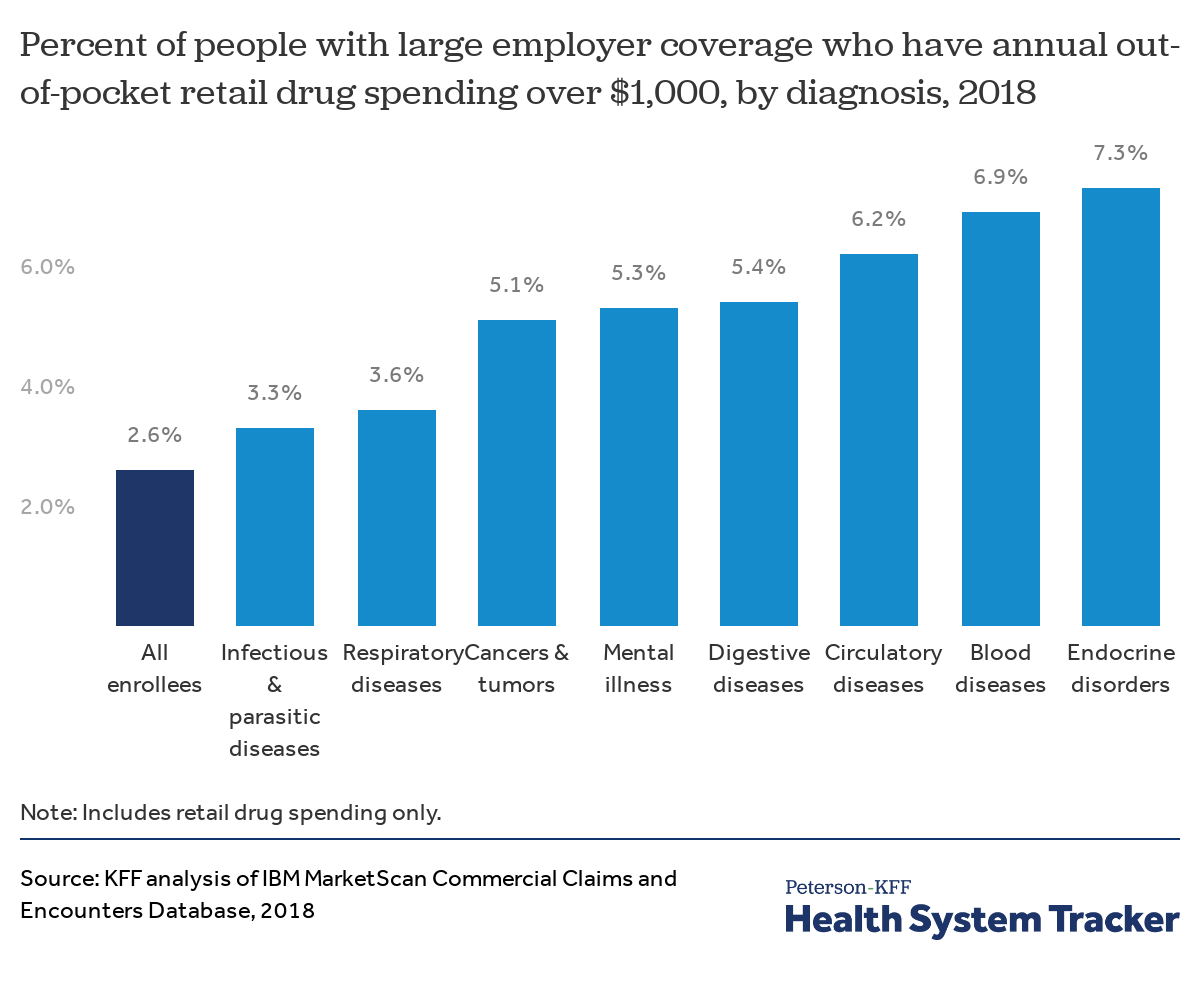
In large employer health plans, people who have certain diagnoses are more likely to have high out-of-pocket retail drug spending (in excess of $1,000 per year). This is particularly the case for people with a blood disease or endocrine disorder diagnosis (6.9% and 7.3% have out-of-pocket drug costs in excess of $1,000, respectively, compared to 2.6% of all enrollees).
People with out-of-pocket drug spending over $1,000 represent a small share of enrollees, but a larger share of drug spending
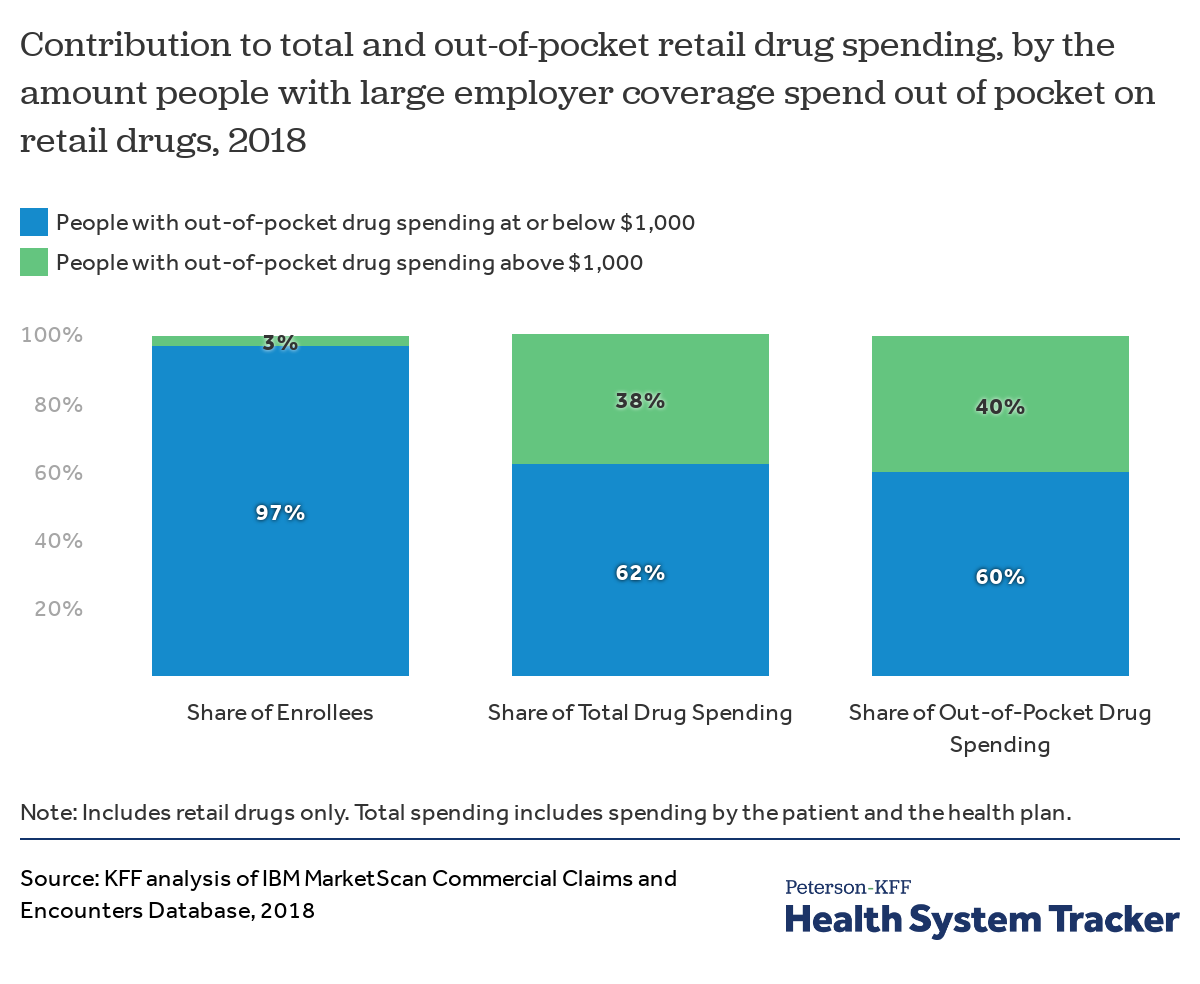
People with more than $1,000 in out-of-pocket drug spending represent just 3% of all people with large employer coverage, yet their prescription drug claims account for 38% of total retail drug spending and 40% of all out-of-pocket drug spending across enrollees.
Methods and Definitions
For the analysis of large employer plans, we analyzed a sample of medical claims obtained from the 2018 IBM Health Analytics MarketScan Commercial Claims and Encounters Database, which contains claims information provided by large employer plans. We only included claims for people under the age of 65, as people over the age of 65 are typically covered by Medicare. This analysis used claims for almost 18 million people representing about 22% of the 82 million people in the large group market in 2018. Seventy-percent of larger group enrollees who were enrolled for more than six months had at least one prescription drug claim in the year. Weights were applied to match counts in the Current Population Survey for enrollees at firms of 1,000 or more workers by sex, age, and state. Weights were trimmed at eight times the interquartile range.
The advantage of using claims information to look at out-of-pocket spending is that we can look beyond plan provisions and focus on actual payment liabilities incurred by enrollees. A limitation of these data is that they reflect cost-sharing incurred under the benefit plan and do not include out-of-pocket payments for non-covered services. One important limitation of this analysis is that the claims data show the retail cost for prescription drugs and does not include information about the value of rebates that may be received by payers. Prescription drug rebates vary considerably across particular drugs and drug categories, which can affect the costs associated with the diagnoses those drugs are used to treat.
ICD-10 diagnosis codes were used to classify 136 distinct illnesses and conditions. Disease classification is based on whether an enrollee received at least one primary diagnosis for any outpatient event or principal diagnosis for any inpatient admission at any point in 2018. We used the disease definitions developed by the Healthcare Cost and Utilization Project (HCUP).
The Peterson Center on Healthcare and KFF are partnering to monitor how well the U.S. healthcare system is performing in terms of quality and cost.