The cost of retail prescription drugs has become a top health policy issue for consumers and policymakers. KFF polling from July 2023 found that more than 1 in 4 adults taking prescription drugs report difficulty affording their medication, including 40% of those with household income of less than $40,000 per year.
In this chart collection, we use 2021 National Health Expenditures Accounts (NHEA) historical and projection data to look at trends in retail prescription drug spending and use. Retail prescription drugs do not include drugs that are physician-administered in hospitals, physician offices, outpatient centers, long term care facilities, and at home. Trends in physician-administered drug spending may differ from trends in spending on retail prescription drugs.
Growth in retail prescription drug spending per capita accelerated in 2021, and is expected to moderate in next decade
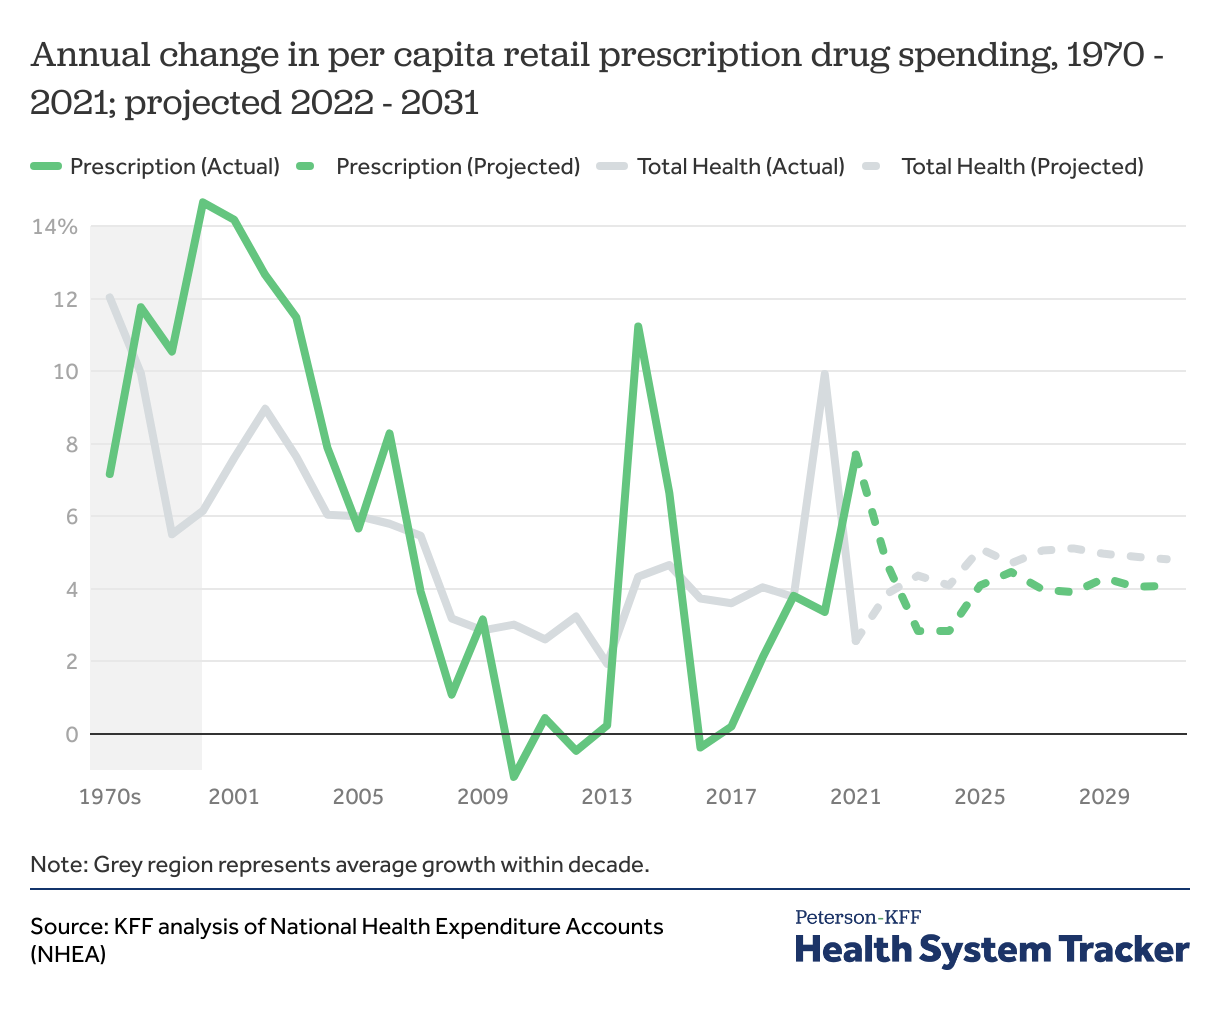
Following a slight decrease in 2020, per capita retail prescription drug spending increased in 2021. Spending growth in this category was fairly modest throughout the 2010s, with the exception of a period between 2013-2015 when two high-cost specialty Hepatitis C drugs came to market. Looking ahead, NHEA projections suggest growth in per capita drug spending is expected to be moderate through 2031.
Spending on retail prescription drugs has risen rapidly over the past three decades
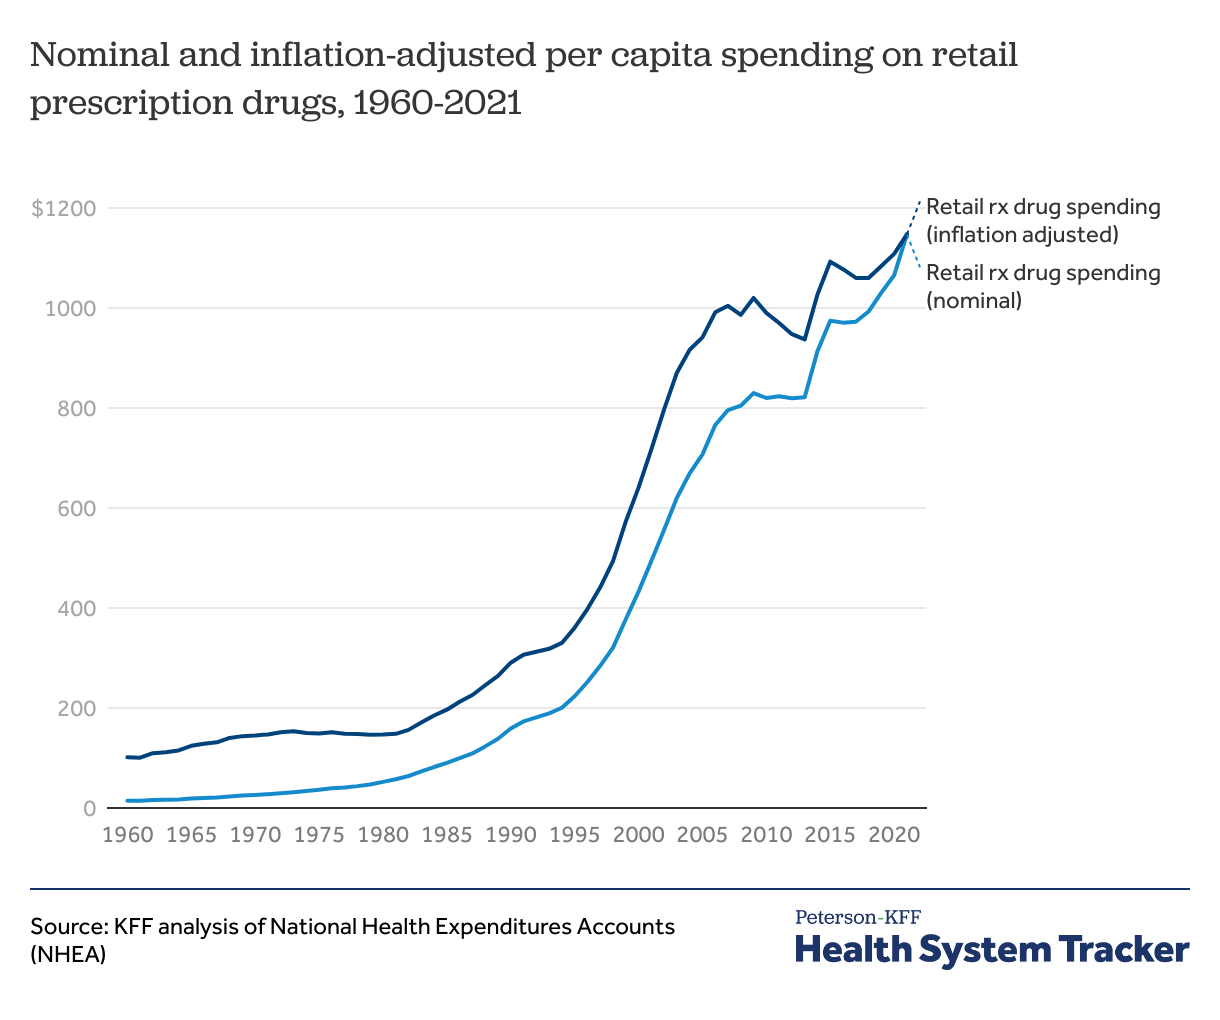
Spending on retail prescription drugs has increased rapidly since 1960, accelerating in the 1990s. Adjusted for inflation, retail prescription drug spending per capita in the U.S. increased from $101 in 1960 to $1,147 in 2021.
Out-of-pocket spending for retail prescription drugs, hospitals, and physician services increased slightly in 2021
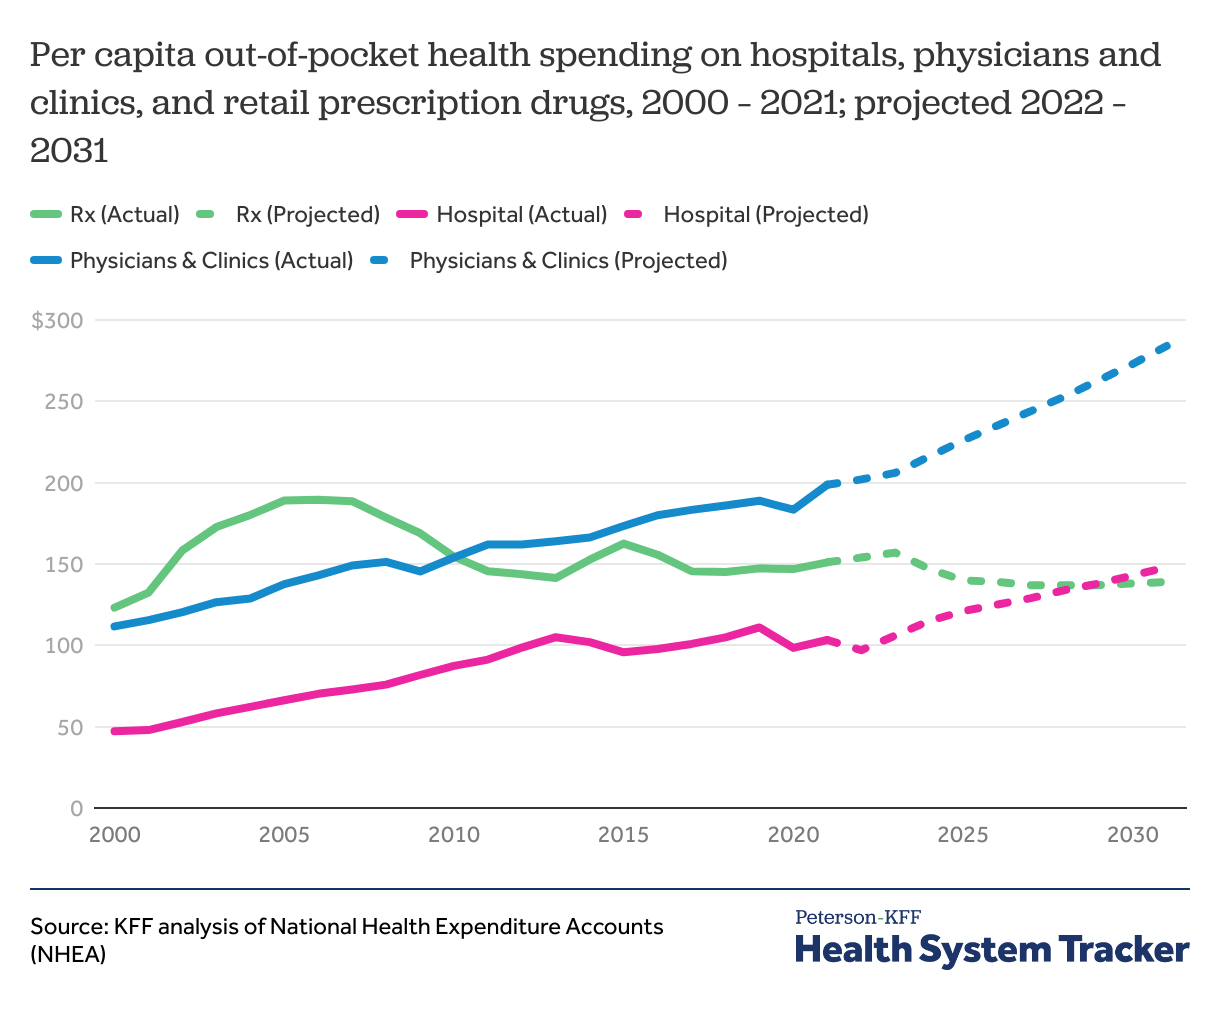
In contrast to hospital and physician spending, out-of-pocket prescription drug spending has declined since the mid-2000s. Additionally, out-of-pocket prescription drug spending is expected to decline by 8% by 2031, while physician and hospital spending are projected to increase by 43% and 44%, respectively.
In 2021, per capita out-of-pocket spending on retail prescription drugs, hospitals, and physician services each increased slightly from the previous year. Out-of-pocket spending per capita for physician services experienced the largest percent increase at 9% (from $183 per capita in 2020 to $199 per capita in 2021) as services resumed after a drop in the first year of the COVID-19 pandemic. Retail prescription drug out-of-pocket spending per capita remained the same from 2019 to 2020 and then slightly increased in 2021 ($147 per capita in 2019, $147 in 2020, and $151 in 2021). Per capita out-of-pocket spending on hospital services increased slightly from 2020 to 2021 as well ($98 per capita in 2020 and $103 per capita in 2021).
Majority of adults say the cost of prescription drugs is unreasonable
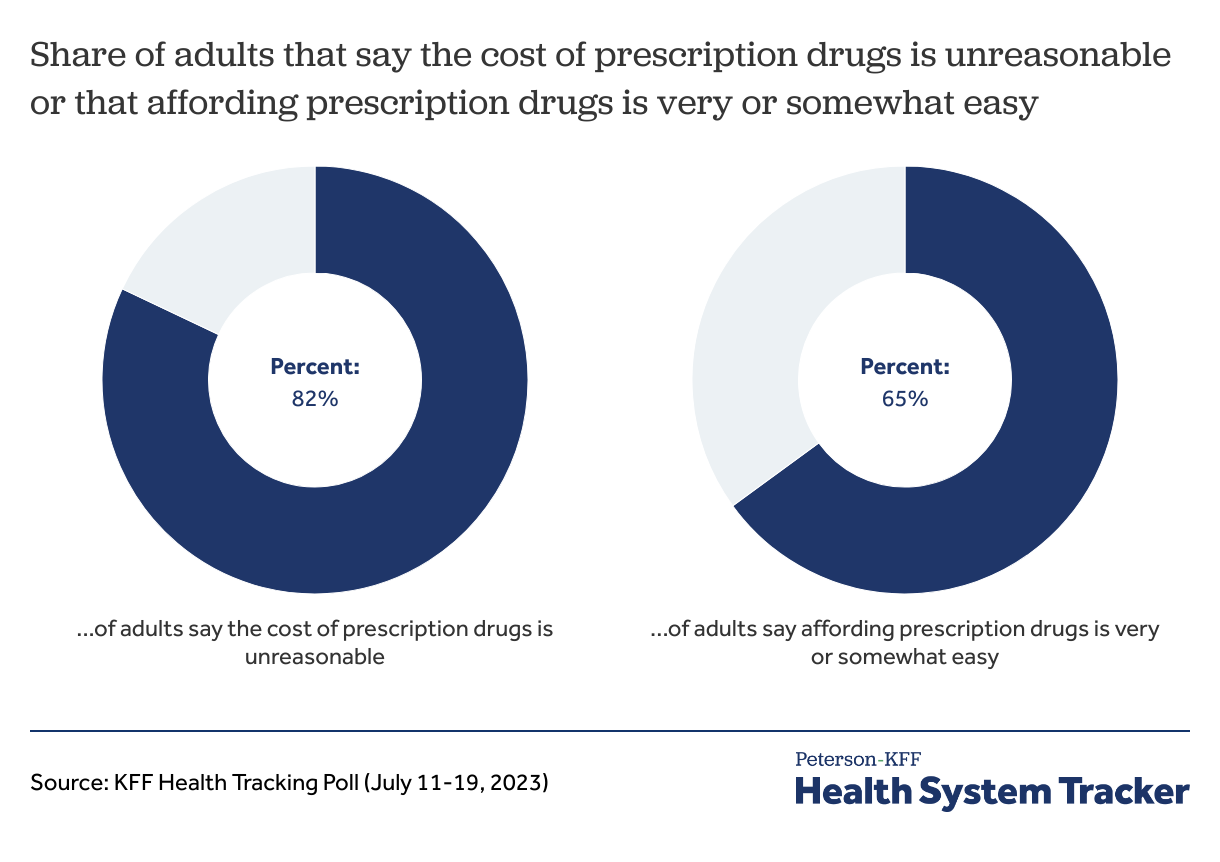
Among U.S adults polled by KFF in 2023, 82% say the cost of prescription drugs is unreasonable, though 65% of adults say affording their prescription medication is “very” or “somewhat” easy. However, adults who are younger, those who earn less, and those who take four or more prescription drugs are more likely to report difficulty in affording their medication.
Related Content:
Growth in price and utilization of pharmaceuticals has varied over time
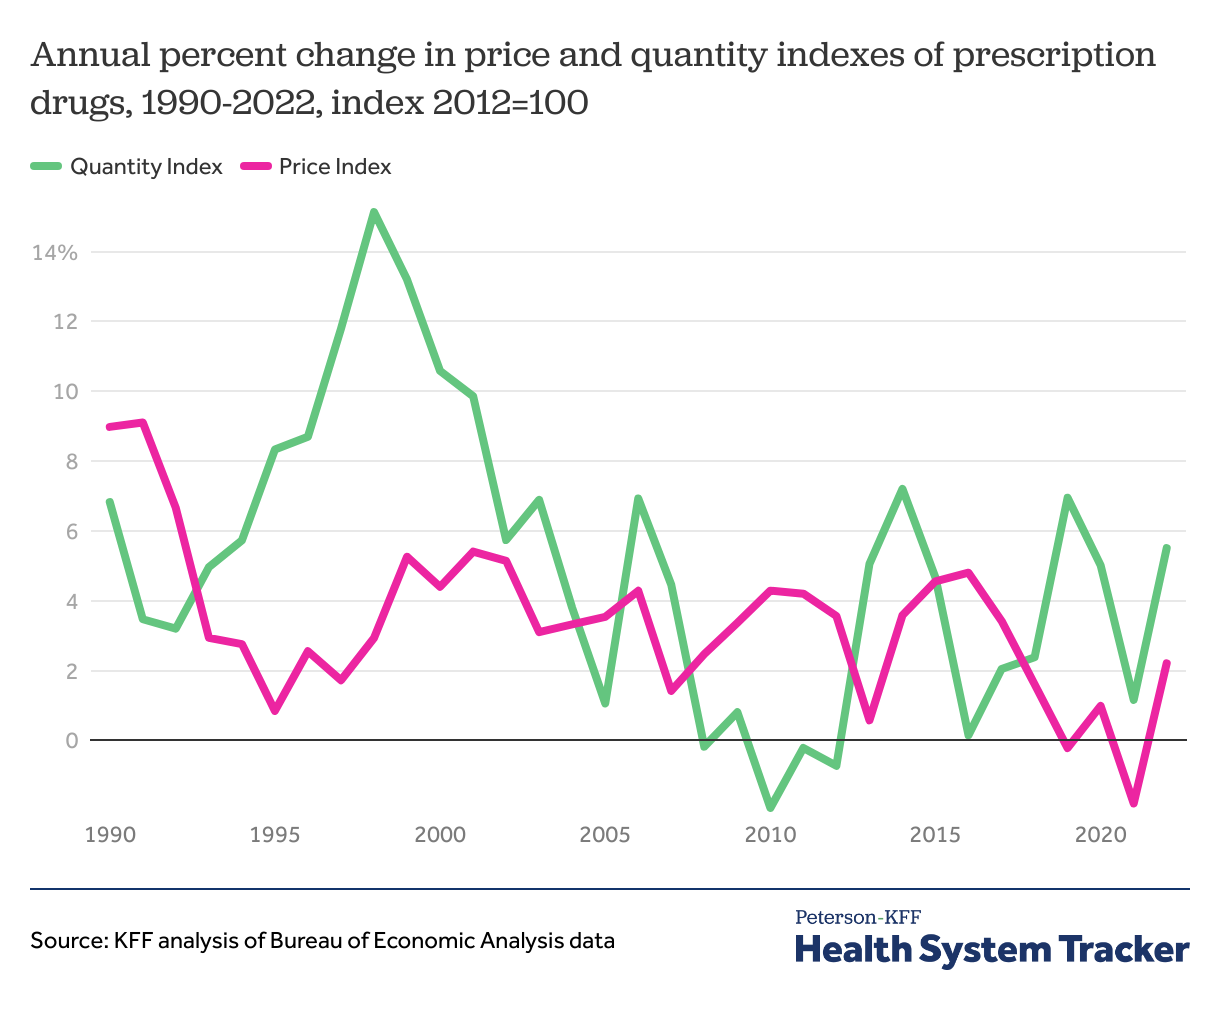
Early in the pandemic, there was a sharp drop in the utilization of health services, such as doctor’s appointments and hospitalizations, but the same was not true for prescription drug utilization.
Due to the way drugs are selected for inclusion in the price index, it can take some time for new drugs to be incorporated into the index. The price index for drugs has held relatively stable since the mid-1990s (ranging in growth from about 1% to 5% annually), while the utilization index has changed more over time.
The average prices of Harvoni, Humira, and Enbrel are higher in the U.S. than in Switzerland and the United Kingdom
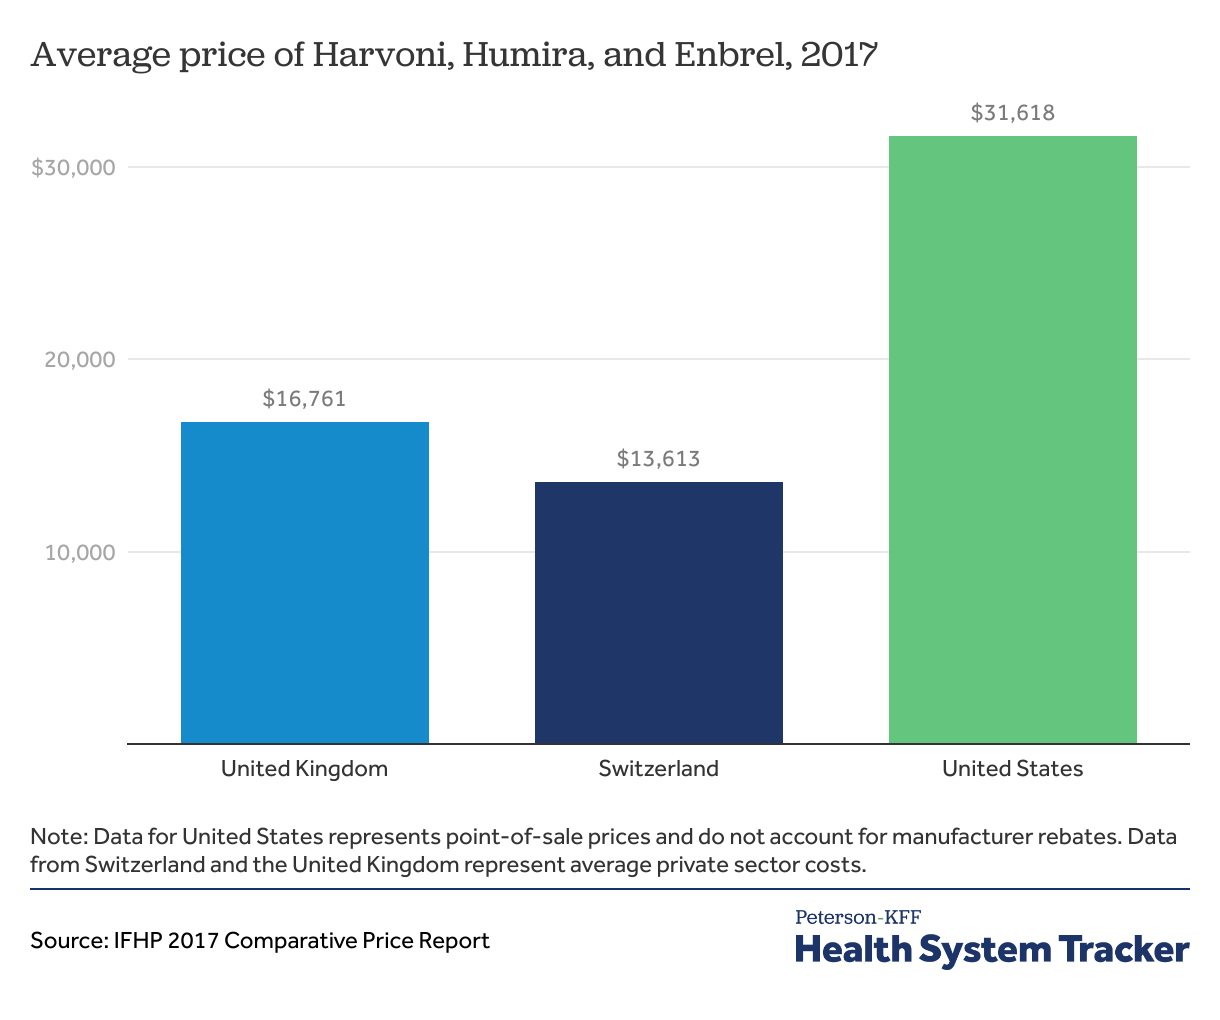
Specialty drugs Harvoni, Humira, and Enbrel have higher list prices in the U.S. (not accounting for manufacturer rebates) than in Switzerland and the United Kingdom. An oral medication, Harvoni, used to treat chronic hepatitis C infection on average is listed at a 132% higher price in the U.S than in Switzerland and 89% more than in the U.K. Humira, prescribed to reduce the symptoms of rheumatoid arthritis, Crohn’s disease, and moderate to severe ulcerative colitis, is priced 265% higher in the United States, on average, than in Switzerland, and 423% higher than in the U.K. On average, Enbrel, a drug prescribed to reduce symptoms of rheumatoid arthritis, is priced at 196% higher than in the U.S than in Switzerland, and 403% higher in the U.K. Drugs used for weight loss are listed (not accounting for rebates) in the U.S. at 2 to 10 times those in peer nations.
Retail prescription drugs account for a significant share of health spending for privately insured
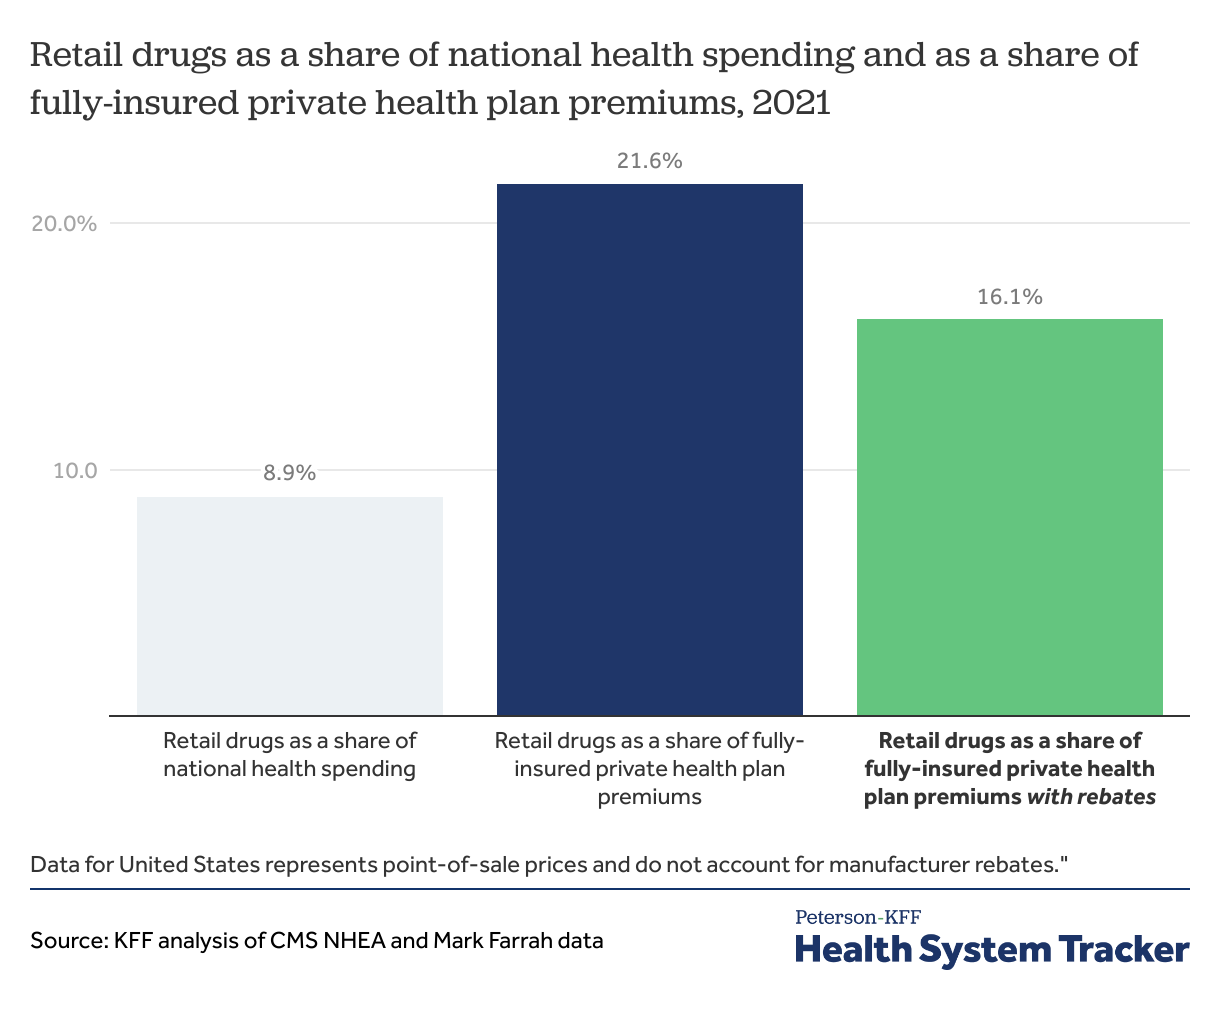
In 2021, retail prescription drugs accounted for 8.9% of U.S. health spending but a larger share of private health plan spending. Retail prescription drugs account for 16.1% of fully-insured private health plan premiums after accounting for rebates.
(Retail drug spend as a share of fully-insured private health plan spending is based on data submitted by insurers to NAIC and supplemented by Mark Farrah with other sources.)
Medicare has become a major payer for retail prescription drugs
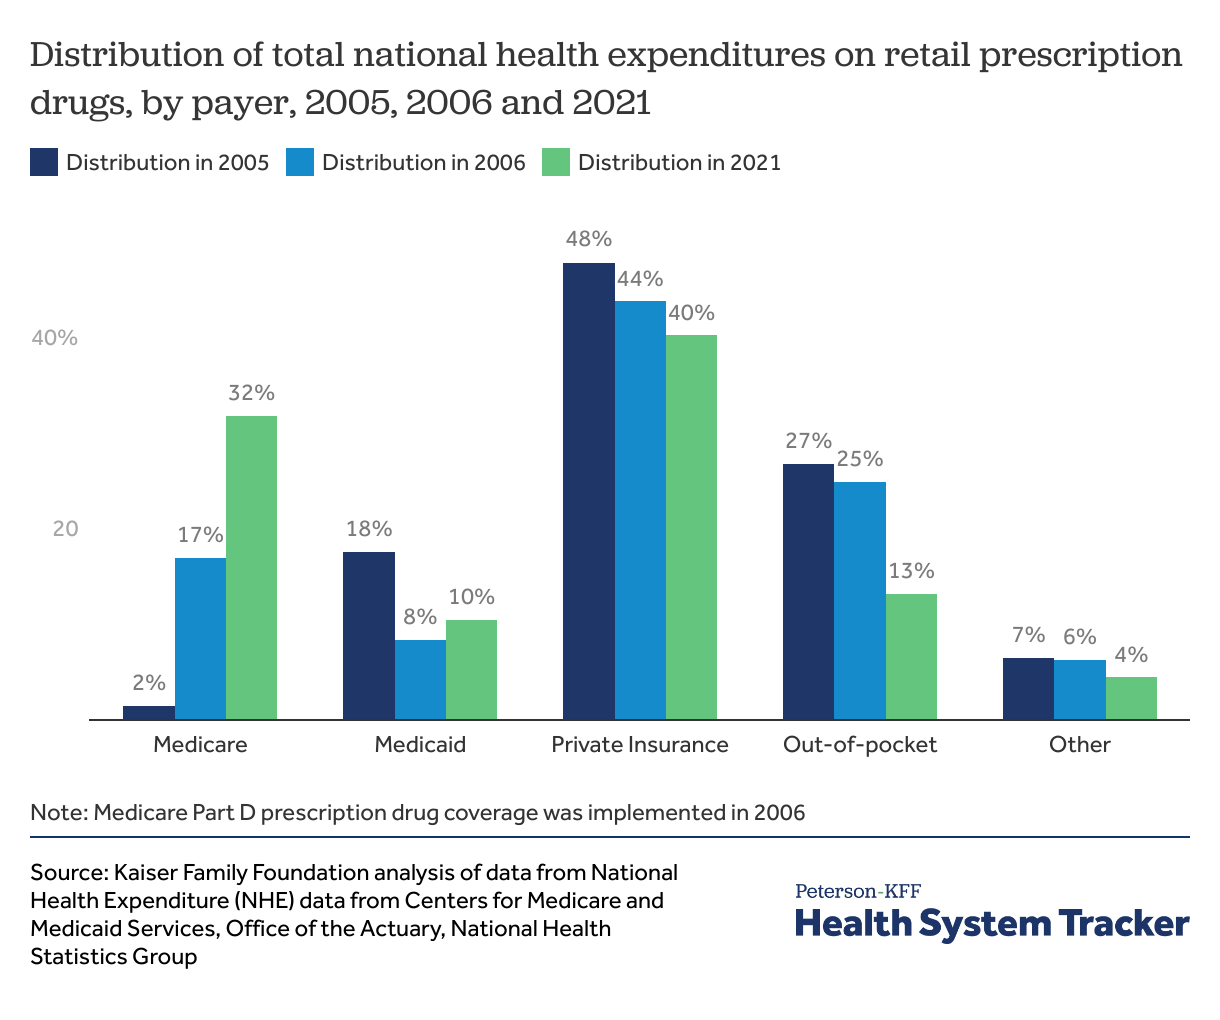
With the launch of Medicare Part D in 2006, and more recently the ACA’s closing of the “donut hole” (a prescription drug coverage gap resulting in Medicare enrollees paying out-of-pocket in addition to their deductible and copayments or coinsurance), Medicare has become a major payer for prescription drugs. From 2005 to 2021, Medicare’s contribution to total national health spending on prescription drugs increased from 2% to 32%, making it the second largest payer for retail drugs after private insurance.
Most Americans favor actions to address high prescription drug prices
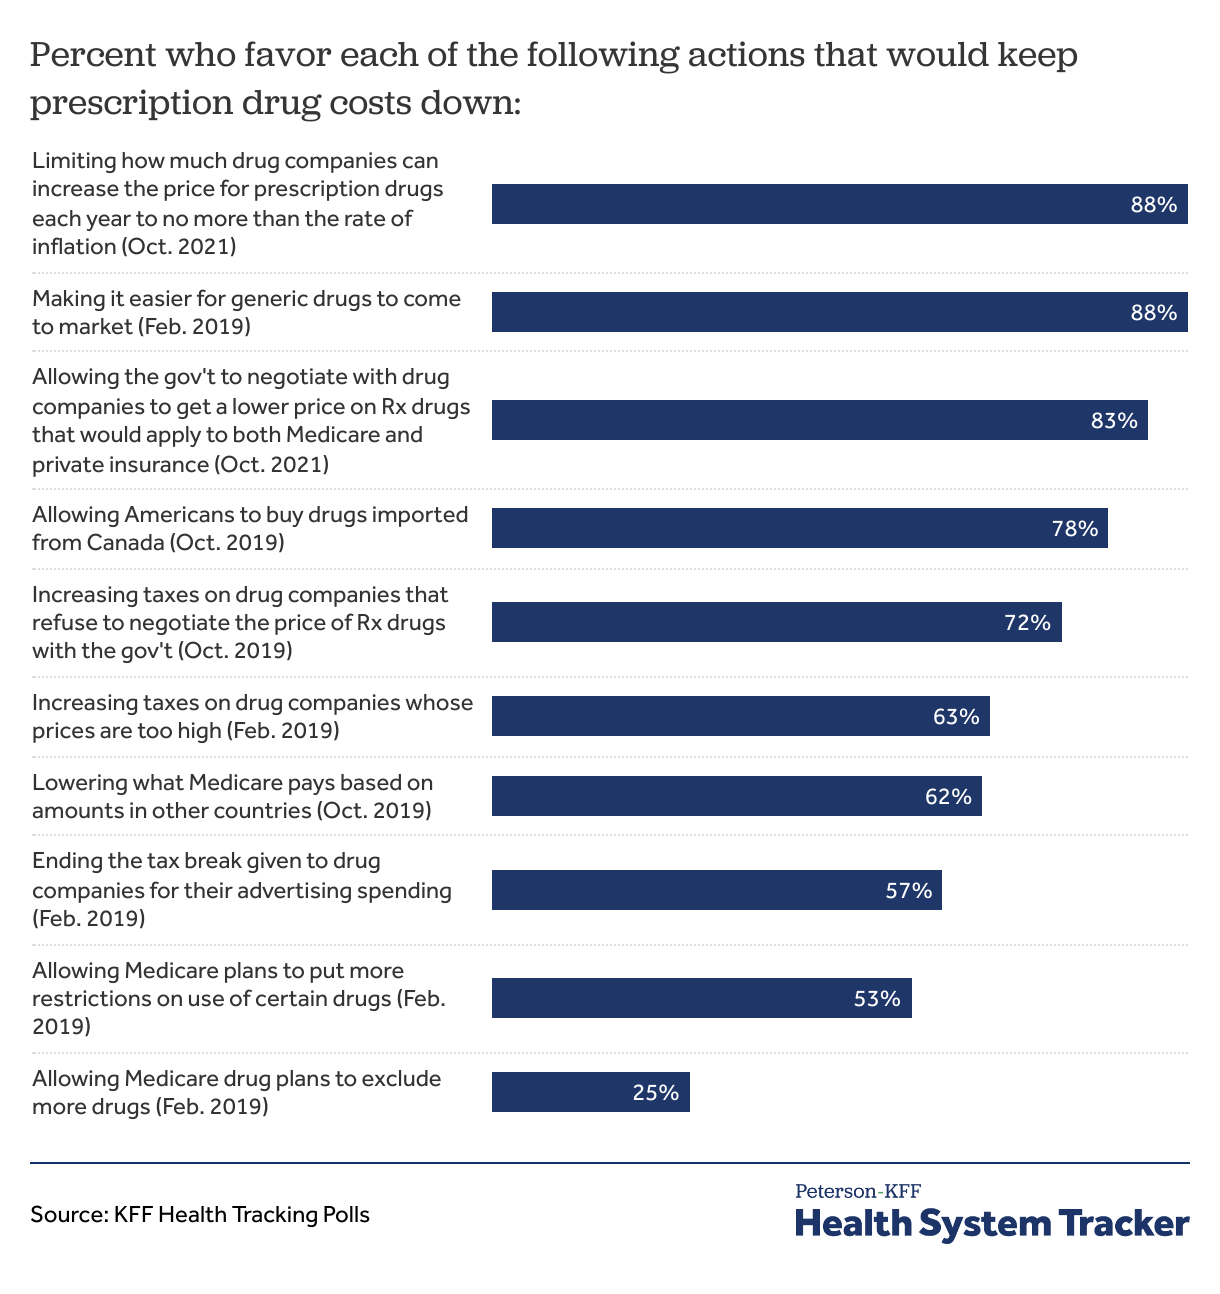
When asked about policy options aimed at keeping prescription drugs cost down, a majority of adults favor most options. In a KFF poll, 88% of Americans favored limiting how much drug companies can increase the price for prescription drugs each year to no more than the rate of inflation. The vast majority also favor allowing the government to negotiate drug prices and to tax drug companies that refuse to negotiate. Most Americans (25%) did not favor allowing Medicare drug plans to exclude more drugs.
The Inflation Reduction Act has led to a shift in projected out-of-pocket prescription drug spending
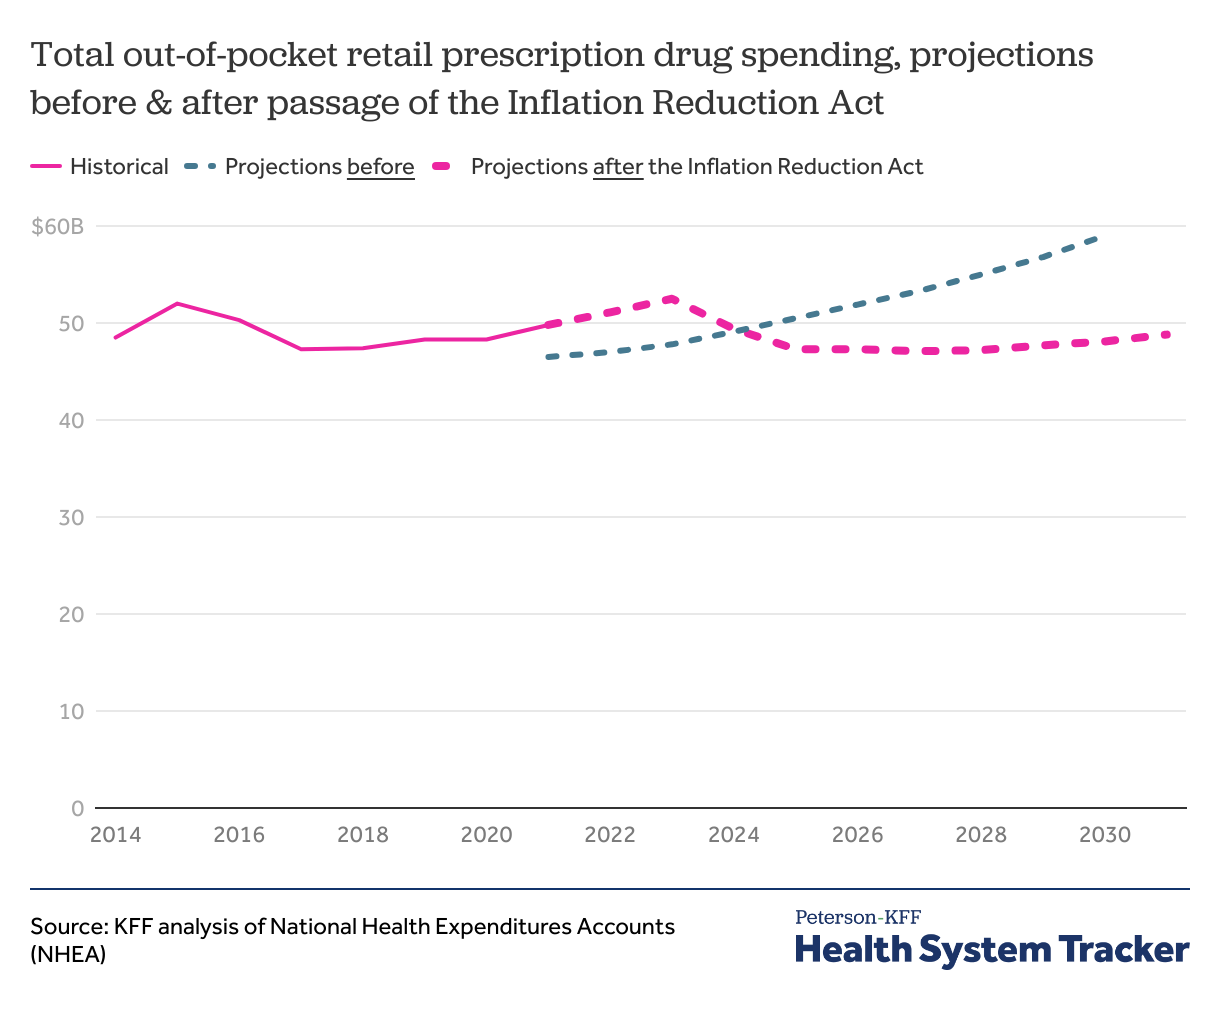
The Inflation Reduction Act, passed in 2022, includes numerous provisions aimed at prescription drug spending for patients with Medicare. These provisions include capping insulin cost-sharing to $35 per month (effective 2023), requiring pharmaceutical manufacturers to pay rebates to Medicare if their prices rise faster than inflation (rebate payments required starting in 2023), capping Medicare Part D out-of-pocket drug spending to $2,000 annually (effective starting in 2025), and requiring the federal government to negotiate prices for certain high-spend drugs covered by Medicare (negotiated prices take effect in 2026).
While Inflation Reduction Act provisions related to drugs are only applicable to Medicare, Medicare covered 32% of national drug spending in 2021.
CMS actuaries expect these provisions to plateau out-of-pocket drug spending in the next decade. CMS expects Medicare retail prescription drug spending to increase initially, partly driven by Medicare drug benefit redesign. CMS actuaries expect a 20 percent reduction in aggregate drug costs from drug price negotiations and inflation rebates. CBO estimates that the drug pricing provisions in the law will reduce the federal deficit by $237 billion over 10 years (2022-2031).
Before the Inflation Reduction Act, CMS projected aggregate out-of-pocket retail prescription drug spending to increase steadily throughout the 2020s. CMS now expects out-of-pocket drug spending to peak in 2023 at $52.5 billion and decline thereafter through 2027 as provisions take effect. By 2030, total out-of-pocket spending on retail prescription drugs is projected to be $48.1 billion, 18.5% lower than the $59.0 billion projected previously. Per capita out-of-pocket retail drug spending is now anticipated to peak in 2023 at $157 and decline to $138 by 2030. Before the Inflation Reduction Act, per capita retail drug spending was projected to reach $169 in 2030.
Related Content:
The Peterson Center on Healthcare and KFF are partnering to monitor how well the U.S. healthcare system is performing in terms of quality and cost.