Prescription drug costs are a pressing concern for both consumers and policymakers. Rising drug prices affect patients’ out-of-pocket costs as well as the budgets of private and public payers, though the challenges vary by payer. This analysis compares prescription drug spending and use in large private employer plans, Medicare Part D, and Medicaid, based primarily on claims data by payer, which does not account for rebates. Rebates differ by payer, and are estimated to be larger for Medicaid than Medicare Part D or private employers.
Spending by private health insurers, Medicare, and Medicaid accounts for a majority of prescription drug spending in the U.S., but the types of individuals who receive prescription drug coverage from these three payers varies:
- Medicare covers adults ages 65 and older and younger people with long-term disabilities. Medicare’s prescription drug benefit is provided through the Part D program to Medicare beneficiaries who enroll in private stand-alone drug plans or Medicare Advantage drug plans.
- Medicaid is the nation’s health insurance program for people with low income and provides a wide array of medical and long-term care benefits to a diverse population of low-income children and adults, individuals with disabilities, and people ages 65 and older. People 65 and older and those with disabilities who also have Medicare coverage receive coverage of retail prescription drugs through Medicare Part D.
- Employers cover a population that is healthier than either Medicare or Medicaid, and almost all covered workers have coverage for prescription drugs.
This variation in the types of individuals covered by each payer is reflected in some of the patterns of prescription drug spending and use presented below.
Highlights from this analysis include:
- Private health insurance, Medicare, and Medicaid accounted for 82% of total retail prescription drug spending in the U.S. in 2017, while patients paid 14% of the total as out-of-pocket payments.
- For spending on specific drug products, the top five drug products with the highest total spending alone account for at least 10% of total prescription drug spending in large employer plans, Medicare Part D, and Medicaid.
- While some of the same drug products appear among the top 10 drug products with the highest total spending in large employer plans, Medicare Part D, and Medicaid, there is also variation that reflects differing covered populations.
- Out-of-pocket drug spending per user among people in large employer plans and Medicare Part D is highest for drugs to treat cancer, multiple sclerosis and rheumatoid arthritis.
- Antidiabetic agents, antivirals and psychotherapeutics are among the top therapeutic classes by total spending in large employer plans, Medicare Part D, and Medicaid.
Related Content:
Spending by private health insurance, Medicare, and Medicaid accounts for more than 80% of total retail prescription drug spending in the U.S.
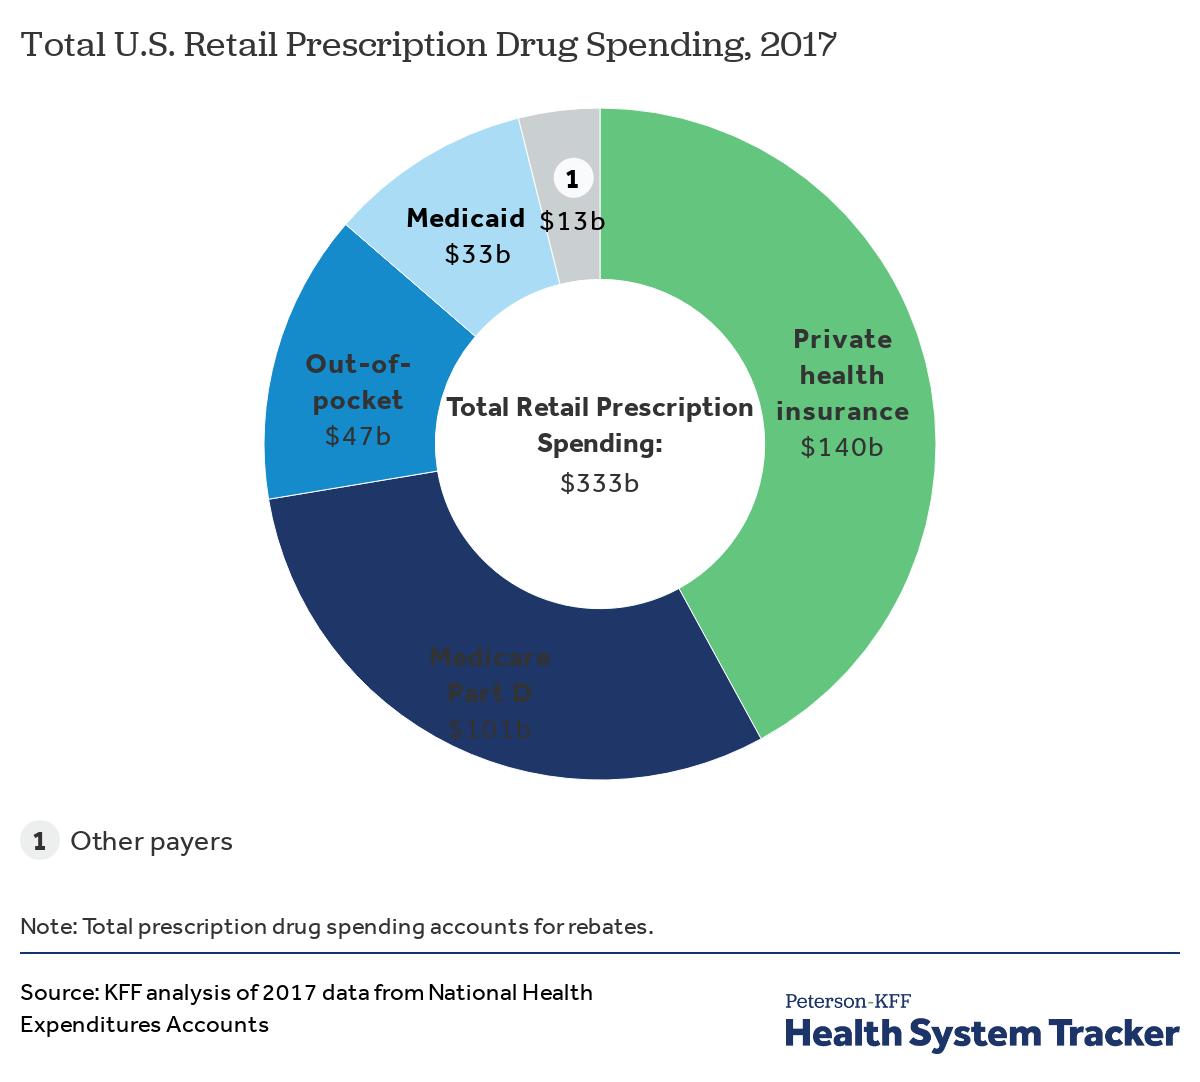
In 2017, total U.S. retail prescription drug spending was $333 billion, after accounting for rebates, with the majority (82%) of spending incurred by the three major sources of payment in the U.S. health system: private health insurance, Medicare, and Medicaid. Among all payers, private health insurance accounted for the largest share of drug spending, at 42%, followed by Medicare at 30%, and Medicaid at 10%. Patient out-of-pocket costs represented 14% of total retail drug spending.
Spending on retail prescription drugs accounts for a larger share of total personal health care spending for private health insurance and Medicare than Medicaid
In 2017, retail prescription drug spending accounted for 13% of total personal health care spending in private health insurance plans and 15% of personal health care spending in Medicare. Drug spending as a share of personal health care spending in Medicaid was lower (6%) because Medicaid also pays for more expensive services, including long-term services and supports that are not paid for by private insurance or Medicare.
Across payers, a small number of drug products account for a disproportionate amount of total drug spending
For large employer plans, Medicare Part D, and Medicaid, the top five drug products with the highest total spending alone account for at least 10% of total prescription drug spending by each payer (13%, 10%, and 10%, respectively), while the top 50 drug products account for roughly 40% of total prescription drug spending (39%, 43%, and 41%, respectively). These estimates do not account for rebates.
The top 50 drug products by spending account for a large share of total drug spending but a relatively small share of total prescriptions in large employer plans, Medicare Part D, and Medicaid
While the top 50 drug products account for roughly 40% of total prescription drug spending for large employers, Medicare Part D, and Medicaid, the share of total prescriptions accounted for by the top 50 drug products is much smaller: only 8% for both large employer plans and Medicaid, and 15% for Medicare Part D.
In 2016, total drug spending in Medicare Part D and Medicaid was highest for Harvoni (for hepatitis C); in large employer plans, total drug spending was highest for Humira (for rheumatoid arthritis)
In 2016, the drug product with the highest total spending in Medicare Part D and Medicaid was Harvoni, a curative treatment for hepatitis C that was approved by the FDA in October 2014; total spending on Harvoni was $4.4 billion in Medicare Part D and $2.2 billion in Medicaid (not accounting for rebates payers may have received). The number one drug product for large employers in 2016 was Humira, a treatment for rheumatoid arthritis, with $4.9 billion in total spending (also not accounting for rebates).
Related Content:
While some of the same drug products appear among the top 10 drug products with the highest total spending in large employer plans, Medicare Part D, and Medicaid, there is also variation that reflects differing covered populations
Among the top 10 drug products with the highest total spending in large employer plans, Medicare Part D, and Medicaid, there are two products in common: Harvoni, a treatment for hepatitis C, and Lantus Solostar, an insulin therapy for diabetes. There is additional overlap in the top 10 lists for large employer plans and Medicaid, including treatments for attention-deficit/hyperactivity disorder (ADHD) and HIV. Despite the overlap, the ranking of these drug products generally differs across payers, and there is also variation in which products have the largest total spending for each payer, which reflects the different types of populations covered. In particular, for Medicare Part D, the top 10 list includes treatments for cancer, chronic obstructive pulmonary disease, and high cholesterol which are more commonly used by older adults. For Medicaid, the top 10 list includes several psychotherapeutic medications, reflecting the important role that Medicaid plays in meeting the needs of people with mental illness.
Antibiotics and asthma/allergy drugs are among the most commonly used drugs in large employer plans, while drugs for high blood pressure and high cholesterol are more commonly used in Medicare Part D
Atorvastatin calcium (generic for Lipitor), a treatment for high cholesterol, was used by 9.3 million people in Medicare Part D plans, more users than any other drug product used by Part D enrollees in 2016. The antibiotic amoxicillin was used by 8.5 million people in large employer plans in 2016, more than any other drug product used by people in large employer plans in 2016. Because the most commonly used drug products are generics, average total and out-of-pocket spending per user is relatively low for these drugs.
Hepatitis C and cancer treatments have the highest average total spending per user in large employer plans and Medicare Part D
Two hepatitis C treatments, Sovaldi and Harvoni, are among the top 10 drug products by total spending per user in large employer plans and Medicare Part D, with total spending per user on both products of more than $70,000 in 2016. Cancer drugs are also among the drug products with the highest total spending per user for large employer plans and Medicare Part D, including Revlimid, Ibrance, and Gleevec, with annual costs of at least $60,000 per user.
Out-of-pocket drug spending per user among people in large employer plans and Medicare Part D is highest for medications to treat cancer, multiple sclerosis, and rheumatoid arthritis
Although there is little overlap in the specific list of top 10 drug products used by people in large employer plans and Medicare Part D in terms of annual average out-of-pocket spending per user, the types of drugs with the highest out-of-pocket costs are similar, and include drug products to treat cancer, multiple sclerosis, and rheumatoid arthritis. In 2016, people in large employer plans paid more out of pocket for Xyrem, a treatment for narcolepsy, than for other drug products—$1,568 on average. In 2016, the hepatitis C treatment Harvoni was the most expensive drug product for Part D enrollees, with $5,235 in average annual out-of-pocket costs per user among those who did not receive low-income subsidies.
Antidiabetic agents, antivirals, and psychotherapeutics are among the top therapeutic classes by total spending in large employer plans, Medicare Part D, and Medicaid
In terms of total spending on prescription drugs by therapeutic class, antidiabetic agents and antivirals are among the top 3 classes for large employer plans, Medicare Part D, and Medicaid. Total spending on antidiabetic agents, the number one class for Medicare Part D, was $20.0 billion for Part D, $9.0 billion for large employers, and $5.7 billion for Medicaid (not accounting for rebates on drug products in these classes). Total spending on antivirals, the number one class for Medicaid, was $9.2 billion for Medicaid, $11.8 billion for Medicare Part D, and $6.3 billion for large employer plans. But as with total spending by drug product, the rankings of top drug classes by spending show variation across payers that reflects variation in covered populations; for example, psychotherapeutics rank higher for Medicaid and Medicare Part D than large employers, while molecular targeted therapy (cancer treatments) rank higher for Medicare Part D than large employers.
Cardiac drugs, psychotherapeutics, and pain medications are among the top therapeutic classes by volume in large employer plans, Medicare Part D, and Medicaid
In terms of number of prescriptions filled, the most commonly used types of drugs in large employer plans, Medicare Part D, and Medicaid include cardiac drugs and psychotherapeutic agents. The number of prescriptions for cardiac drugs—the top drug class by volume in large employer plans and Medicare Part D—was 69.9 million in large employer plans, 246.6 million in Medicare Part D, and 52.8 million in Medicaid. The number of prescriptions for psychotherapeutic agents—the number two drug class by volume in Medicaid and Medicare Part D and number three in large employer plans—was 56.2 million in large employer plans, 118.4 million in Medicare Part D, and 68.3 million in Medicaid.
Annual average out-of-pocket spending is higher among people in Medicare Part D plans than those in large employer plans, but spending by both groups was lower in 2016 than in 2007
People in Medicare Part D plans spend more out of pocket on prescription drugs than people in large employer plans, on average. In 2016, people in Medicare Part D spent $365 out of pocket on drugs, more than 2.5 times the average out-of-pocket drug spending by people in large employer plans that year ($132). Between 2007 and 2016, average out-of-pocket drug spending by people in large employer plans decreased somewhat. Part D enrollees also spent less out of pocket in 2016 than in 2007, on average, but their out-of-pocket costs have been relatively flat since 2012, after decreasing between 2010 and 2012 due to a provision in the Affordable Care Act to phase out the coverage gap in the Part D benefit.
A larger share of people with Medicare Part D have high annual out-of-pocket drug costs compared to people with employer coverage
In 2016, nearly 1 in 10 people in Medicare Part D plans (9%) had out-of-pocket drug spending above $1,000, compared to 3% of people in large employer plans. Conversely, more than 8 in 10 people in large employer plans (84%) had out-of-pocket drug costs below $200, compared to 60% of people in Medicare Part D plans.
Data and Methods
Total Retail Prescription Drug Spending
Our analysis of total retail prescription drug spending by payer and as a share of personal health care spending in 2017 is based on analysis of data from the National Health Expenditure Accounts (NHEA). Personal health care includes all medical goods and services that are rendered to treat or prevent a specific disease or condition in a specific person. Prescription drug expenditures in the NHEA include the retail sales of human-use dosage-form drugs, biological drugs, and diagnostic products that are available only by a prescription. Drug spending in the NHEA is adjusted to account for manufacturers’ rebates that reduce payers’ net payments for prescription drugs.
Large Employer Plans
We analyzed a sample of medical claims obtained from the Truven Health Analytics MarketScan Commercial Claims and Encounters Database, which contains claims information provided by large employer plans. We used a subset of claims from the 2016 data. We only included claims for people under the age of 65 and people who were enrolled in a plan for more than half a year. Weights were applied to match counts in the Current Population Survey for enrollees at firms of a thousand or more by sex, age, state and whether the enrollee was a policy holder or dependent. This analysis used claims for almost 17 million people representing about 20% of the 86 million people in the large group market in 2016.
The MarketScan claims database contains information about health benefit claims and encounters for several million individuals each year provided by large employers. The advantage of using claims information to analyze out-of-pocket spending is that we can look beyond plan provisions and focus on actual payment liabilities incurred by enrollees. A limitation of these data is that they reflect cost sharing incurred under the benefit plan and do not include balance-billing payments that beneficiaries may make to health care providers for out-of-network services or out-of-pocket payments for non-covered services. Drug spending paid for by someone other than an enrollee’s insurer, drugs administered in an inpatient setting or not classified under the controlled substance act were excluded.
Related Content:

Each prescription drug claim was counted as a single prescription regardless of the quantity or strength of that prescription. Drugs with the same product name but separate entries in the MarketScan claims database corresponding to products with different delivery mechanisms and/or dosage forms are reported separately. Total spending does not include any rebates that may reduce the cost of the drug. MarketScan’s Red Book was used to classify drugs by the therapeutic/pharmacologic category of the drug product. Analysis of average total and out-of-pocket spending per user by drug (Figures 8 and 9) excludes drugs used by fewer than 500 (unweighted) enrollees.
Medicare Part D
We used data from the 2016 Medicare Part D prescription drug event (PDE) claims data from the Centers for Medicare & Medicaid Services (CMS) Chronic Conditions Data Warehouse (CCW) for a five percent sample of Medicare beneficiaries. Our five percent sample for 2016 includes 2,149,486 Part D enrollees (42,989,720 weighted) and 1.5 billion prescription drug events. The PDE claims data includes all prescription drug events reported by Part D plans for their enrollees in a given calendar year, and includes detailed data on spending for each event, corresponding to a single prescription drug fill, including how much was paid by plans, low-income subsidy amounts, and beneficiary out-of-pocket payments. The claims data includes spending for Part D covered drugs, but doesn’t include spending on Part D plan premiums, Part B covered drugs (which are typically administered in providers’ offices or hospital outpatient settings), or the cost of drugs purchased outside the Part D plan.
We calculated aggregate and per user average total and out-of-pocket drug spending for Part D enrollees overall, including beneficiaries with and without Part D low-income subsidies, and beneficiaries enrolled in both stand-alone prescription drug plans (PDPs) and Medicare Advantage prescription drug plans. Total spending reflects payments from all payers, including beneficiaries (out-of-pocket cost sharing amounts), but does not include rebates and discounts from pharmacies and manufacturers that are not reflected in prices at the pharmacies. Out-of-pocket costs are those paid directly by beneficiaries, not including amounts that other parties might pay on their behalf and not including the value of the manufacturer discount on brand-name drugs in the coverage gap. Drugs with the same product name but separate entries in the Part D claims data corresponding to products with different delivery mechanisms and/or dosage forms are reported separately. MarketScan’s Red Book was used to classify drugs by the therapeutic/pharmacologic category of the drug product. Analysis of average total and out-of-pocket spending per user by drug (Figures 8 and 9) excludes drugs used by fewer than 500 (unweighted) enrollees.
Medicaid
We used the CMS State Drug Utilization data, provided by states to CMS. These data reflect prescriptions provided through the Medicaid Drug Rebate Program. The data presents Medicaid spending, total spending, and units for each National Drug Code (NDC) in each quarter, for managed care or fee-for-service, at the state or national level. The spending data do not include any rebates, and do not include drugs purchased through 340B. Drugs with the same product name but separate entries in the Medicaid claims data corresponding to products with different delivery mechanisms and/or dosage forms are reported separately. MarketScan’s Red Book was used to classify drugs by the therapeutic/pharmacologic category of the drug product. We are unable to report average total spending per user for Medicaid prescription drug spending because the data do not include per user counts for each drug.
Selected Definitions for Red Book Drug Classes
- ‘Adrenals and comb’ includes medications for asthma and chronic obstructive pulmonary disease (COPD).
- ‘Biological response modifiers’ are immunotherapies used to treat certain types of cancer, multiple sclerosis, and other diseases.
- ‘Molecular targeted therapy’ drugs are cancer treatments that target specific molecules involved in the growth and spread of cancer cells.
- ‘Sympathomimetic agents’ are stimulant compounds used to treat asthma, allergies, and cough and cold symptoms.
The Peterson Center on Healthcare and KFF are partnering to monitor how well the U.S. healthcare system is performing in terms of quality and cost.