This chart collection examines how U.S. health spending compares to health spending in other OECD countries that are similarly large and wealthy, based on GDP and GDP per capita. This analysis uses data from the OECD Health Statistics database.
Relative to the size of its economy, the U.S. spends a greater amount on health care than other high-income nations
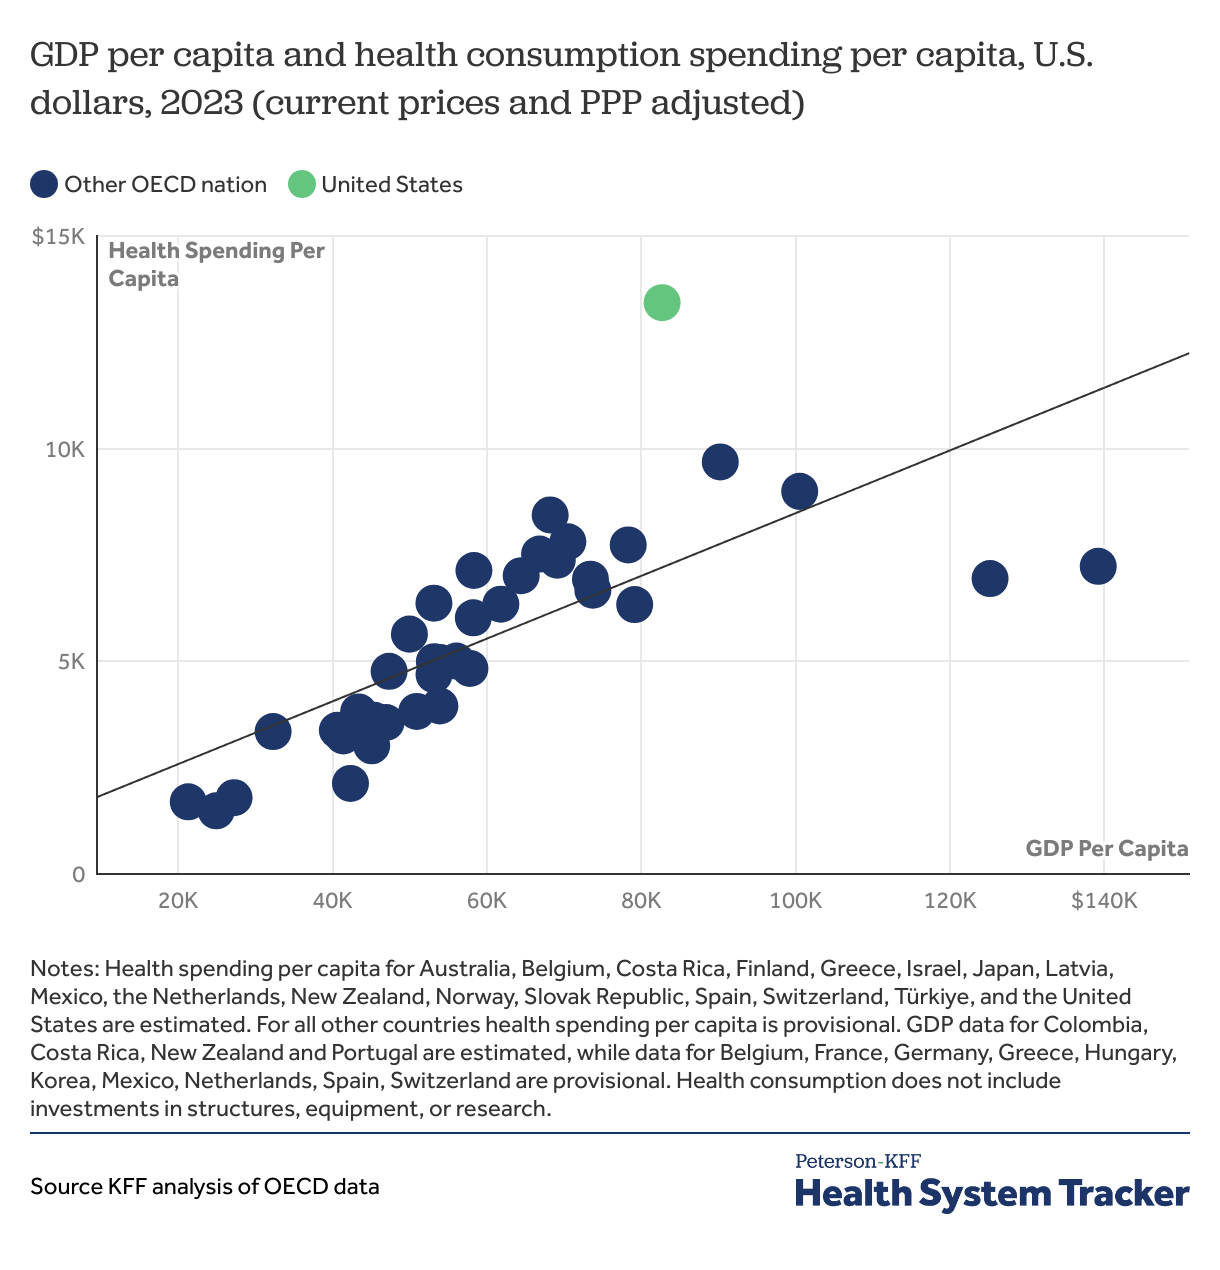
Wealthy countries, including the U.S., tend to spend more per person on healthcare than lower-income countries. However, even among higher-income countries, the U.S. spends far more per person on health.
Comparing health spending in the U.S. to other countries is complicated, as each country has unique political, economic, and social attributes that contribute to its spending. Because health spending is closely associated with a country’s wealth, the remaining charts compare the U.S. to similarly large and wealthy OECD countries.
On average, other large, wealthy countries spend about half as much per person on health as the U.S.
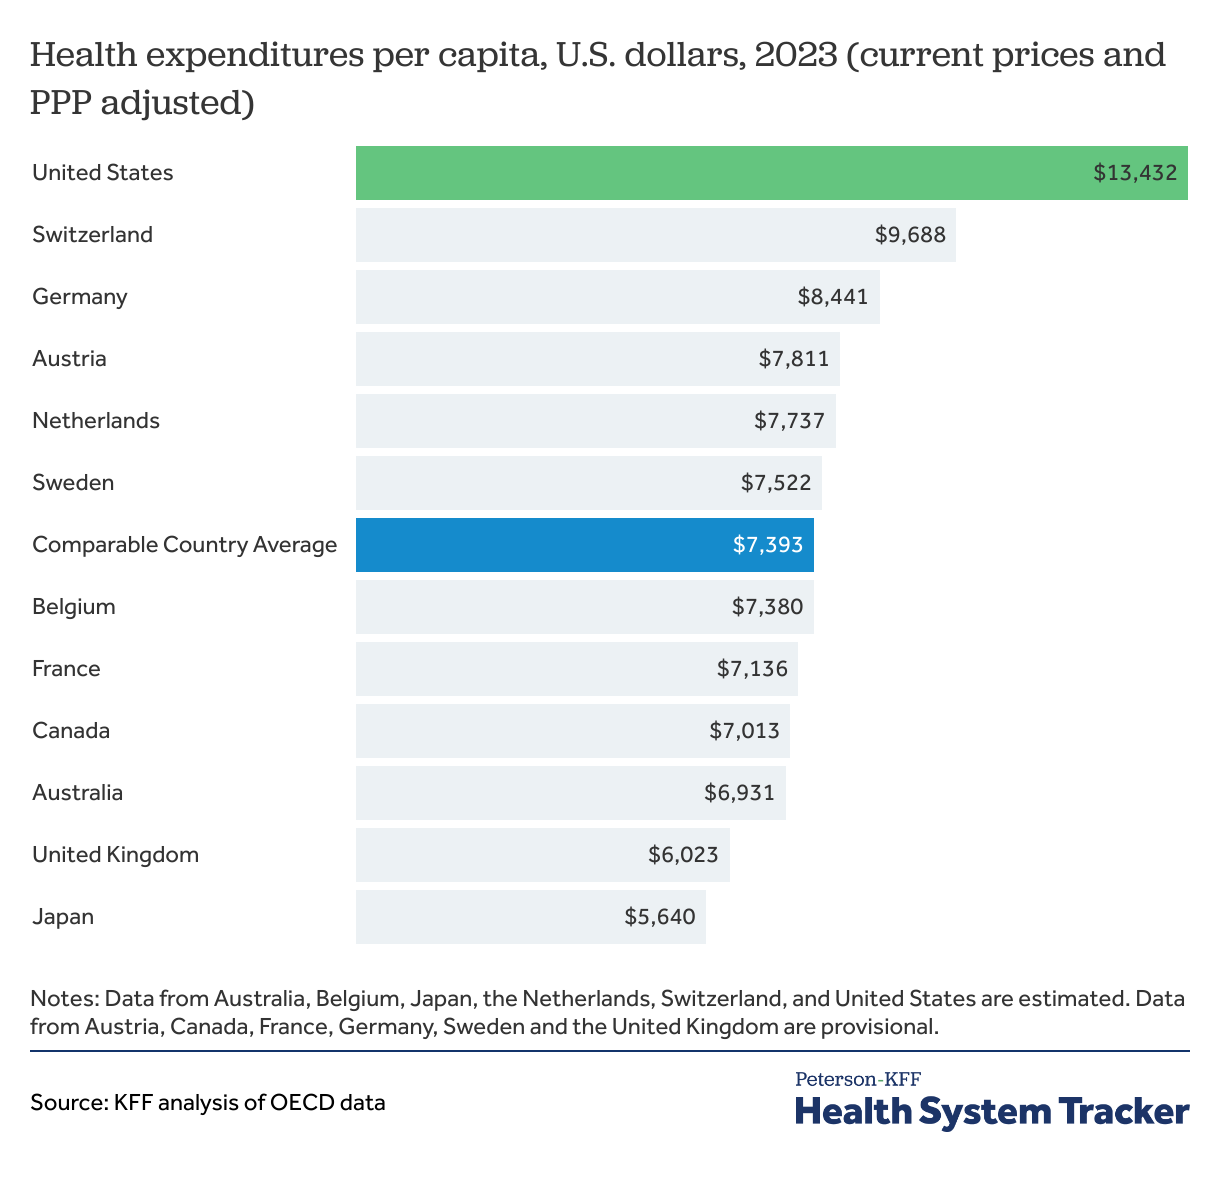
Health expenditures per person in the U.S. were $13,432 in 2023, which was over $3,700 more than any other high-income nation. The average amount spent on health per person in comparable countries ($7,393) is about half of what the U.S. spends per person.
Per capita health spending increased in almost every peer nation in 2023
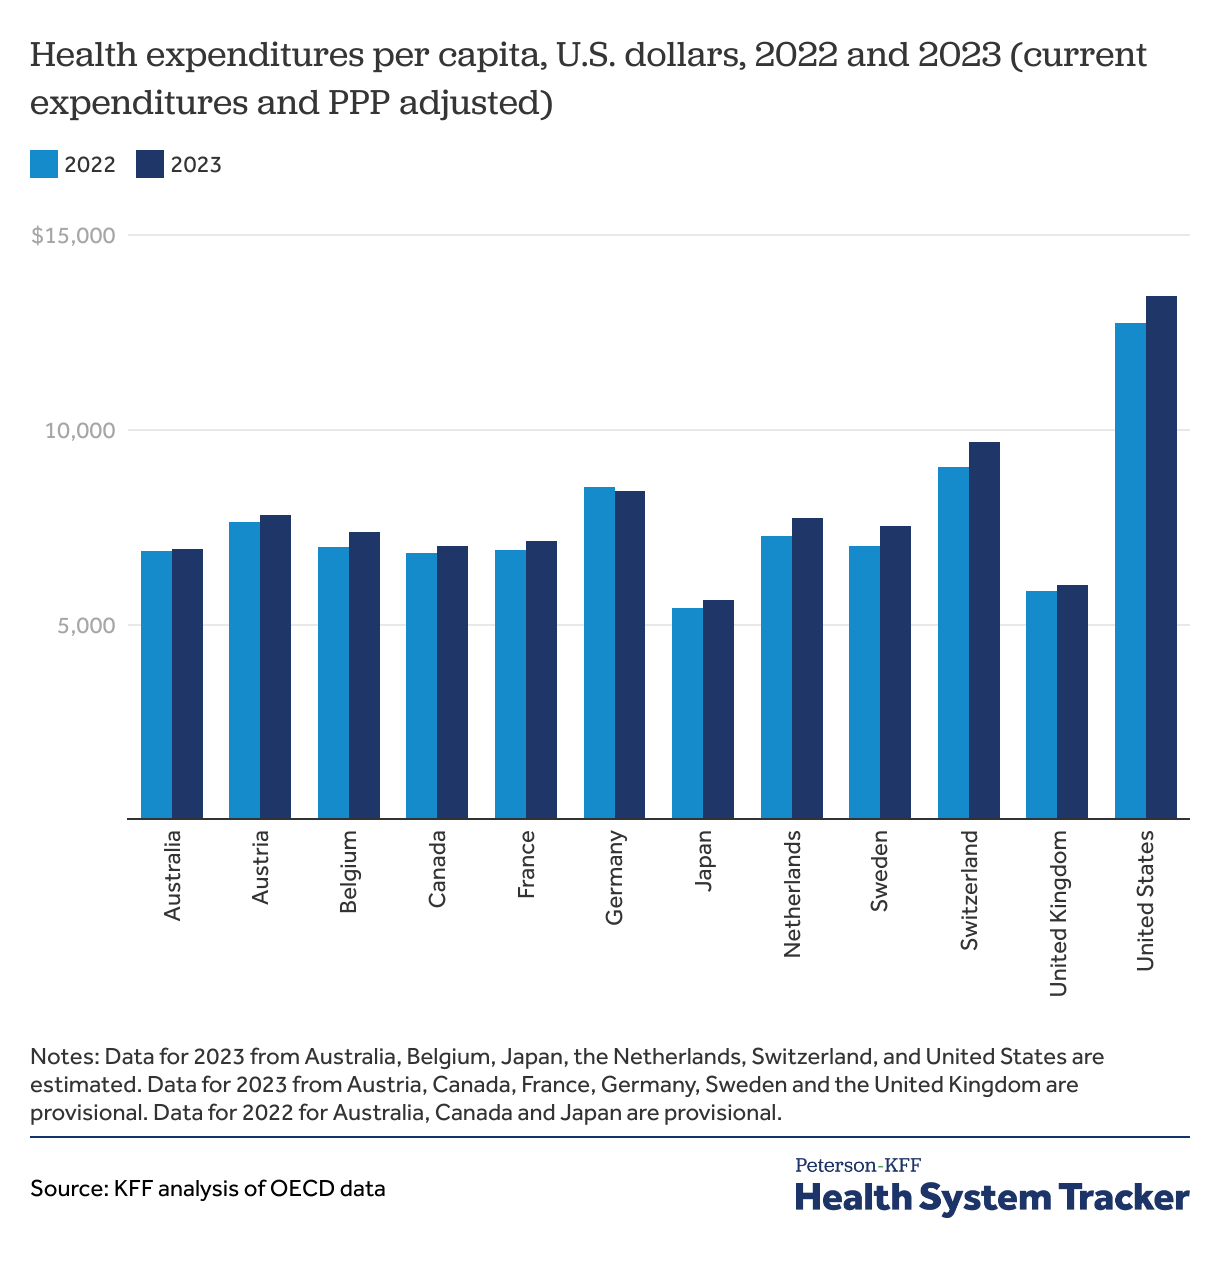
In almost all peer nations, health spending per capita increased between 2022 and 2023, with the exception of Germany, where spending declined by 1.2%. In the U.S., per capita health spending saw a 5.4% increase, a larger increase than in most comparable nations, though smaller than Sweden (7.3%), Switzerland (7.1%), and the Netherlands (6.3%).
This 5.4% increase in per capita health spending in the U.S. is higher than the previous year-over-year increases between 2021 and 2022 (2.9%) and between 2020 and 2021 (3.7%).
Related Content:
Health spending as a share of GDP in the U.S. remained steady in 2023 as growth in the economy roughly equaled health spending growth
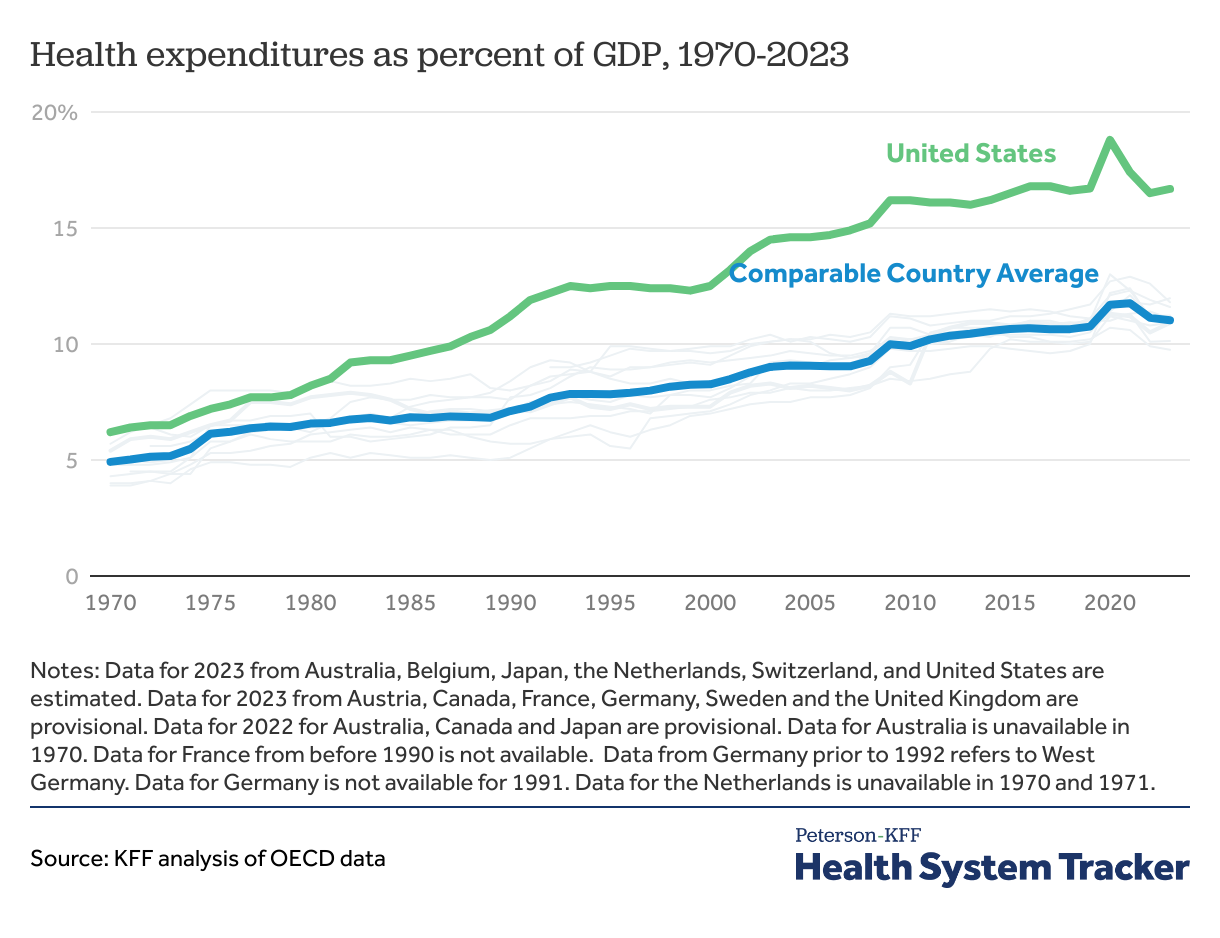
Over the past five decades, the difference between health spending as a share of the economy in the U.S. and comparable OECD countries has widened. In 1970, the U.S. spent about 6.2% of its GDP on health, similar to spending in several comparable countries (the average of comparably wealthy countries was about 4.9% of GDP in 1970). The U.S. was relatively on pace with other countries until the 1980s, when health spending in the U.S. grew at a significantly faster rate relative to its GDP. Since then, health spending as a share of the economy has grown faster in the U.S. than in peer nations.
In 2020, the U.S. spent 18.6% of its GDP on health-related expenditures (up from 16.6% in 2019). However, health spending as a share of GDP in the U.S. declined to 16.5% in 2022 and 16.7% in 2023—but remains substantially higher than in peer countries.
Health spending growth among peer countries has outpaced the U.S. post-pandemic
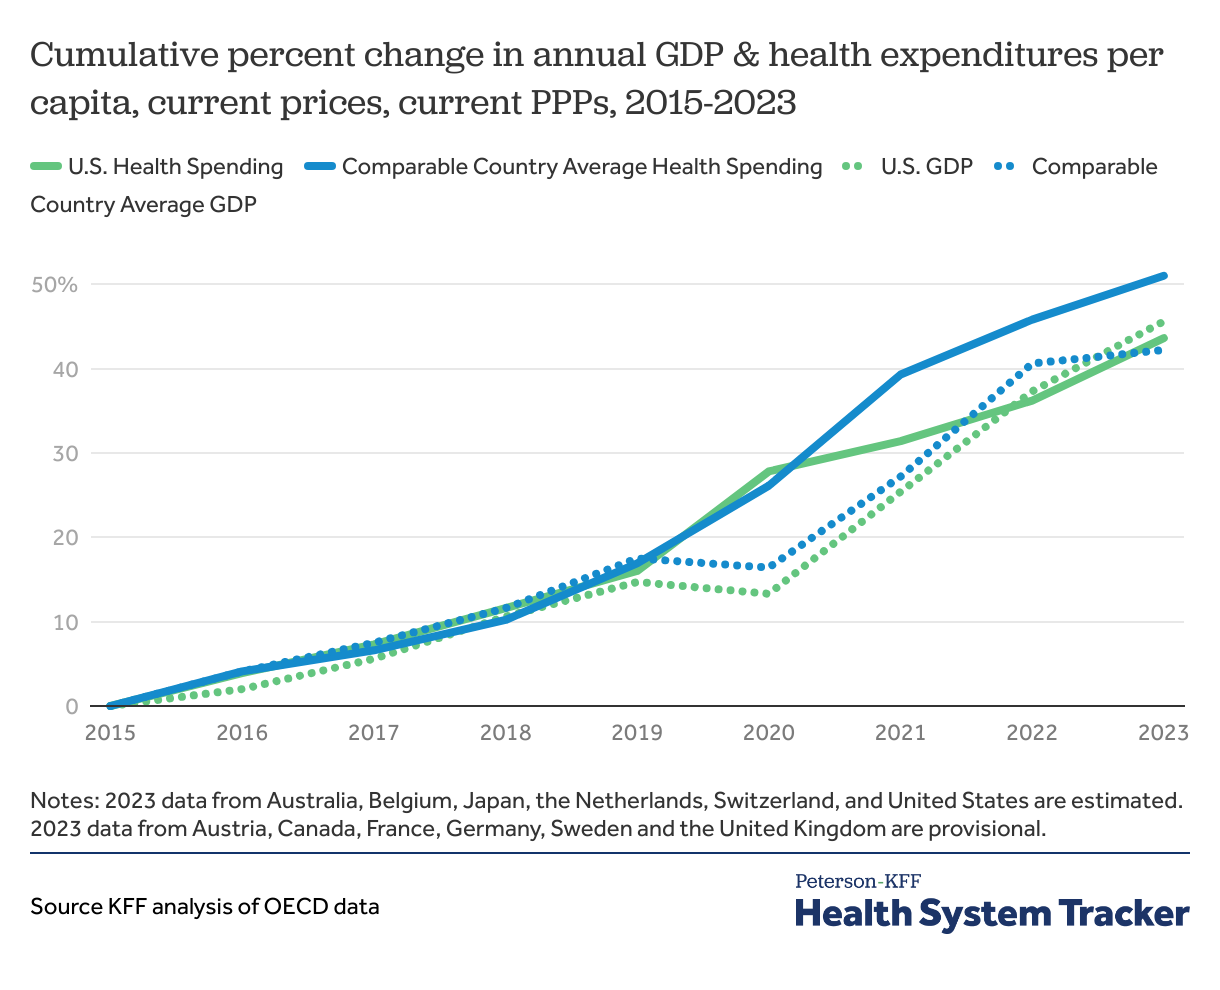
When the COVID-19 pandemic began in 2020, the U.S. and other peer countries increased health spending at a rate larger than in previous years. Additionally, GDP shrank among the U.S. and peer countries between 2019 and 2020 as the economy slowed down amidst lockdowns. By 2021, GDP had recovered and resumed an upward trajectory across the U.S. and other peer nations.
After a jump in 2020, U.S. health spending returned to a more typical rate of growth in 2021. By contrast, average health spending in peer countries increased significantly once again between 2020 and 2021, before resuming a slower growth curve in 2022. This suggests that pandemic-era health spending growth was concentrated in 2020 in the U.S. but spread out between 2020 and 2021 in most comparable countries, causing health spending as a share of GDP to spike for U.S. but increase and decrease more gradually for peer countries during the pandemic. In more recent years, GDP growth has outpaced health spending growth in peer countries leading toward a decrease in health spending as a share of GDP. Conversely, in the U.S., health spending growth continues to slightly outpace GDP.
At times the U.S. has seen faster health spending growth, but more recently, spending growth has been higher in comparable countries
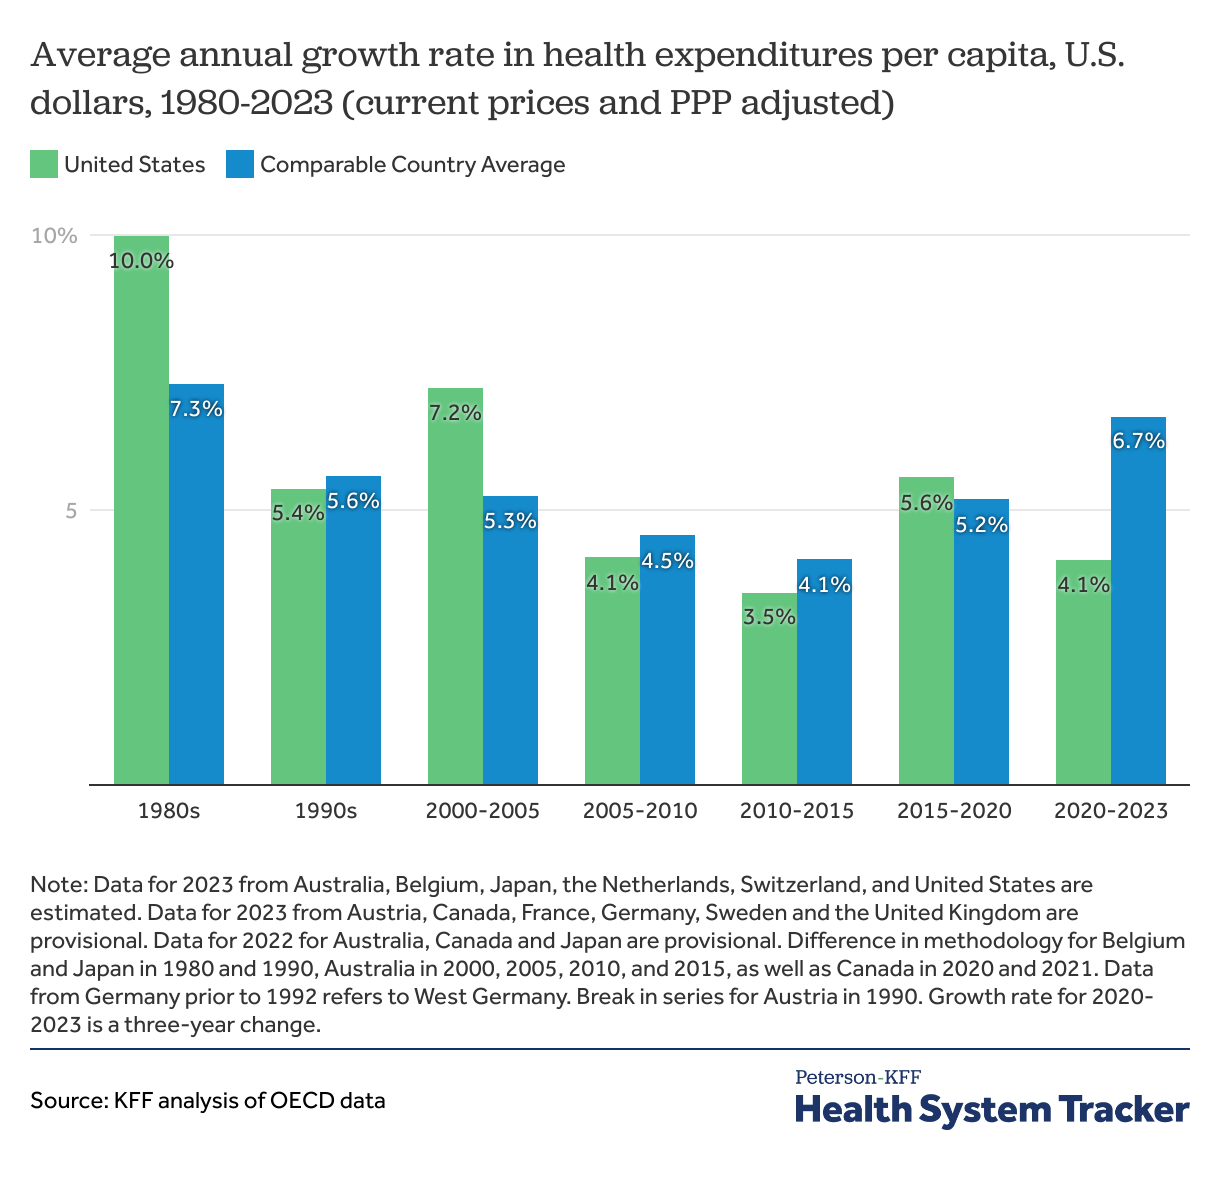
While the U.S. has long had higher than average health spending, recent years have seen higher spending growth in peer nations. Historically, the 1980s saw accelerated growth in health expenditures per capita in the U.S. The 10.0% average annual growth rate in the U.S. during the 1980s was significantly higher than comparable countries. Comparably wealthy countries saw an average of 7.3% annual growth during this period.
Looking at 5-year growth rates, during the period from 2005-2010, the U.S. saw an average annual growth rate in health spending of 4.1%, compared to 7.2% during the previous five-year period. Comparable countries also saw health spending growth slow down on average, from 4.5% average annual growth during the 2005-2010 period, down from 5.3% during the 2000-2005 period.
In the 5 years leading up to the COVID-19 pandemic (2015-2020), the U.S.’s growth in health spending per capita outpaced that of comparable countries (5.6% versus 5.2%). The annual growth rate for the average of comparable countries increased between 2020 and 2023 to 6.7% versus a 4.1% increase for the U.S. during the same period. In recent years, peer nations have seen increased spending on preventive care when compared to the U.S., as well as increasing overall spending per capita for inpatient and outpatient services.
The Peterson Center on Healthcare and KFF are partnering to monitor how well the U.S. healthcare system is performing in terms of quality and cost.