This chart collection examines how U.S. health spending compares to health spending in other OECD countries that are similarly large and wealthy, based on GDP and GDP per capita. This analysis uses data from the OECD Health Statistics database for peer countries, and from the 2024 National Health Expenditure Data for the United States.
Relative to the size of its economy, the U.S. spends a greater amount on health care than other high-income nations
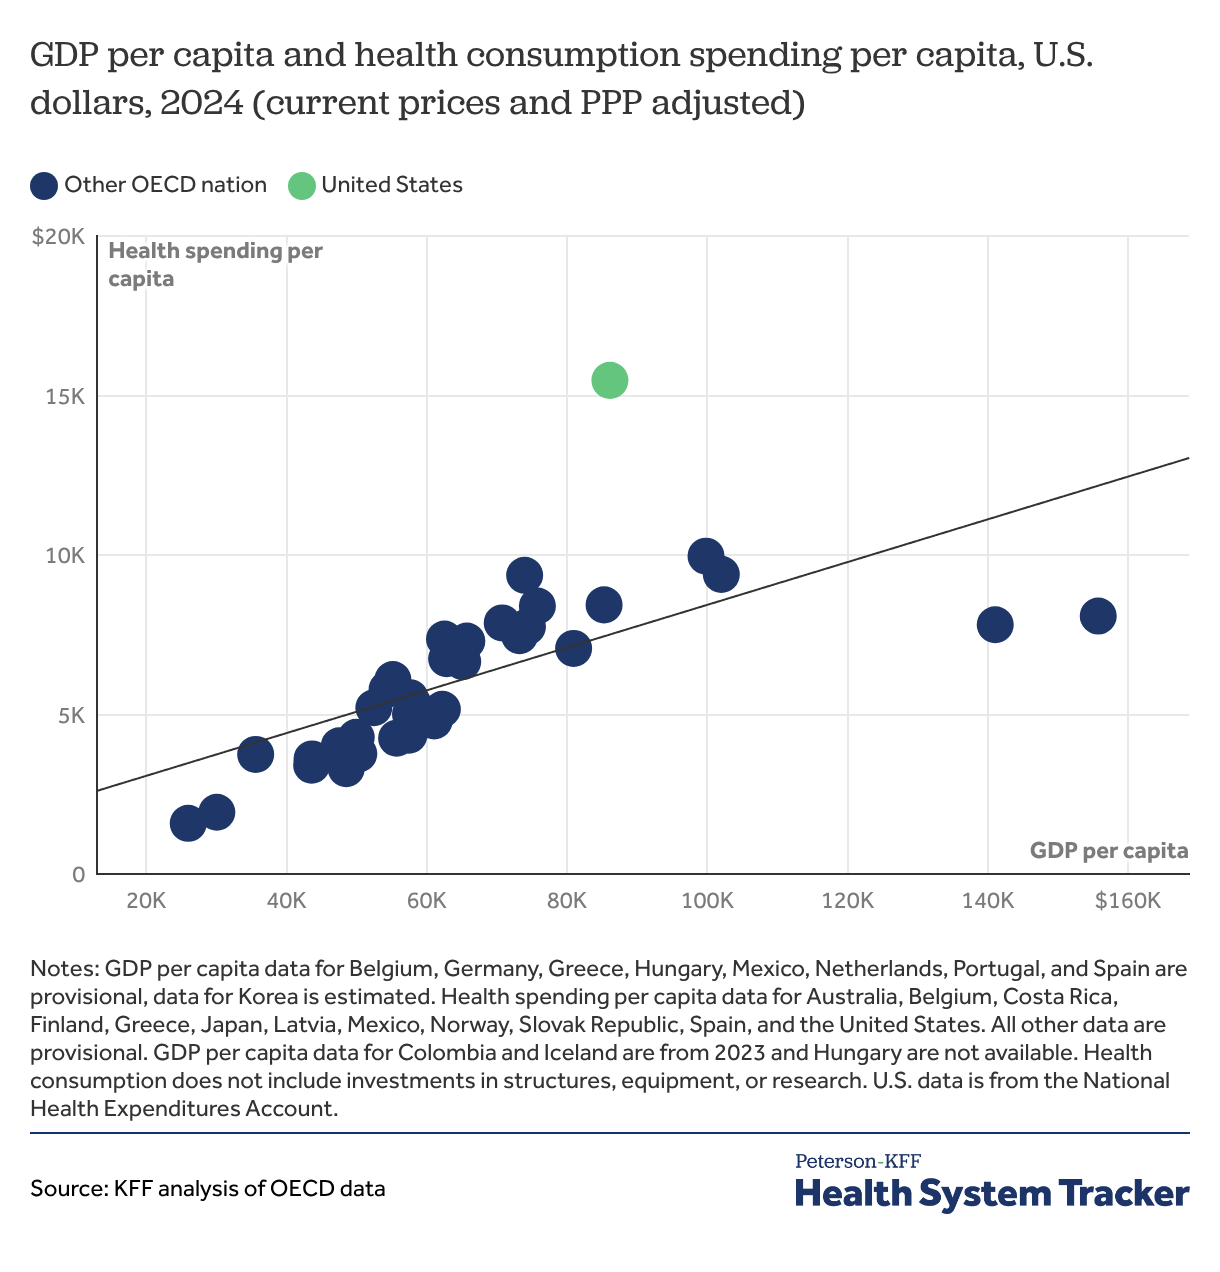
Wealthy countries, including the U.S., tend to spend more per person on healthcare than lower-income countries. However, even among higher-income countries, the U.S. spends far more per person on health.
Comparing health spending in the U.S. to other countries is complicated, as each country has unique political, economic, and social attributes that contribute to its spending. Because health spending is closely associated with a country’s wealth, the remaining charts compare the U.S. to similarly large and wealthy OECD countries.
On average, other large, wealthy countries spend about half as much per person on health as the U.S.
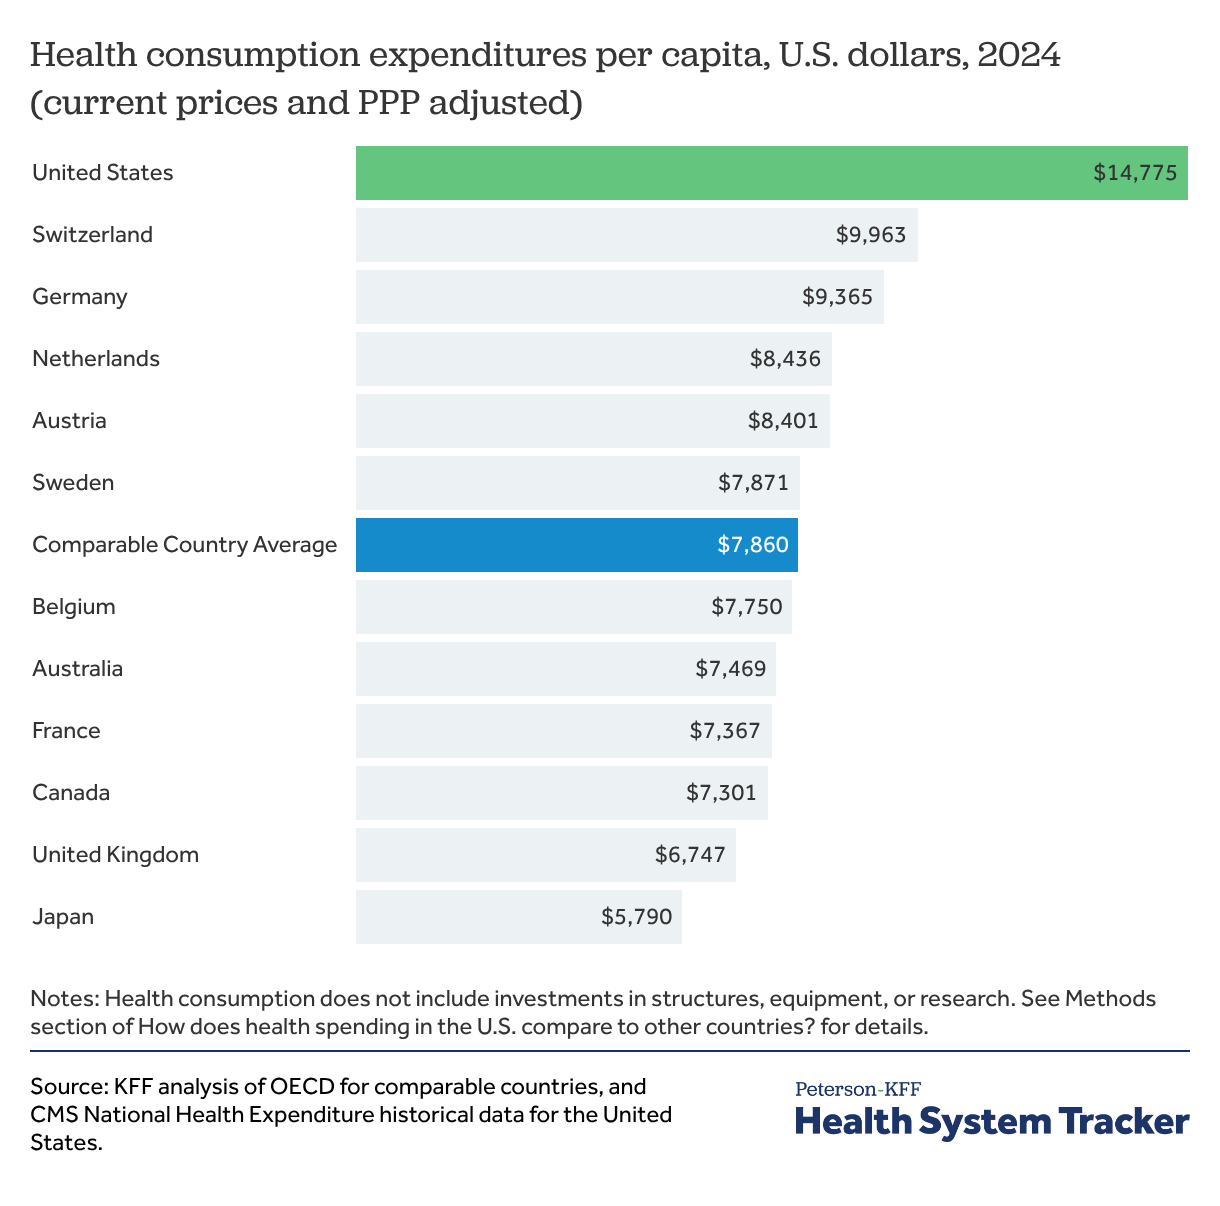
Health consumption expenditures per person, including consumption of health care goods and services, averaged $14,775 in the U.S. in 2024, which was almost $5,000 more per person than the next highest peer country, Switzerland. The average amount spent on health per person in comparable high-income peer countries ($7,860) is about half of what the U.S. spends per person.
Per capita health spending grew more in other peer nations than in the United States between 2023 and 2024
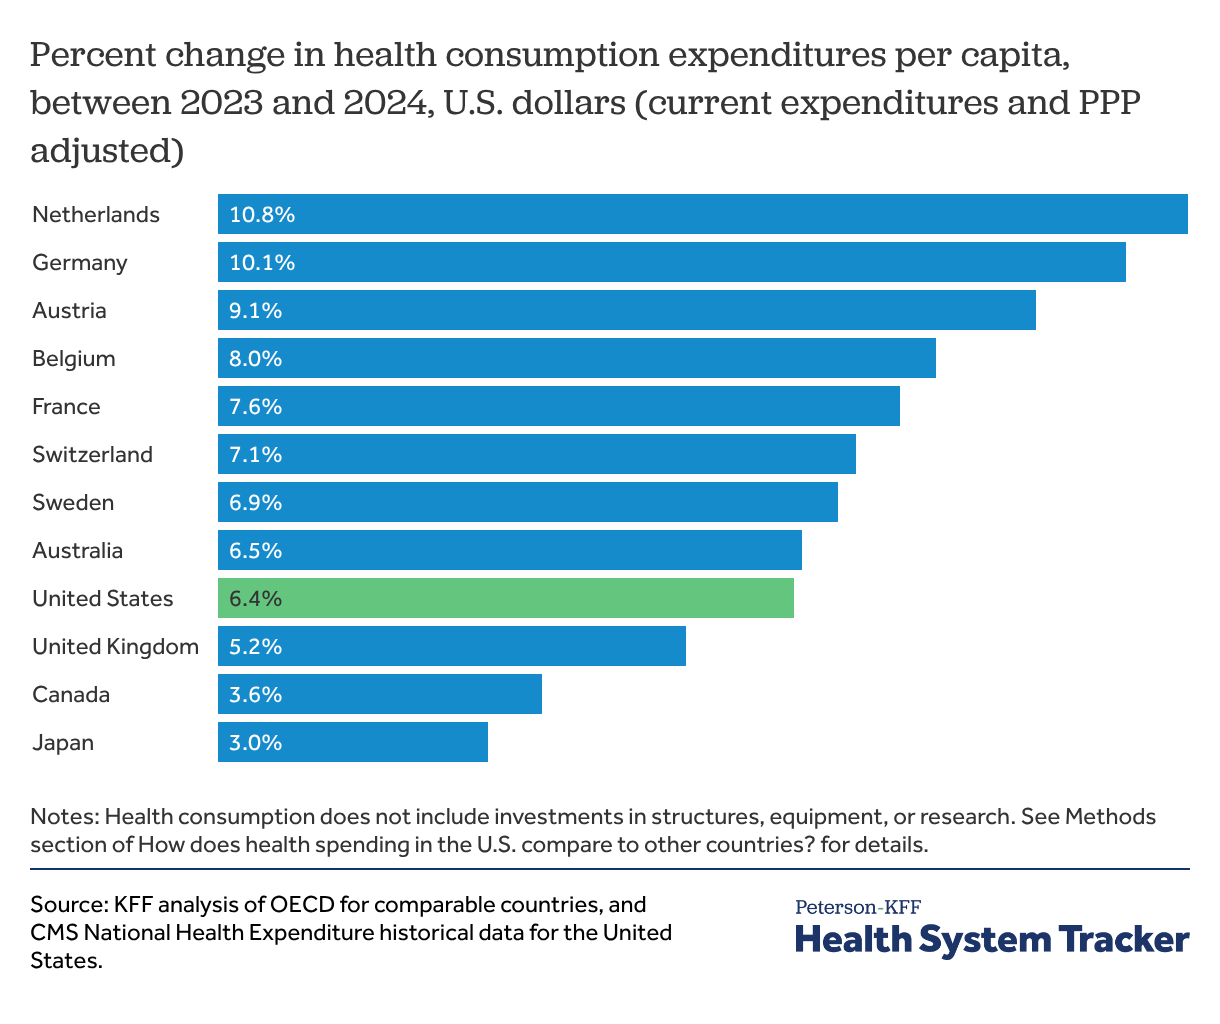
In all peer nations, health spending per capita increased between 2023 and 2024. However, the 6.4% increase in the U.S. in per capita health spending is lower than the percentage increases seen in other comparable countries including the Netherlands (10.8%), Germany (10.1%), Austria (9.1%), and Belgium (8.0%). The U.S. increase of 6.4% in per capita health spending in the U.S. is higher than the previous year-over-year increases between 2022 and 2023 (5.4%) and 2021 and 2022 (2.9%).
In dollar amounts, the U.S. had the largest increase, up $885 from 2023, slightly higher than the $862 per person increase in Germany and $822 per person increase in the Netherlands.
Related Content:
Health spending as a share of GDP in the U.S. remained steady in 2024 as growth in the economy roughly equaled health spending growth
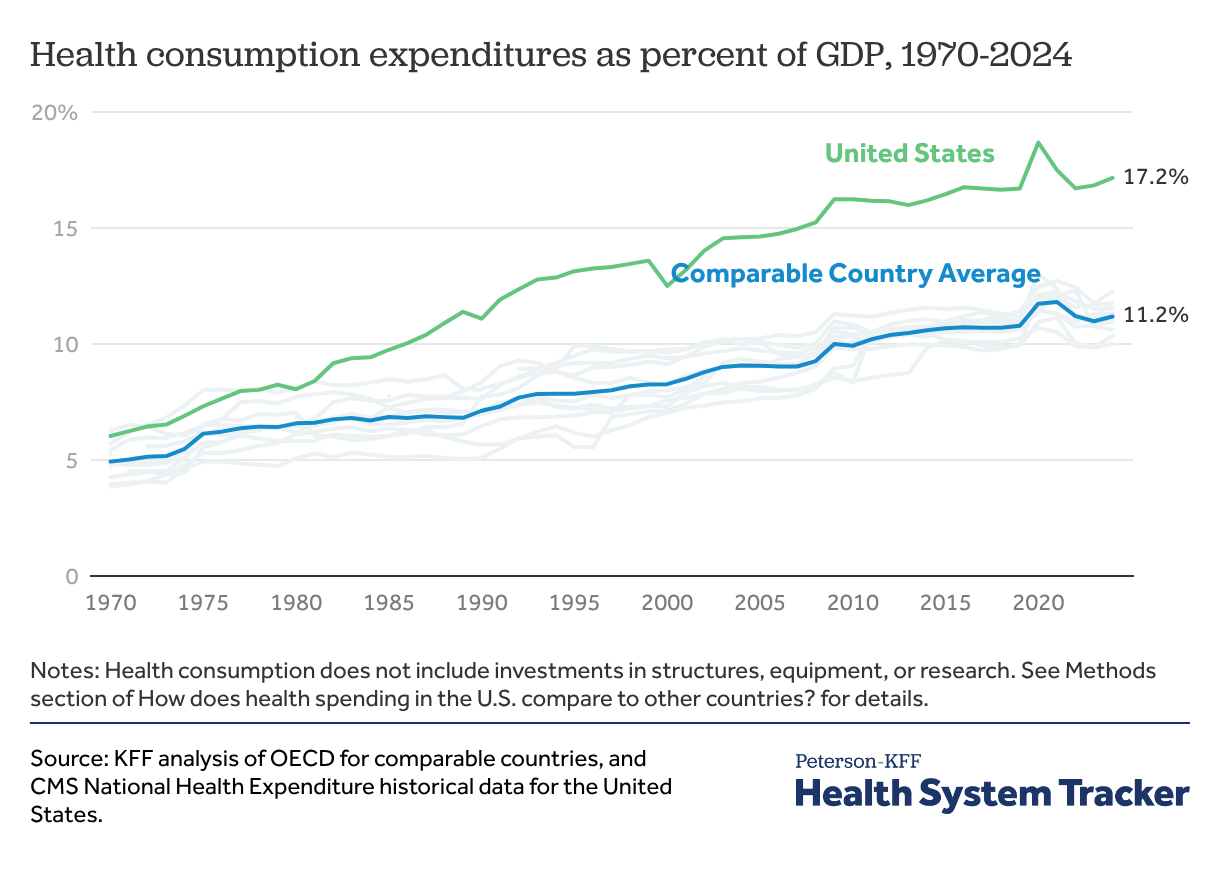
Over the past five decades, the difference between health spending as a share of the economy in the U.S. and comparable OECD countries has widened. In 1970, the U.S. spent 6.0% of its GDP on health, similar to spending in several comparable countries (the 1970 average of comparably wealthy countries was 4.9% of GDP). The U.S. was relatively on pace with other countries until the 1980s, when health spending in the U.S. began to grow at a significantly faster rate relative to its GDP. Since then, health spending as a share of the economy grew faster in the U.S. than in peer nations until the 2020s.
All high-income countries had unusually high health spending in 2020 due to the COVID-19 pandemic. The U.S. spent a record 18.7% of its GDP on health consumption in 2020. Health spending decreased slightly by 2021. In 2024, the U.S. spent 17.2% of GDP on health – still substantially higher than peer countries, which average 11.2% of GDP.
At times the U.S. has seen faster health spending growth, but more recently, health spending growth has been higher in comparable countries
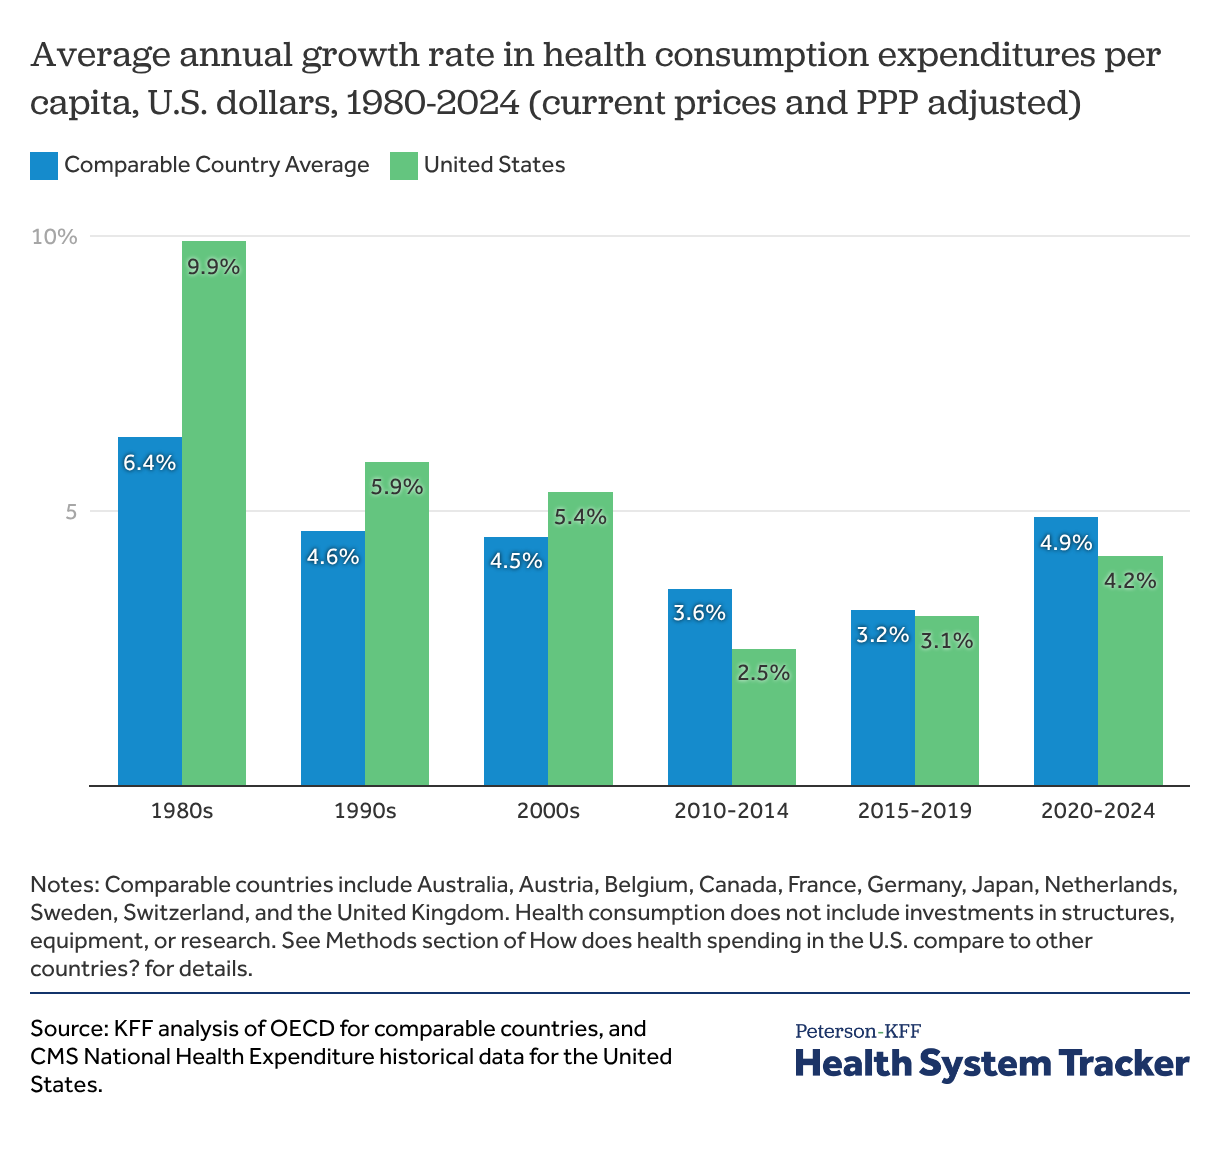
While the U.S. has historically had uniquely high levels of health spending, recent years have seen higher health spending growth in peer nations.
Starting in the 2010s, health spending growth slowed down in the U.S. and other peer nations. During the period from 2010-2014, the U.S. saw an average annual growth rate in health spending of 2.5%, compared to 5.4% during the previous decade. Comparable countries also saw health spending growth slow down on average, from 4.5% average annual growth during the 2000’s, down to 3.6% in the first half of the 2010’s.
In the 5 years leading up to the COVID-19 pandemic (2015-2020), the U.S.’s growth in health spending per capita was similar to that of comparable countries. The average annual spending growth rate of those comparable countries then increased between 2020 and 2024 by 4.9%, compared to a slightly slower 4.2% increase for the U.S. during the same period.
Health spending growth among peer countries outpaced the U.S. during the COVID-19 pandemic but returned to similar levels by 2023
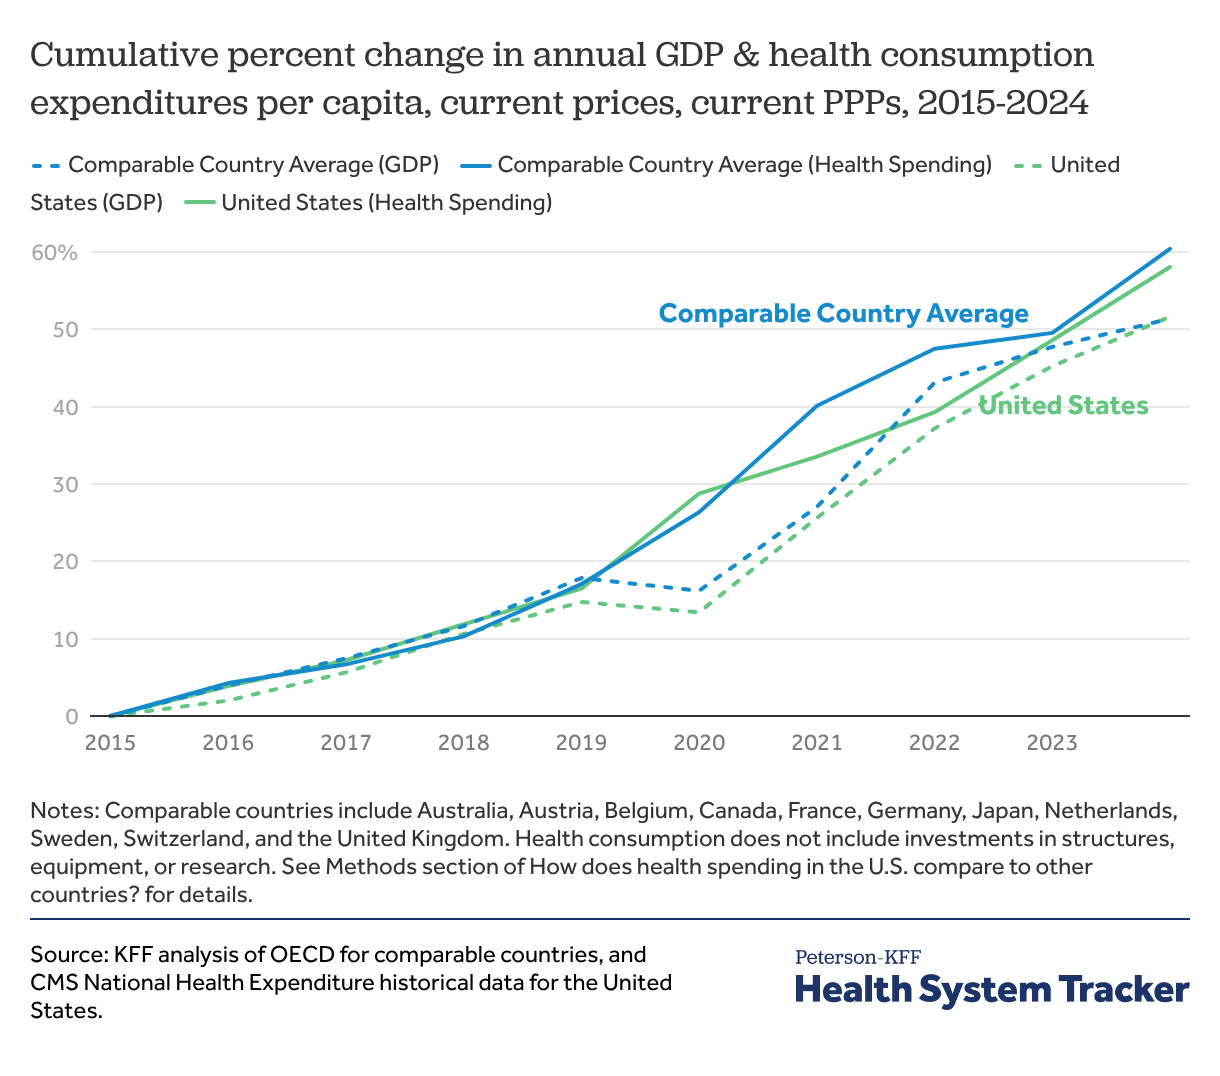
Following the COVID-19 pandemic, GDP was slower to grow compared to health spending. By 2021, GDP growth had resumed an upward trajectory across the U.S. and other peer nations.
Health spending has continued to outpace GDP growth in the U.S. and peer countries, leading to an increase in health spending as a share of GDP.
Methods:
United States health consumption expenditure comes from the 2024 National Health Expenditure Accounts, created by the Centers for Medicare and Medicaid (CMS) and released in the National Health Expenditure Historical tables. Health consumption for OECD countries includes the peer countries of Australia, Austria, Belgium, Canada, France, Germany, Japan, Netherlands, Sweden, Switzerland, and the United Kingdom.
Health consumption expenditures specifically include consumption of health care goods and services, and do not include investments in structures, equipment, or research, which have been removed from the NHE totals and are excluded from OECD data. All dollars are in current, U.S. dollars.
Data from OECD have several caveats in terms of the provisional nature of the data. GDP per capita data for 2024 for Australia, Belgium, Costa Rica, Finland, Greece, Japan, Latvia, Mexico, Norway, Slovak Republic, and Spain are provisional, data for Korea is estimated. Likewise, 2024 health spending per capita data for Austria, Canada, Chile, Colombia, Czechia, Denmark, Estonia, France, Germany, Hungary, Ireland, Italy, Korea, Lithuania, Luxembourg, Netherlands, New Zealand, Poland, Portugal, Slovenia, Sweden, Switzerland, and the United Kingdom are provisional. Health spending and GDP data were not available from the following OECD countries: Columbia, Czech Republic, Iceland, or Turkey.
Related Content:
There are also some breaks in the definitions and time series when using data from multiple years from OECD. Data for 2023 and 2024 are estimated for Australia, Belgium, and Japan. The health spending data is marked as “Definition differs” for data before 2023 in Australia, Belgium, Canada, and Japan, and there are time series breaks in Austria, Belgium, Canada, France, Germany, Japan, Netherlands, Sweden, Switzerland, and the United Kingdom in 2021 and 2023.
Data were downloaded on January 21, 2026.
The Peterson Center on Healthcare and KFF are partnering to monitor how well the U.S. healthcare system is performing in terms of quality and cost.