Employer-based health insurance is the largest source of health coverage for the nonelderly, covering 58% of this population in 2018. The workplace has long been a significant source of coverage for those in working families, although its importance has been declining over the long-term, particularly for those in lower and moderate-income households. As the economic consequences of COVID-19 continue to play out, many households may lose access to employer sponsored coverage. Recent data from the Bureau of Labor Statistics indicates a record number of jobless claims, suggesting a marked increase in unemployment over the next couple of months and potentially longer. This brief presents data from the most recent National Health Interview Survey to examine long-term trends in employer-based coverage and offer rates over the last two decades. It also examines the types of households which may be vulnerable as employer coverage continues to change and the economy responds to the pandemic.
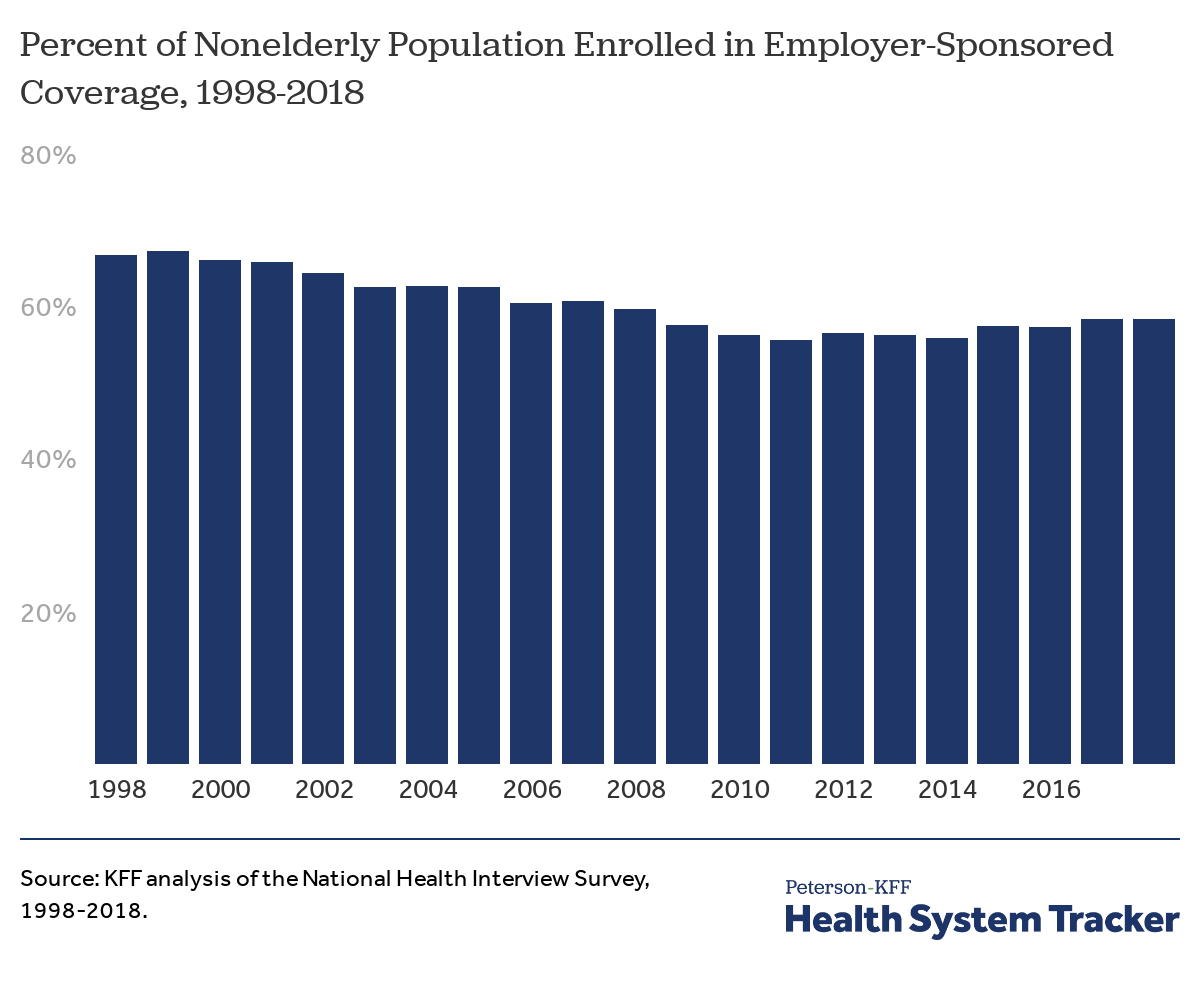
The share of the nonelderly population with employer-sponsored health insurance fell by more than 8 percentage points between 1998 and 2018, from 67% to 58%. The share of people with job-based coverage rose modestly over the five-year period between 2013 and 2018 as the economy improved, but not by nearly enough to offset the long-term decline. As unemployment rises due to the public health crisis, the modest gains in employer coverage in recent years are likely to be short-lived.
The share of people with employer-sponsored insurance has declined over the past 20 years
In total, 156.5 million nonelderly people were enrolled in an employer plan in 2018. If coverage rates had stayed at the 1998 level (67%), around 23.3 million additional people would have been covered by employer-sponsored plans in 2018. Even among nonelderly people who are working, the percent covered by an employer plan has decreased from 75% in 1998 to 70% in 2018.
The total number of people covered by employer-based insurance is roughly the same in 1998 and 2018
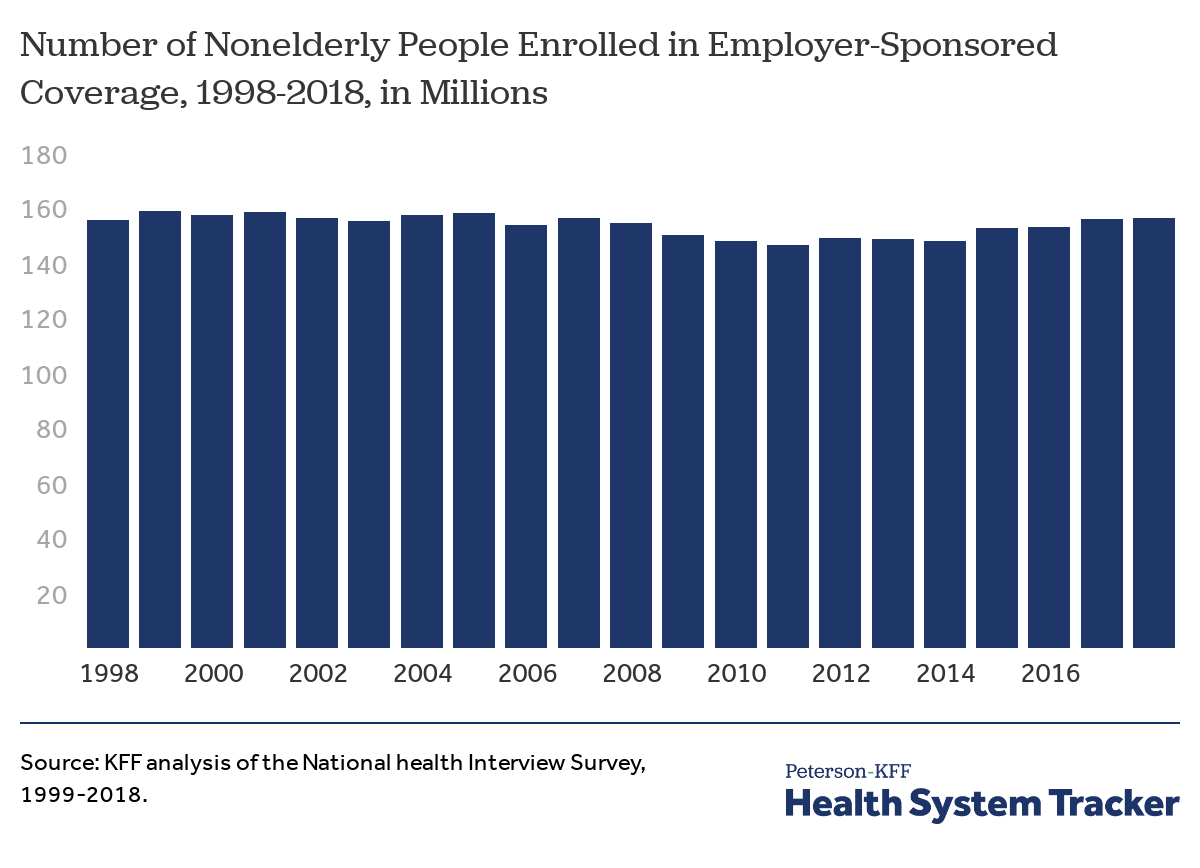
The number of nonelderly people with employer-based insurance has fluctuated within a relatively narrow band over time, even as the nonelderly population grew by 34.2 million people. The number of people covered by employer-sponsored plans fell during the economic slowdown after 2008, and recovered after 2014, reaching about the same number as 1998. In total, about 156.5 million people were covered by an employer in 2018, compared to 156.1 million in 1998.
Lower-income families and workers are much less likely to be covered by an employer plan
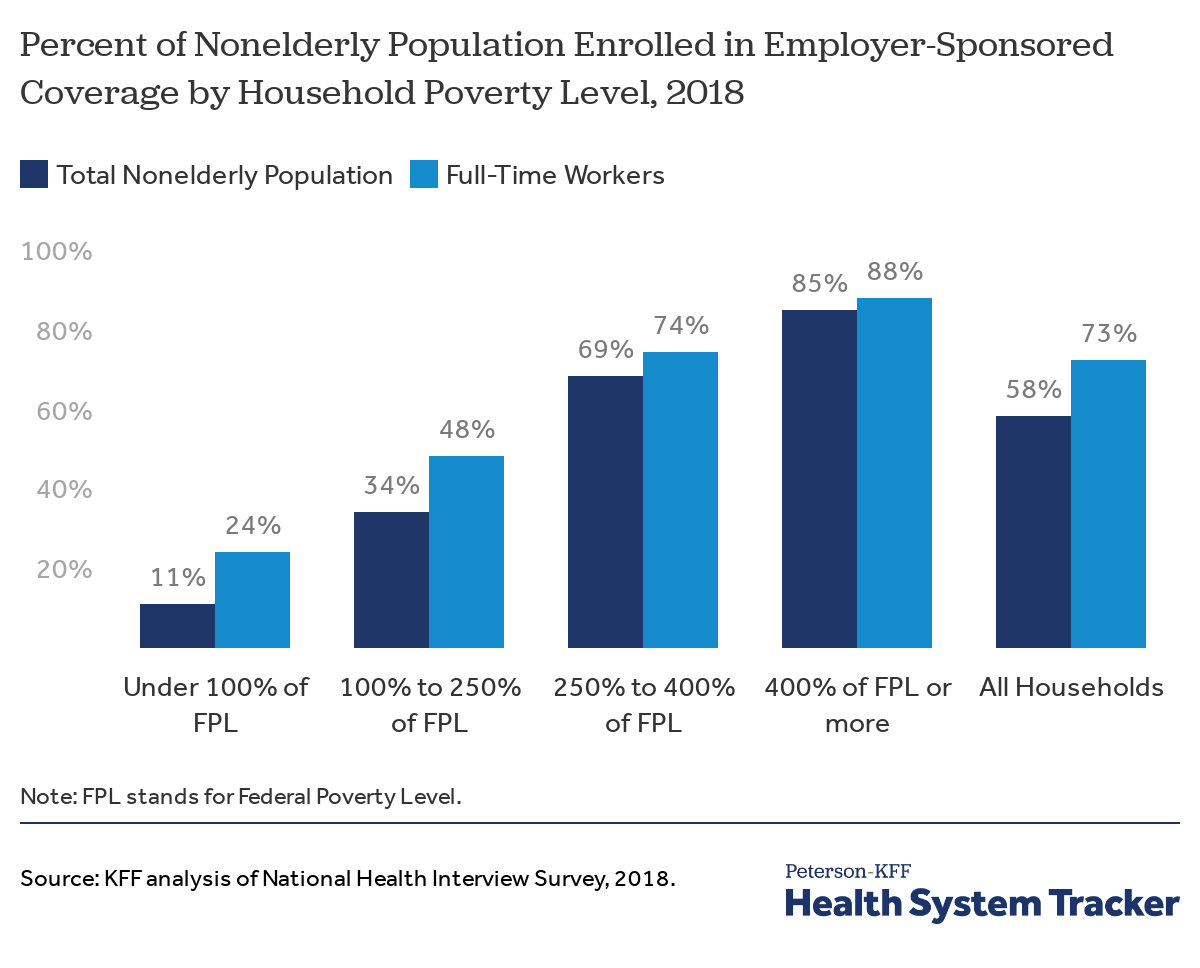
The share of nonelderly people covered by an employer plan varies significantly with household income; Eleven percent of nonelderly people with incomes below the Federal Poverty Level were covered through a job in 2018, compared to 85% with incomes over 400% of the poverty level. Even among full-time workers, nonelderly people with lower incomes were much less likely to be covered by employer-sponsored coverage in 2018 than those with higher incomes. A quarter (24%) of full time workers below the poverty line were covered by an employer plan compared to 48% of those between 100 and 250 percent of poverty.
Related Content:
The share of people with employer-based coverage fell from 1998 to 2018 for all income groups below 400% of the poverty line
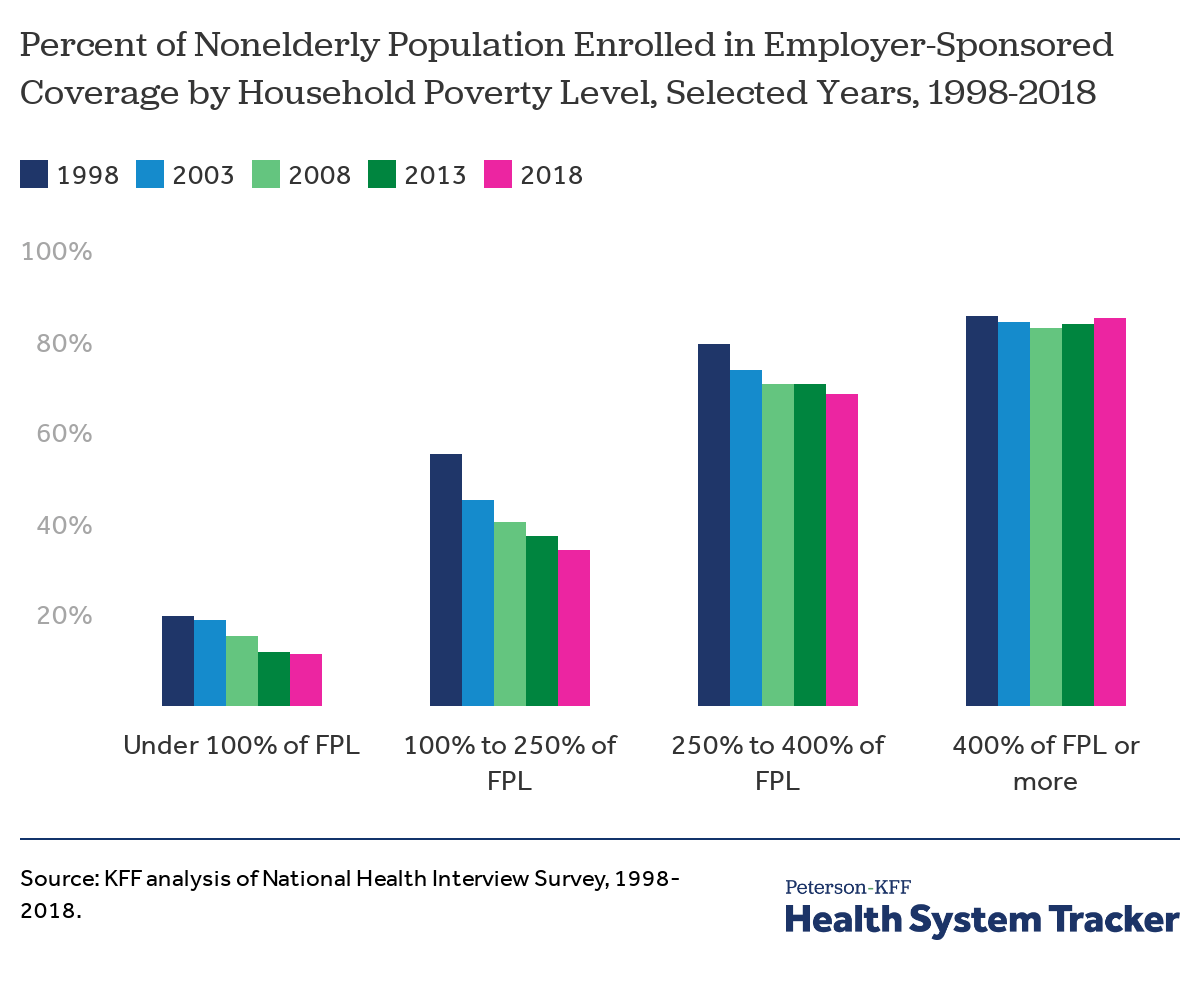
While the share of nonelderly people covered by employer plans has been decreasing, the trend is not uniform across income groups. The percentage of people with incomes above 400% of poverty who are covered by an employer plan is similar to 1998. The overall decrease in the coverage rate is explained by decreases in the coverage rates for those with lower household incomes. For example, individuals with household incomes between 100 and 250% of poverty saw a 19 percentage point decrease in coverage over the period.
About 7.3 million more nonelderly people were in employer-sponsored plans in 2018 than 2013, but this in itself does not explain the 2 percentage point increase in coverage (from 56% to 58%). This trend is explained by an increase in the share of the nonelderly population with incomes over 400% of poverty (35% in 2013 to 40% in 2018), as well as a corresponding increase in the share of this population that is enrolled in employer-based plans (83.8% in 2013 to 85.0% in 2018).
One potential reason for the drop in employer-sponsored coverage is the drop in percentage of workers offered coverage at their jobs
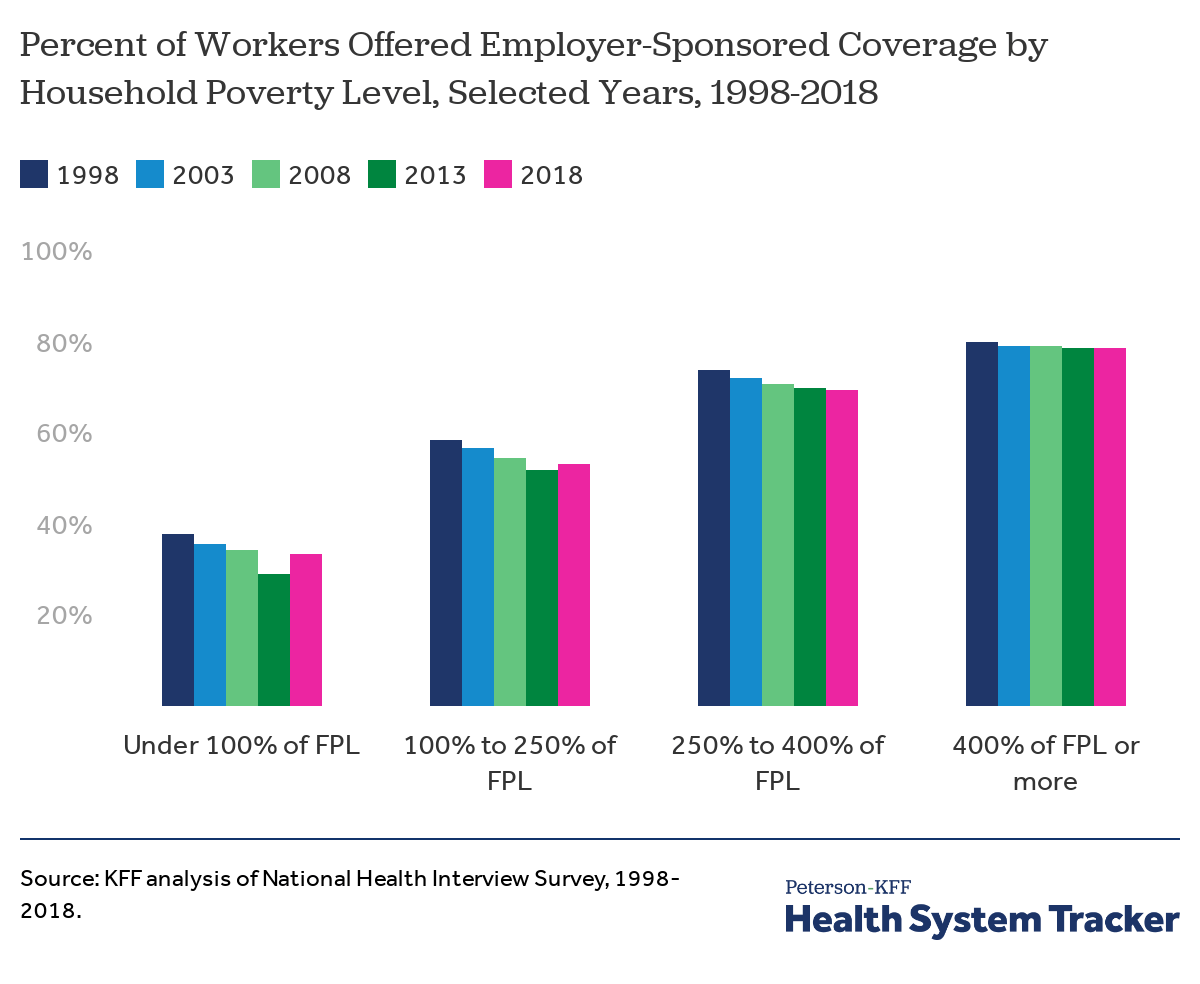
In 2018, 68% of workers were offered health benefits through their employer. During the period from 1998 to 2018, the percentage of workers offered employer-sponsored coverage dropped for workers in all household poverty categories. Although it has been increasing since 2013, overall the offer rate for nonelderly workers has decreased about 3 percentage points since 1998.
The offer rate increased between 2013 and 2018 for workers with incomes below the Federal Poverty Level, which may be due to the employer requirement to offer coverage under the Affordable Care Act, although offer rates were largely flat over this period for other income groups.
The likelihood of a worker accepting an offer of health insurance from their employer varies significantly with income levels
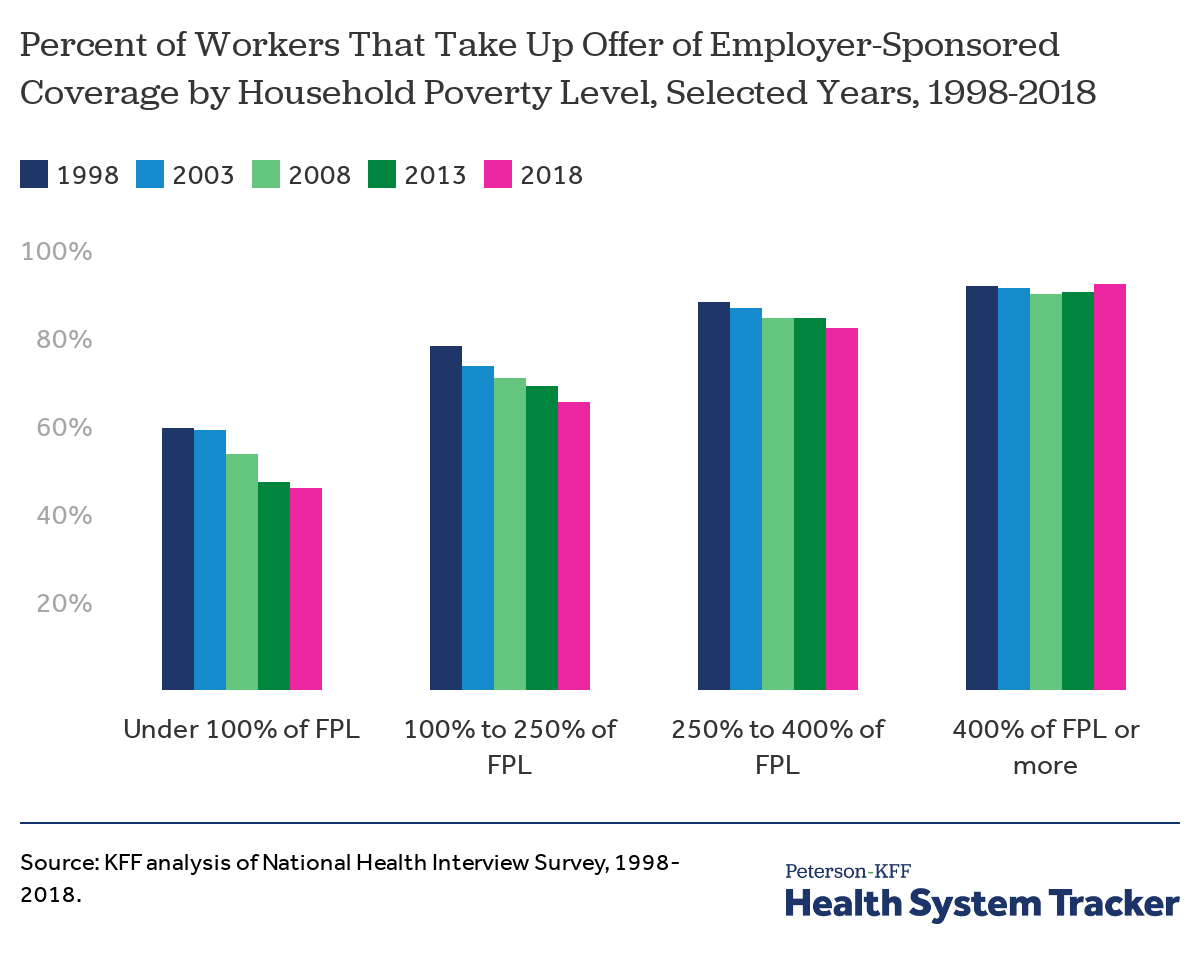
Not all workers are eligible for coverage, and not all of those who are eligible choose to enroll. Looking at nonelderly workers in households where someone is offered health benefits, we find that 84% of people are covered by an employer plan. The vast majority of employer’s who offer health insurance extend the offer to a worker’s family, although covered workers may face much higher premium contributions to enroll dependents. The rate at which these workers take-up an offer of coverage has decreased for income groups below 400% of poverty since 1998. Over that period, the largest decreases in take-up were among lower income households, with fewer workers in households below poverty or between 100% and 250% of poverty accepting an offer of coverage (down 14 and 13 percentage points respectively). One factor driving lower take-up rates may be the affordability of employer plans for lower-income workers.
Discussion
Although the long-term trend is clearly and significantly downward, the coverage rate for employer-sponsored coverage rose modestly between 2013 and 2018. There are several factors that may explain these trends. One is that the economy improved steadily from the deep downturn in 2008 and 2009, with both incomes and employment increasing up until 2020. The number of people with full-time employment increased by over 12 million between 2013 and 2018. The share of the nonelderly with incomes above 400% of poverty, where employer-sponsored health insurance is most prevalent, also rose during that period.
However, these modest gains in recent years were not enough to offset the long-term decline in employer coverage, and they are likely to be reversed in the current economic and public health crises. Beyond decreasing the number of full-time workers, and therefore the number of workers with an employer offer, a more competitive job market may lead some employers to drop coverage or reduce the generosity of their offerings. Under the Consolidated Omnibus Budget Reconciliation Act (COBRA), individuals losing employer coverage can remain enrolled on their employer plan for 18 months but are required to bear the full premium and an administrative fee. Given the relatively high cost of employer coverage, relatively few former workers tend to enroll in COBRA. Unlike the recession of 2008, additional coverage options such as subsidized non-group coverage and broader access to Medicaid in most states through the ACA, may affect how the uninsured rate and the share of employer coverage change in the current economic downturn.
Taking a longer-term view, the increases over the last few years brought the number of people covered by employer-sponsored health insurance back to about the same number of people as in 1998, despite the nonelderly population growing by 34.2 million people over the period. As a result, the share of the population covered by job-based coverage has declined substantially. Coverage in employer-based plans, while still the largest single source of coverage among the nonelderly, has become less important overall and particularly among people with incomes below 400% of poverty. Prior to COVID-19, employer-based insurance was already a relatively uncommon source of coverage for lower income households, and that is likely to become even more true as economy responds to the pandemic.
Methods
The National Health Interview Survey (NHIS) is a national probability survey of American Households sponsored annually by the U.S. Census Bureau and the Center for Disease Control and Prevention (CDC). Although NHIS was started in 1957, the survey is redesigned periodically and had a major redesign in 1997. We used survey starting in 1998, which was the first year after the redesign that included all of the insurance categories we typically use (in 1998, the survey asks about coverage through Children’s Health Insurance Program and also includes the variable “NOTCOV” for individuals without coverage). For more information on NHIS, please see https://www.cdc.gov/nchs/nhis.htm.
The analysis focuses on people below the age of 65 covered by employer-sponsored insurance (ESI). Some individuals have multiple types of coverage; individuals who are covered by Medicaid or Medicare Part B in addition to an employer plan are not included. Individuals who are covered by Medicare Part A and an employer plan are assumed to have ESI as their primary coverage (less than 1% in 2018). Full-time workers work at least 30 hours a week.
Households at more than 400% the FPL earn different incomes depending on a family’s composition; for example, in 2018, a single nonelderly adult would earn about $52,000 and a family of four including two children would earn about $102,000.[i]
[i] NHIS uses the Census Bureau’s federal poverty thresholds, while HHS and this portion of the brief use federal poverty guidelines to determine eligibility for some public assistance programs.
The Peterson Center on Healthcare and KFF are partnering to monitor how well the U.S. healthcare system is performing in terms of quality and cost.