As deductibles have risen and become more common over the past decade, many people with employer-sponsored coverage have faced rising out-of-pocket costs. Out-of-pocket spending is increasingly likely to be in the form of a deductible, which often means enrollees pay large upfront costs. These costs can therefore be more of a financial shock than copays that build up more gradually over the course of the year.
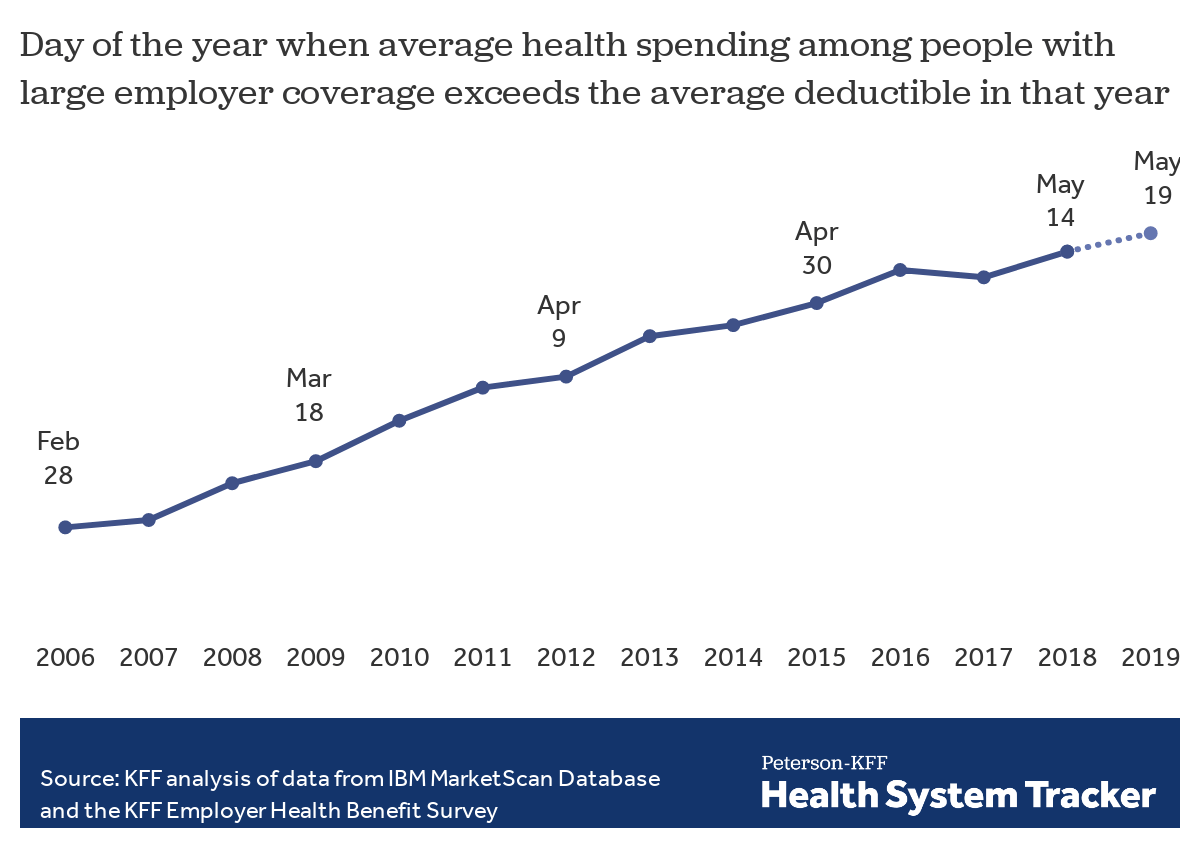
In this analysis, we set out to estimate the time of year when the average person with employer coverage satisfies their deductible and how that has changed over time. This year, we estimate “Deductible Relief Day” – the day when enrollees have on average incurred enough health spending to hit the average deductible in an employer plan – will fall on Sunday, May 19, 2019.
'Deductible Relief Day' – the day when average health spending exceeds the average deductible in employer plans – is Sunday May 19th Share on X
What is a deductible?People with private insurance coverage may face three kinds of “cost sharing,” also known as out-of-pocket spending, under their plan:
|
Over time, as deductibles have increased, Deductible Relief Day has fallen later in the year, meaning enrollees have to wait longer to receive the financial protection of their coverage. Ten years ago, Deductible Relief Day fell two months earlier in the year, on March 18, 2009. Back in 2009, the average deductible was $533 for a single person, but has since risen by over 150% to $1,350 in 2018.
Related Content:

As deductibles rise, people with employer coverage meet their deductibles later into the year
How we calculate “Deductible Relief Day”
To arrive at an estimate of the day the average person with employer coverage incurs enough health spending to reach the typical deductible, we analyzed large employer claims data from IBM’s MarketScan Research Database. The MarketScan claims database contains information provided by large employers about claims and encounters for several million individuals. In this analysis, we calculated total health spending per person, including people who have no health spending, for services that typically count towards deductibles in plans offered through employers, each day of the year. We then calculated how many days it takes for cumulative per person health spending to sum to the average deductible in our Employer Health Benefit Survey in a given year. (For more information, see the Methods).
While claims data can be used to analyze average health spending that is typically subject to deductibles, it has limitations. For example, the claims data do not include plan design information, so this analysis does not look at when each individual person reaches his or her deductible. Plan benefit designs vary from employer to employer, and it is not uncommon for a plan to cover some services or prescription drugs before the deductible is met. Some people have very high health spending and therefore will likely meet their deductibles early in the year. Those with very low health spending may never meet their deductible, nor will the 1 in 8 people with employer coverage who have no health spending at all in a given year.
Rising deductibles and affordability challenges
Rising deductibles and rising health care costs have driven out-of-pocket spending upwards and caused affordability challenges for many people with employer coverage Share on XOver the last decade, deductibles have become an increasingly prominent component of employer-sponsored coverage. In 2018, about 85% of covered workers enrolled in a plan with a deductible, compared to 59% ten years earlier. Unsurprisingly, as large deductibles have become more common, people with employer coverage are increasingly likely to have deductible spending. Among those who used health care services, we find that two-thirds (66%) of large employer plan enrollees had deductible spending in 2017, considerably more than the 45% who did a decade earlier.
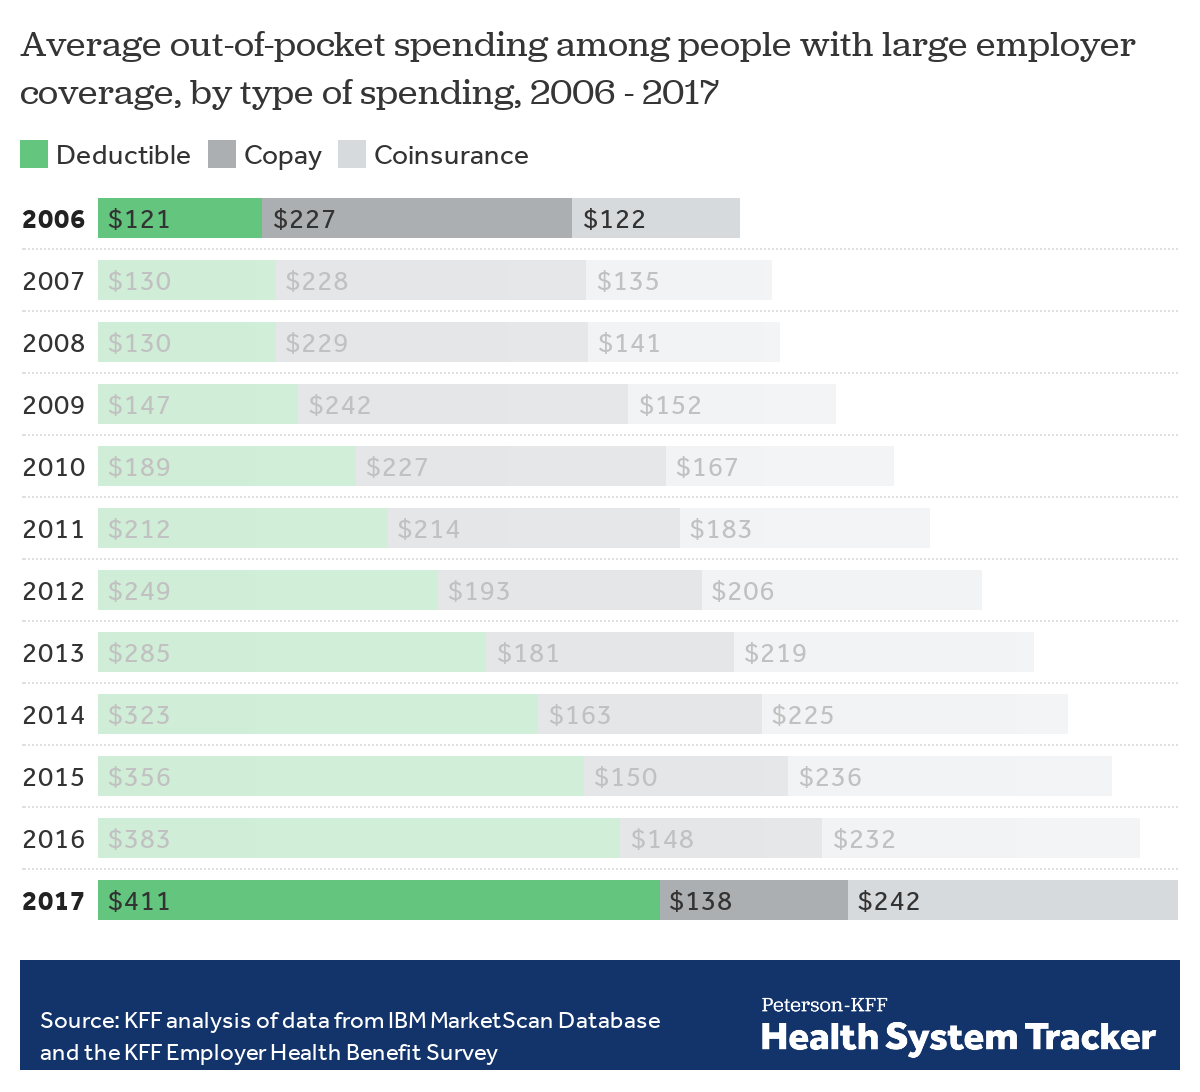
Rising deductibles, along with general increases in health care costs, have also driven out-of-pocket spending upwards. Average out-of-pocket spending among people with employer coverage has increased from $493 in 2007 to $792 in 2017, and much of the increase in cost sharing has taken the form of higher spending on deductibles. Average per enrollee spending on copays has decreased over the last decade, while average spending on deductibles has more than doubled from $130 in 2007 to $411 in 2017.
Rising deductibles have driven most of the growth in out-of-pocket spending
In a recent KFF/LA Times survey of people with employer coverage, affordability problems emerged as a key issue, particularly for those with higher deductibles. Among all people with employer coverage, the ability to pay for medical bills before meeting their deductible topped the list of most difficult affordability problems. Those with higher deductibles were more likely to experience problems affording care and more likely to delay needed care than those with lower deductibles. Among people with high deductibles, most (53%) reported having less in savings than the amount of their deductible.
Unlike copay and coinsurance spending, deductible spending is concentrated in the beginning of the year, meaning enrollees in high deductible plans may need to have significant savings to cover their medical costs before their deductible is satisfied.
Deductible spending is concentrated earlier in the year
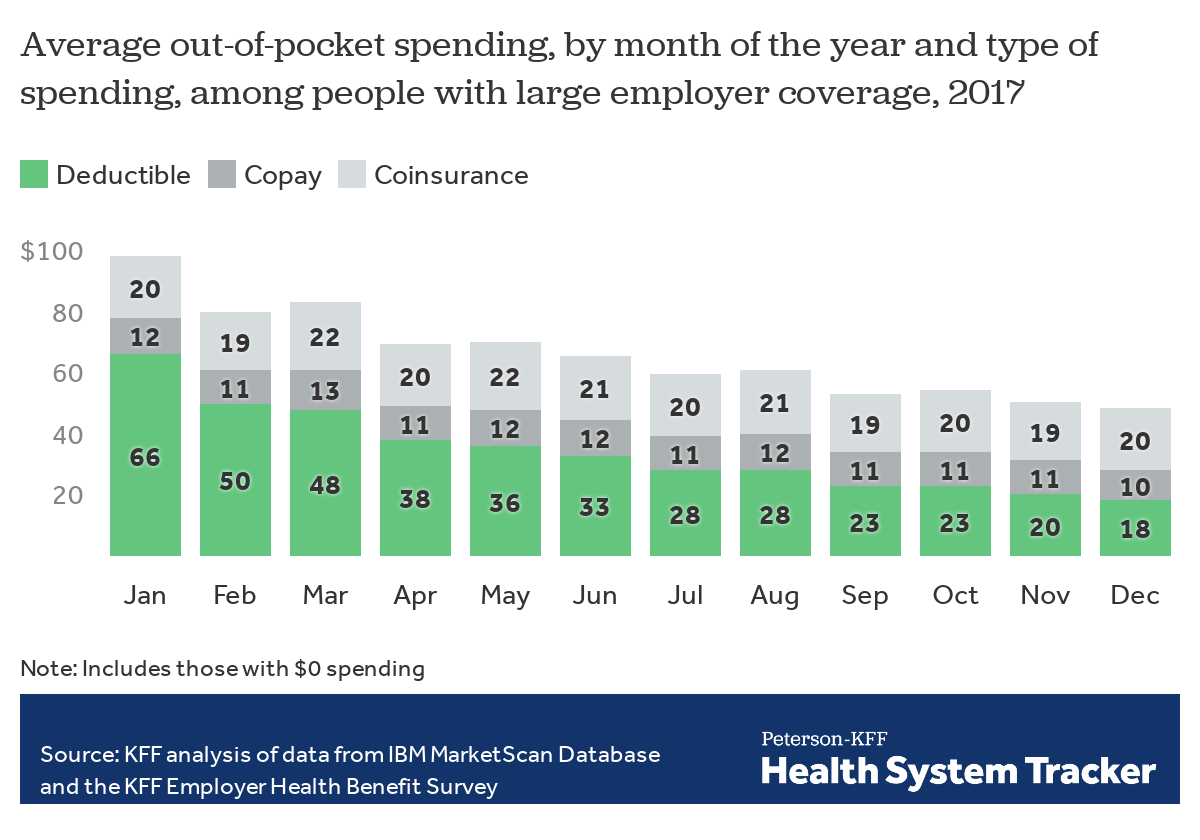
In this analysis of employer claims data, we find that average out-of-pocket spending in January is double that of December. Over two-thirds of average out-of-pocket spending in January is in the form of deductibles, compared to just over a third in December.
A decade ago, when deductible spending was lower, out-of-pocket spending was more evenly spread over the year
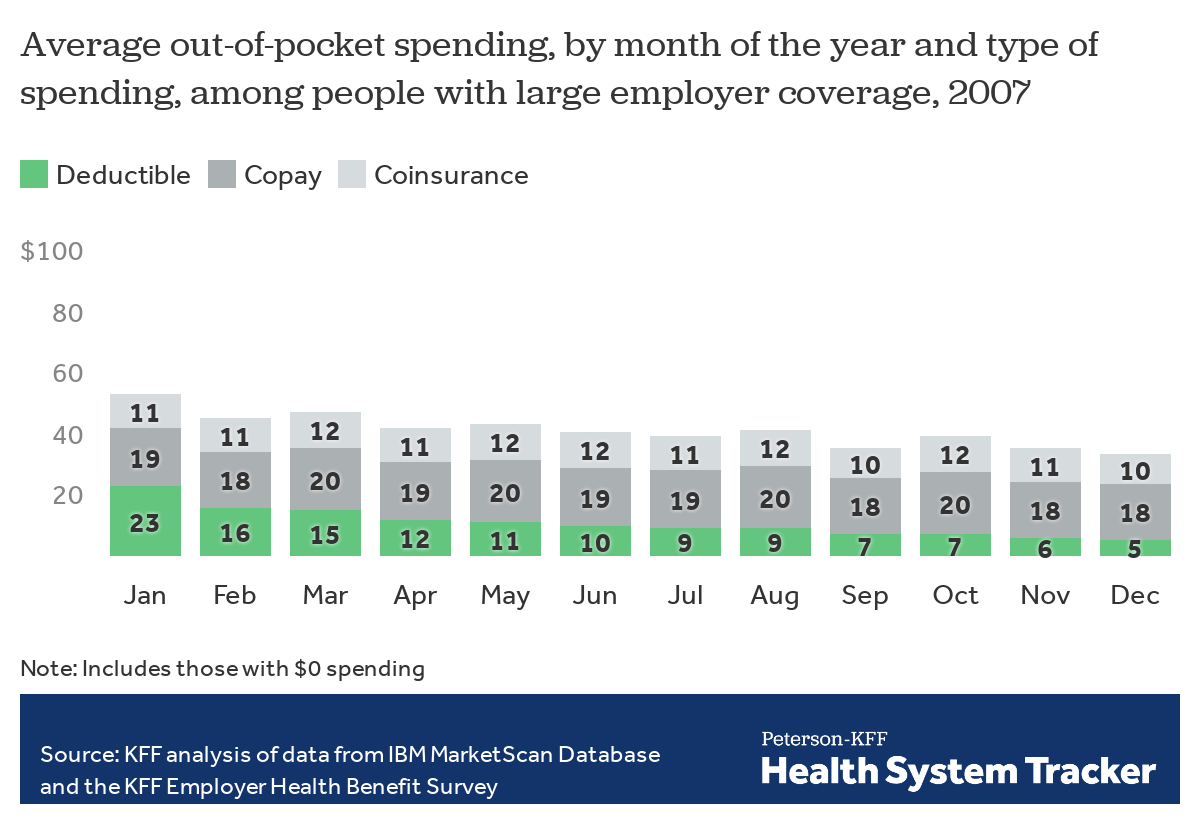
In 2007, when enrollee out-of-pocket costs were much less concentrated on deductibles and more so on copays and coinsurance, out-of-pocket spending was spread much more evenly throughout the year.
Discussion
As deductibles rise and become more common, fewer people satisfy their deductibles and it takes longer into the year for people on average to do so and begin benefiting more fully from the financial protection of their health plan. We estimate Deductible Relief Day for people with employer coverage will fall on May 19, 2019, two months later into the year than a decade ago.
As it has become more common for employer-sponsored plans to include a deductible, and deductibles have increased, out-of-pocket costs for enrollees have become more concentrated in the beginning of the year. People with large employer coverage, on average, have spent almost a quarter of their annual out-of-pocket costs by the end of February. And, as deductibles have risen and become more common, and health care costs have increased generally, out-of-pocket spending overall has grown.
Deductible Relief Day provides a way to think about how rising deductibles affect household budgets. In 2019, over a third of the year has passed before the average enrollee has incurred enough spending to meet the average deductible. As many enrollees do not have sufficient assets to be able to pay a typical deductible, these higher, more concentrated costs can lead to delayed or forgone care and difficulty paying medical bills.
Methods
We analyzed a sample of medical claims obtained from the IBM MarketScan Commercial Claims and Encounters Database, which is a database with claims information provided by large employer plans. We used a subset of claims from the 2006 to 2017 datasets. We only included claims for people under the age of 65 and people who were enrolled in a plan for more than half a year. Weights were applied to match counts in the Current Population Survey for enrollees at firms of a thousand or more by sex, age, state and whether the enrollee was a policyholder or dependent. This analysis used claims for almost 17 million people representing about 19% of the 86 million people in the large group market.
“Deductible Relief Day” is the day in which cumulative average per enrollee spending exceeds the average deductible. In this calculation, we did not include out-of-network spending, since deductibles are often higher for out-of-network care. We also did not include spending on prescription drugs or outpatient office visits (CPT codes 99211 through 99215), which are typically paid for by the plan before the enrollee meets the deductible. Average deductible values are from the 2018 KFF Employer Health Benefits Survey and the 2005-2017 Kaiser/HRET Survey of Employer-Sponsored Health Benefits. The Employer Health Benefit Survey is a national probability survey of private and non-federal public employers with 3 or more employees. The deductible threshold is the average general annual deductible for single coverage in any given year. Covered workers enrolled in a plan without a deductible are given a value of zero, lowering the average. A small percentage of workers may face service-specific deductibles, in addition to a general annual deductible.
Charts reporting out-of-pocket spending throughout the year are based on available out-of-pocket spending, including out-of-network and prescription drug claims. Out-of-pocket spending reflects the average spending of one worker, one spouse and two dependent children. We estimated cost sharing in 2018 by inflating 2018 spending by 4.5%, the increase in family health insurance premiums in 2018. We estimated the 2019 “Deductible Relief Day” by inflating the 2018 date by the average of the number of days in which the dates in the past 5 years have changed from the previous year.
When noted, historic estimates were adjusted to 2017 dollars using the January-to-January CPI-U, all urban consumers data, made available from the Bureau of Labor Statistics (CUUR0000SA0).
The Peterson Center on Healthcare and KFF are partnering to monitor how well the U.S. healthcare system is performing in terms of quality and cost.