Household Health Spending Calculator
People generally think of their health spending as the amount paid for monthly premium contributions, as well as any out-of-pocket costs toward medical care or prescription drugs. However, a significant portion of health spending is not as visible to people in their everyday lives. This less direct health spending includes state and federal income taxes that fund health programs like Medicare and Medicaid, and Medicare payroll taxes. Additionally, people with employer-sponsored insurance receive additional compensation in the form of tax-preferred contributions (including workers’ and their employer’s contribution) to their health insurance premiums.
This interactive tool combines several publicly available data sources to examine how much individuals and families in the United States spend on health each year, both directly and indirectly. Use the dropdown menus to explore more scenarios and trends in household health spending.
Our analysis finds that the typical non-elderly family in the United States spends an average of $5,600 per year (9% of their $65,352 income) on health. This includes $1,400 (2% of their income) in out-of-pocket spending, $2,200 (3% of their income) in health insurance premiums, and approximately $2,000 (3% of their income) in state and federal taxes that fund health programs.
When we consider employer contributions to Medicare payroll taxes and health insurance premiums, the total amount spent per person on health is even greater. On average, we estimate the typical single person with employer-sponsored coverage contributes $1,550 per year toward his or her premium, and pays an additional $900 per year in out-of-pocket health costs (such as deductibles, copayments, and coinsurance). We estimate this person is also paying $2,850 in state and federal taxes that fund various health programs, and that his or her employer is contributing an additional $6,600 toward the employer-sponsored premium, as well as $850 in Medicare payroll taxes. While the combined amount spent on premiums and out-of-pocket costs ($2,450) is the most visible health cost for the employee, their health spending, including taxes, totals $5,300 (9% of their $57,000 income). This amount increases to $12,750 when considering the employer contribution to the individual’s premium, and Medicare payroll taxes. Employer premium contributions for health insurance are generally offset from workers’ wages.
This interactive also displays how overall health spending varies from person to person. For example, a typical single-person with Medicaid coverage spends 4% ($550) of their $14,056 after-tax income on health per year, while the typical individual with employer-sponsored coverage spends 9% of their $57,000 income on health. This reflects the Medicaid program’s aim to provide financial protection to low-income enrollees.
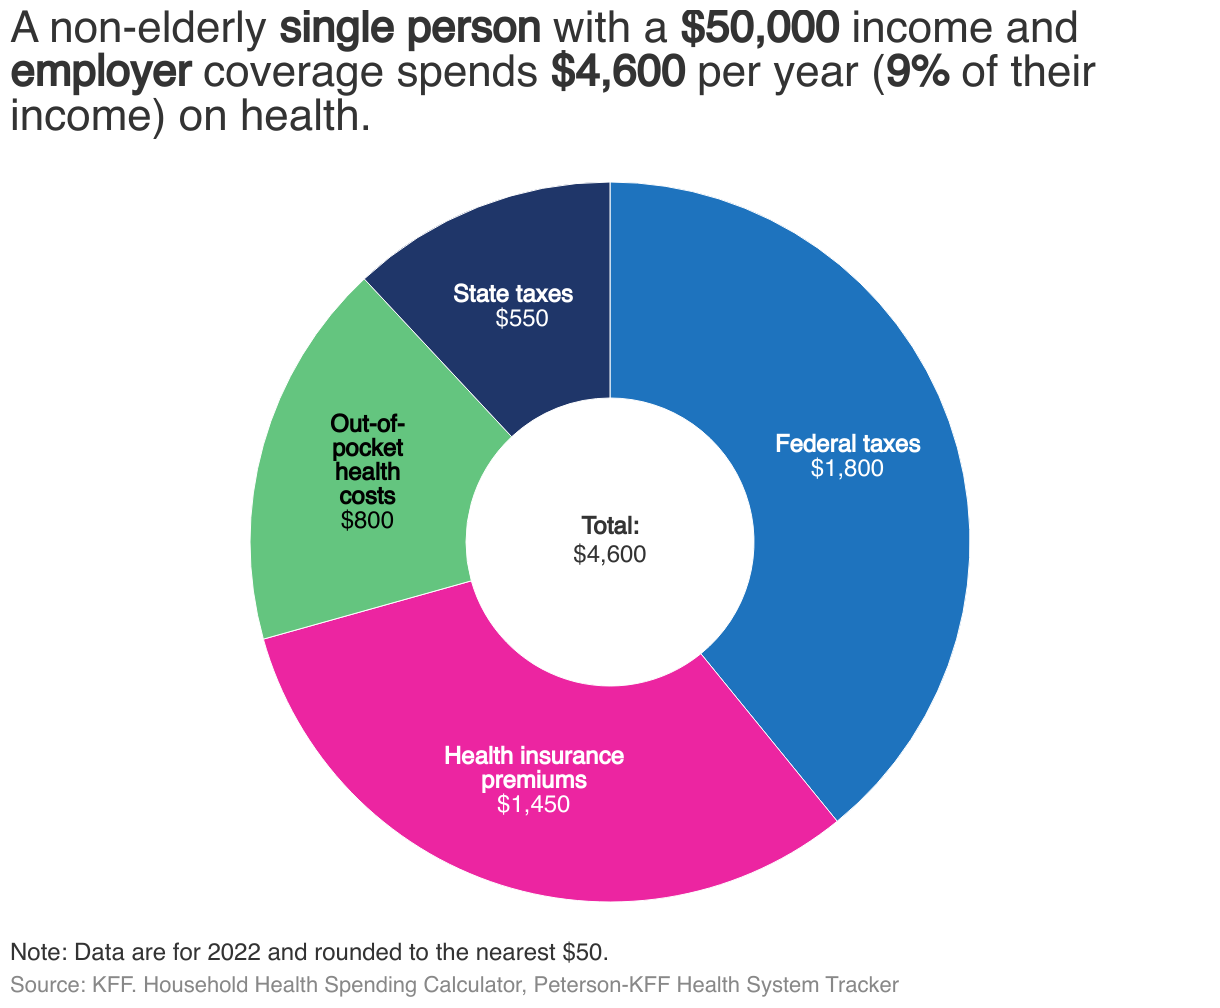
Even for people at the same income level, health costs can vary dramatically depending on the source of insurance. A single person with a $50,000 income and individual market coverage spends 18% of his or her income on health, while a similar person would spend only 9% of their income on health if they had employer-based coverage (not including the employer’s contributions toward the premium or Medicare payroll tax, as that spending is in addition to the person’s salary).
Health status also plays a role in determining household health spending. A family of four with all members in good health with a $100,000 income and employer-sponsored coverage typically spends $9,300 per year (9% of their income) on health. In contrast, a family of the same size with the same income and coverage type and at least one member in worse health would spend an average of $11,500 per year (12% of their income) on health. The difference is primarily attributable to out-of-pocket costs for the family with at least one member in worse health being 95% higher (average of $3,900 for the family with at least one member in worse health vs. $2,000 for the family in better health).