Prior to the Affordable Care Act (ACA), insurers selling coverage to individuals would deny people with serious pre-existing conditions and high-risk occupations, exclude coverage for certain services or treatments, and charge higher premiums for people who had more minor health conditions. Since its implementation in 2014, the ACA has prohibited insurers from denying coverage based on pre-existing conditions, required a minimum set of benefits be covered, and restricted the ways insurers can vary premiums.
When insurers must cover people with pre-existing conditions and pay for treatments, average claims and therefore premiums are higher than when insurers were able to exclude people who are sick or refuse to pay for their treatment. To help make coverage more affordable for low and modest income people, the ACA also includes premium tax credits that lower the monthly premium payments for most enrollees. These tax credits work on a sliding scale, capping how much an enrollee has to pay toward their premium at a certain share of their income, with lower income people paying less and higher income people paying more.
While the ACA included some changes to employer-sponsored health insurance as well, particularly for plans sold to small companies, the changes were more minimal for larger employers, which had generally already offered more comprehensive health insurance before the ACA. In the group market, employers usually pay a large share of the premium, with employees making a contribution as well. Employee health plans also benefit from tax breaks. The employer’s contribution to the premium is not considered taxable income, and employee contributions are usually paid with pre-tax dollars.
This analysis uses data from Mark Farrah Associates Health Coverage Portal to compare average premiums in the individual and group insurance markets. This data is based on insurer filings to NAIC in the Annual Exhibit of Premiums and Utilization, showing the average premiums and claims per member per month. In this data, the group market includes fully-insured coverage sold to small and large employers, with the majority being smaller employers. The vast majority of individual market coverage is ACA-compliant coverage sold on- and off-exchange, but it also includes some enrollment in non-compliant coverage sold off-exchange (such as short-term limited duration plans).
The ACA’s individual market has similar average premiums and claims as employer-sponsored plans
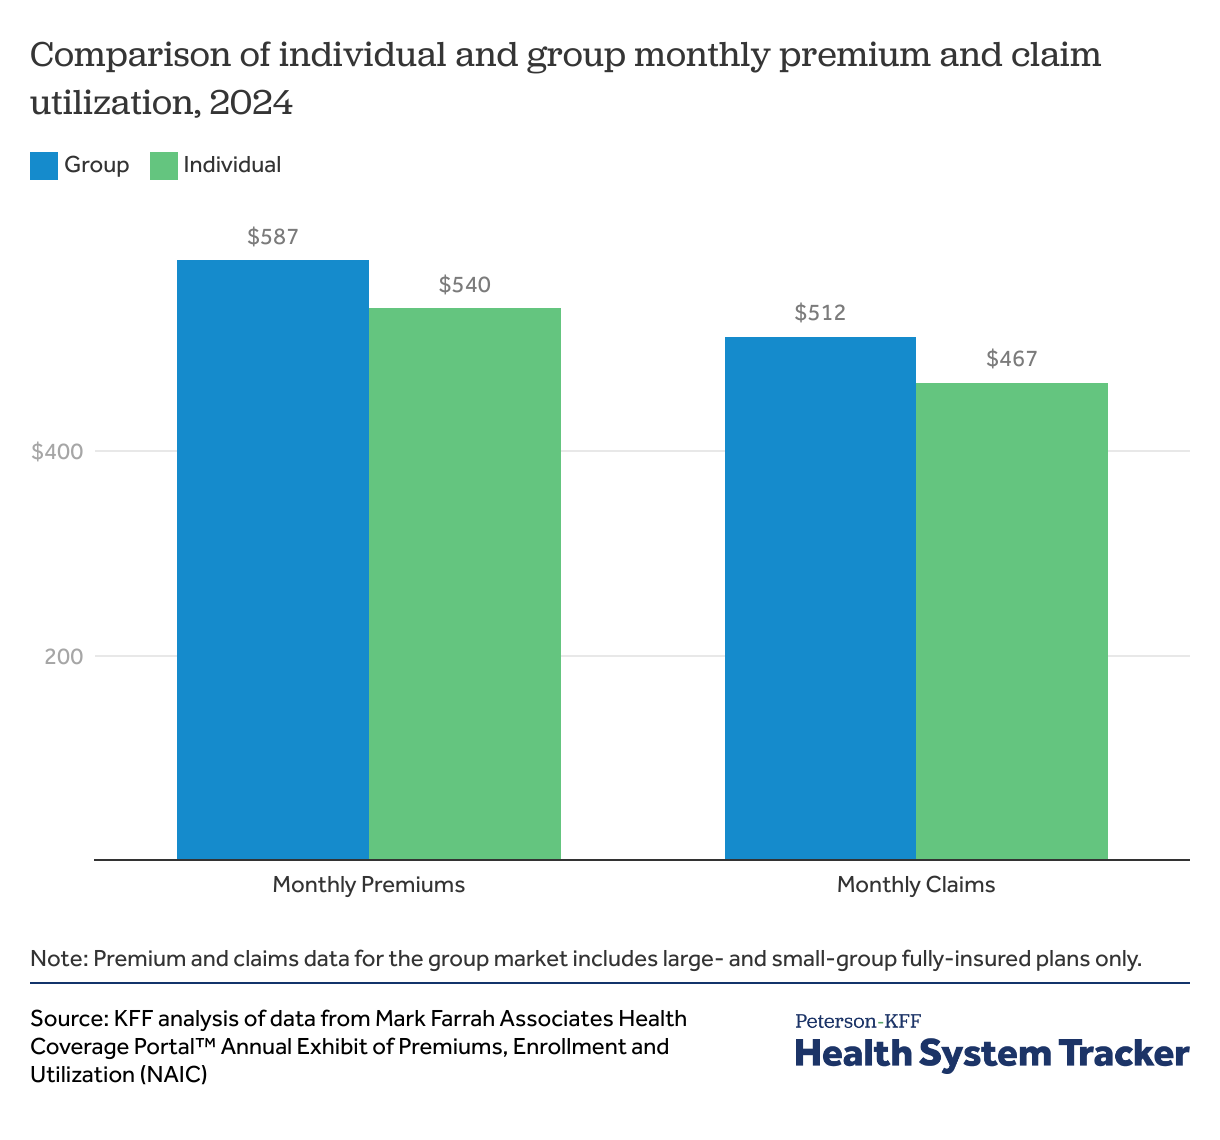
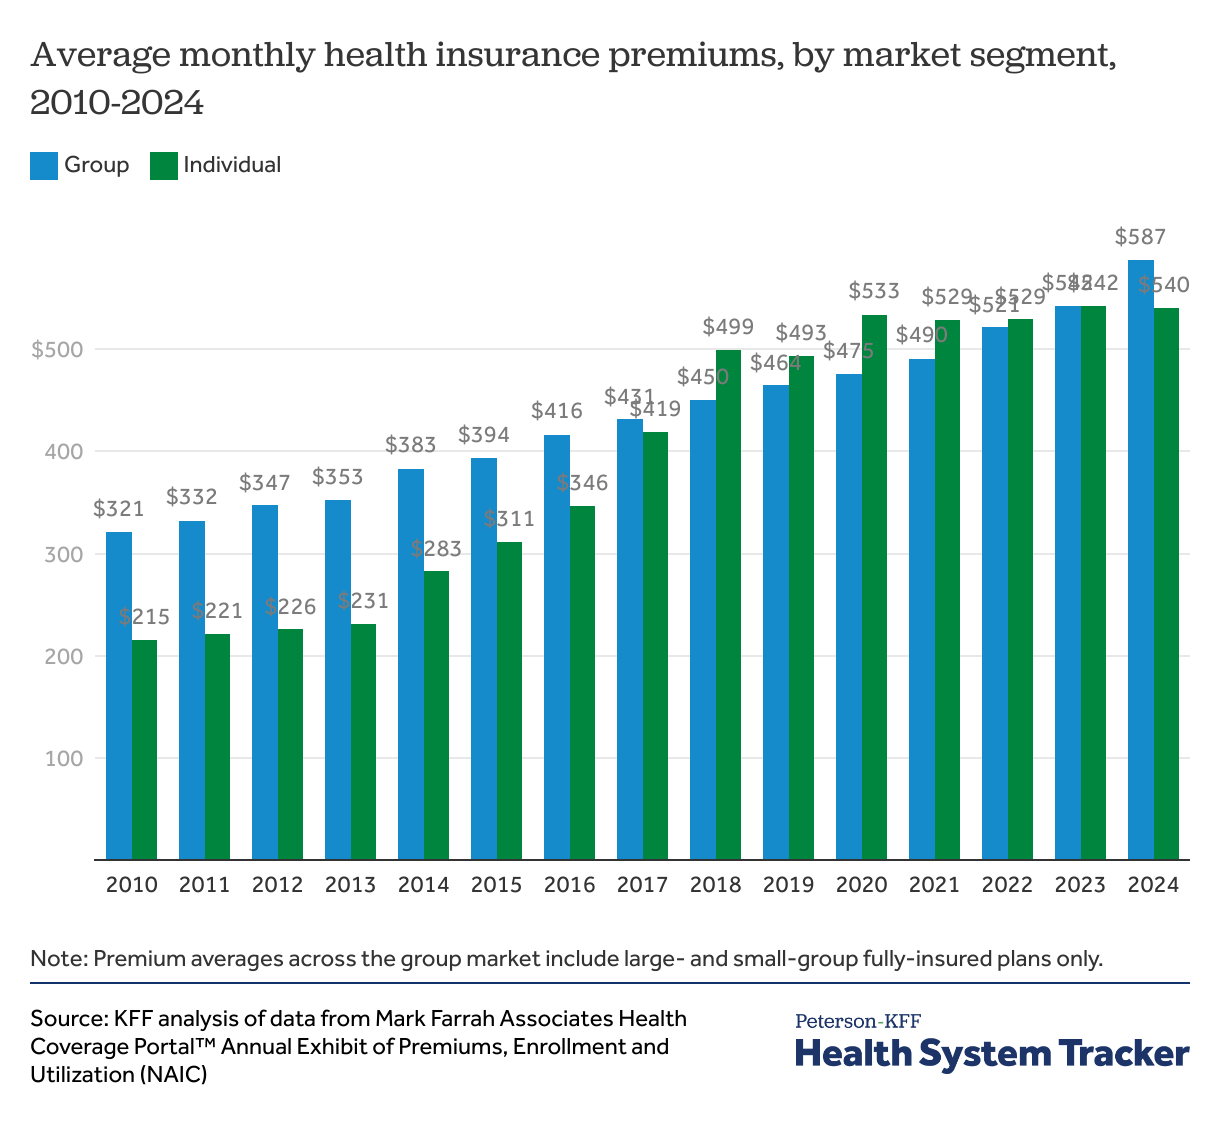
In 2024, individual market insurance premiums averaged $540 per member per month, slightly below the average $587 per member per month premium for fully-insured employer coverage. The average amount insurers paid out for health care claims in the individual market was $467 per member per month, which was also slightly below the $512 fully-insured employer plans paid on behalf of their enrollees. The per member per month premiums shown here are gross premiums charged by insurers, meaning they do not subtract out the ACA’s tax credit or the employer’s contributions.
Related Content:
The average per member per month premiums and claims can be swayed by differences in out-of-pocket payments as well as differences in the age or health status of enrollees.
On average in 2025, ACA individual market plans have a $2,789 annual deductible which is higher than the average deductible for a worker with employer-sponsored coverage ($1,886, across all firm sizes), but closer to the average deductible among small firms ($2,631). The fully-insured group coverage shown in the chart above is primarily sold to smaller and midsized companies, as very large firms tend to self-insure and are not included in the premium and claims data.
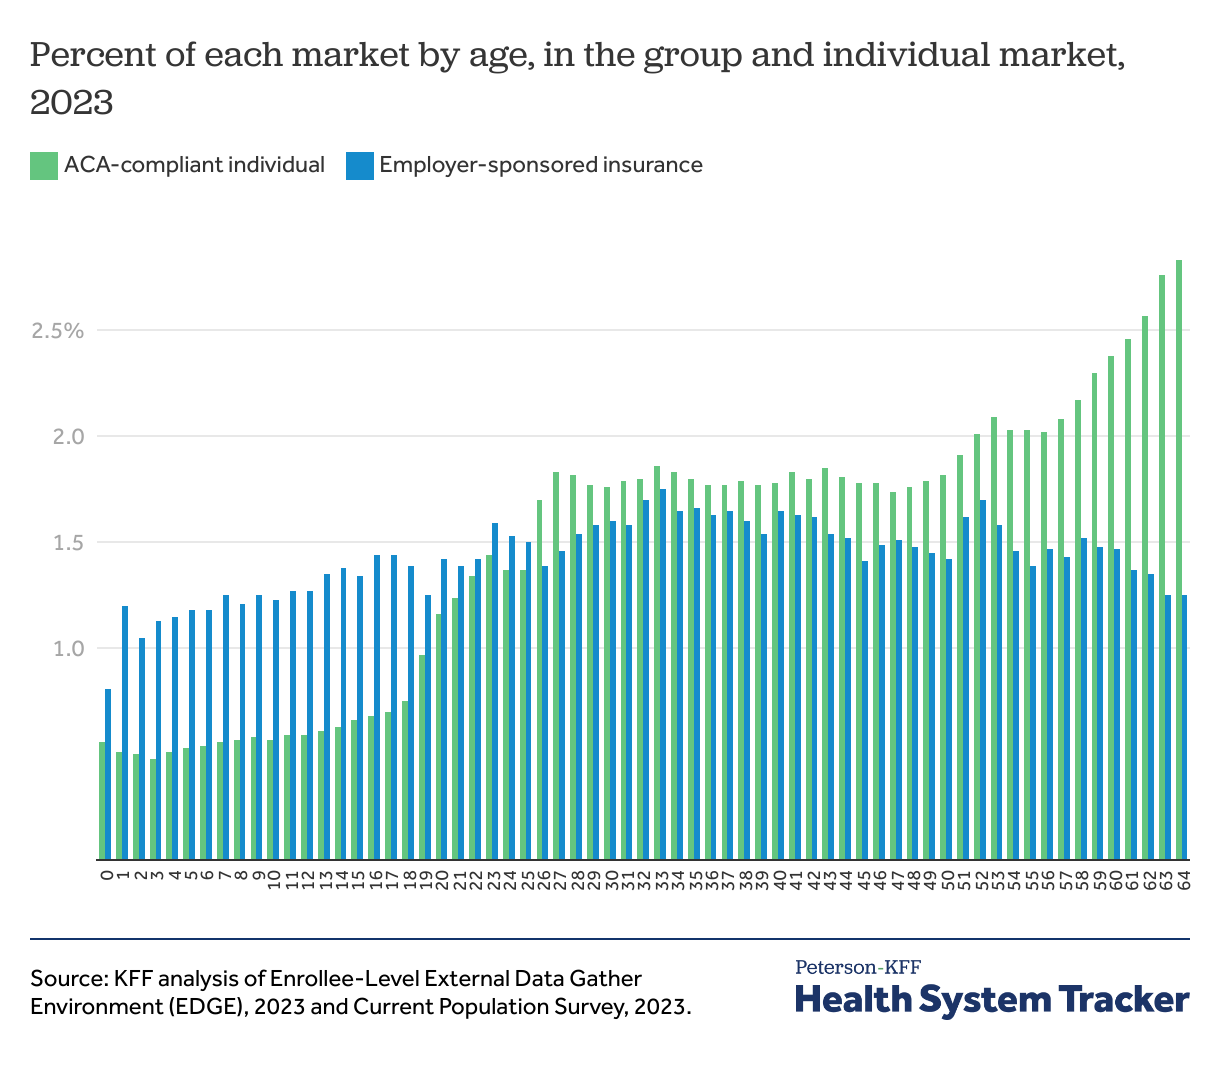
While individual market enrollees tend to have higher deductibles (which would suppress claims and premiums), they are also older (which would increase claims and premiums) on average, compared to people with employer coverage. Older enrollees have higher premiums and claims, and they make up a larger proportion of the individual market compared to the group market. Using 2023 data from the Enrollee-Level External Data Gather Environment (EDGE) for nonelderly enrollees in ACA-compliant individual market, the mean enrollee age is 40, the median age is 41, and the mode or most common age is 64 (as the ACA Marketplace is often a source of coverage for people who are not-quite eligible for Medicare). Using the Current Population Survey, the mean age for nonelderly people with employer-sponsored coverage is 33, the median age is 34, and the mode age is 40. (CPS has a much smaller sample of individual market purchasers than EDGE, but it shows similar patterns for the individual market). See appendix for full age break-down.
Since 2015, after ACA implementation, average claims costs in the individual and employer insurance markets have been similar
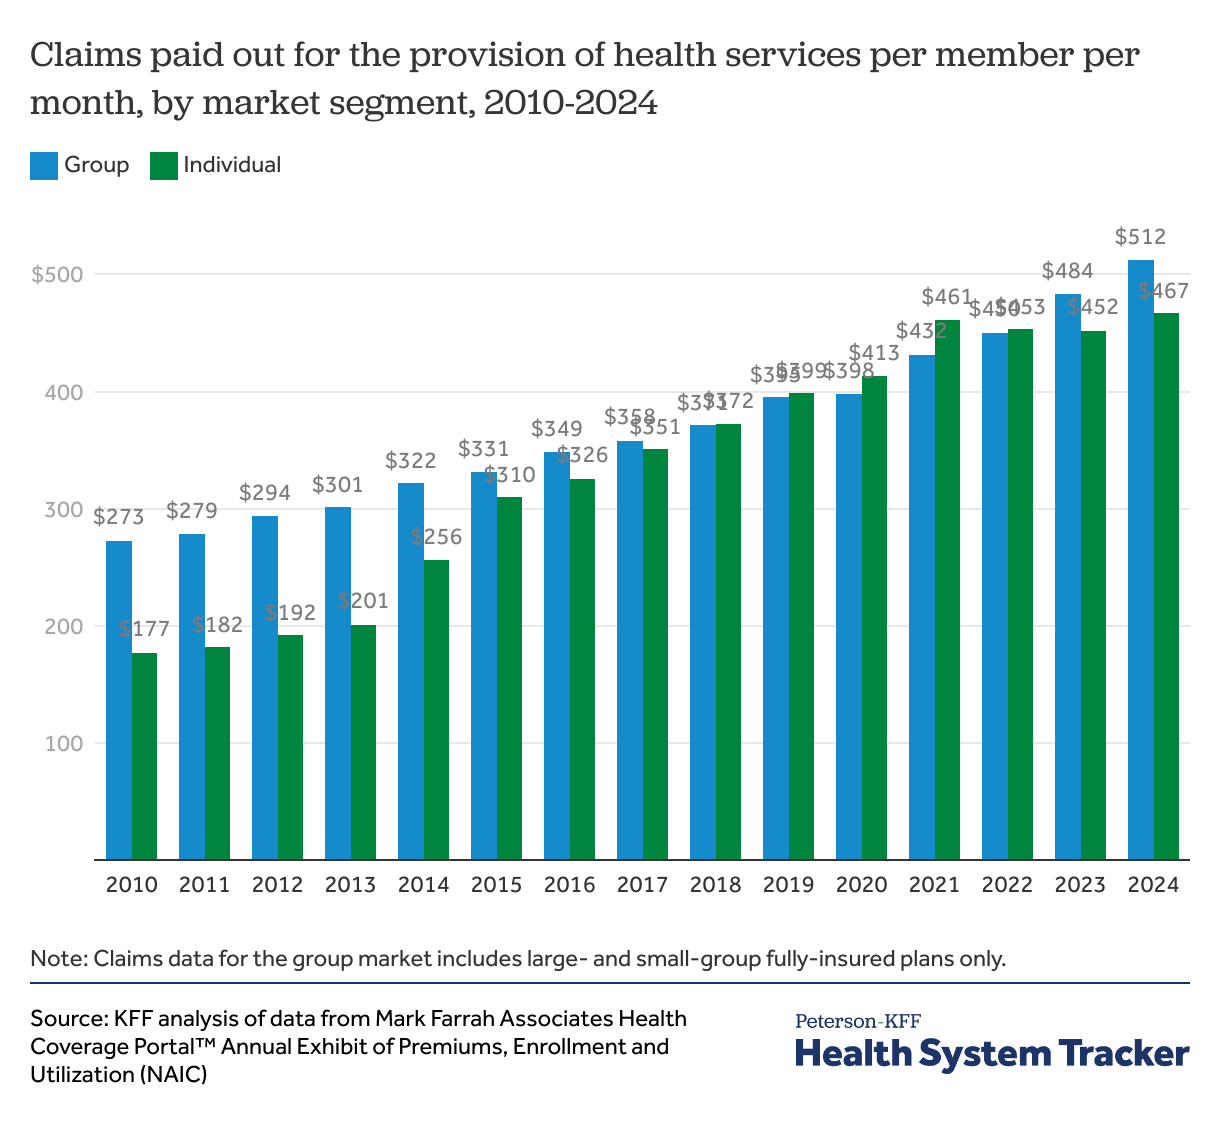
Prior to the ACA being implemented in 2014, most health insurance sold in the individual market was medically underwritten. That means insurers evaluated the health status, health history, and other risk factors of applicants to determine whether and under what terms to issue coverage. Insurers typically excluded coverage for services or conditions for some enrollees, and others with pre-existing conditions were denied coverage altogether. Many plans included limits on how much the plan would pay in a year.
As a result, coverage in the pre-ACA individual market was often much more limited than the coverage offered by employers and individual market enrollees were disproportionately healthy. Before the ACA, individual market insurers spent significantly less on health care claims than insurers selling employer coverage. On average, individual market claims costs were $177 per member per month in 2010, compared to $273 for more comprehensive group coverage.
By 2015, the year after the ACA’s protections for pre-existing conditions rolled out, average claims costs in the individual market ($310 per member per month) started to become much more similar to average claims in the employer market ($331).
Individual market premiums have become more similar to employer-sponsored since 2017
When considering individual market premium trends over time, it is important to understand the level of volatility that existed in the early years of the ACA markets.
As mentioned above, in 2014, many key ACA market reforms were implemented, including guaranteed issue, which required insurers to offer coverage regardless of an individual’s health history. The ACA also mandated standardized health insurance benefits by requiring all plans to cover a comprehensive set of essential health benefits, including preventive services and eliminate annual and lifetime limits. Those who were previously denied could now purchase coverage.
When insurers entered the ACA Marketplaces in 2014, they were operating with virtually no experience participating in an individual market like this. Insurers must submit premiums almost a year in advance for review and approval by state regulators, so even 2015 premiums were submitted in early 2014 when the market was first opening, meaning insurers did not have experience in the market on which to base their premium and claim projections. Eventually, though, it became clear that individual market insurers were underpricing. In 2015, insurers were spending out about as much in claims as they were bringing in as premium revenue, meaning they were not bringing in enough money to cover their operating expenses and were therefore unprofitable.
When insurers had more experience on which to base their premiums for 2016, many began to raise premiums. The ACA also created risk-spreading mechanisms for insurers entering this uncertain market, including temporary reinsurance and risk corridors programs, aimed at stabilizing premiums in the early years of the ACA implementation. By 2017, these temporary programs had phased out, leading to another premium increase that insurers described as a market correction. In 2017, average individual market premiums ($419 per member per month) were much higher than they had been in prior years but were very similar to fully-insured employer plan premiums ($431) and more accurately reflected the health status of enrollees.
When individual market insurers were setting their premiums for 2018 amid policy uncertainty surrounding ACA repeal and replace and the discontinuation of cost-sharing reduction payments, insurers raised premiums yet again to compensate for the fact that they had to continue to offer low-deductible plans to low-income people. In retrospect, insurers overcorrected and overpriced in 2018 and were required by the ACA to issue significant medical loss ratio rebates as a result. Insurers in this market generally held premiums steady for the next couple of years as claims costs caught up.
In 2019 and beyond, though, the individual market began to stabilize and premiums began to look much more similar to employer market premiums. By the years 2022, 2023 and 2024, around 85% of individual market premiums were paid out in claims market-wide, illustrating that premiums more closely reflected the health needs of the risk pool.
Looking ahead to 2026, private insurance premiums are expected to rise for both employer-sponsored and individual market coverage. Insurers in the individual and small group insurance markets cite similar factors driving up 2026 premiums, like hospital costs, high utilization of expensive GLP-1 medications, and the threat of tariffs. However, it is likely premiums will grow faster in the ACA individual market than in the group market. Part of this is due to the expected expiration of the enhanced premium tax credits, which has led insurers to expect an overall sicker population to retain coverage. On average, individual market insurers attributed 4 percentage points of their 2026 premium increase to the expiration of enhanced premium tax credits.
Appendix
The Peterson Center on Healthcare and KFF are partnering to monitor how well the U.S. healthcare system is performing in terms of quality and cost.