Note: An updated chart collection explores more recent data on this topic here.
Recent surveys have found that while most people taking prescriptions are able to afford the costs, a sizable share reports having difficulty affording their medication (26% of those taking prescription drugs, or 14% of the total population). Nearly one in ten adults report delaying or forgoing their prescription due to cost, raising concerns about the implications poor adherence may have on health outcomes and longer-term treatment costs.
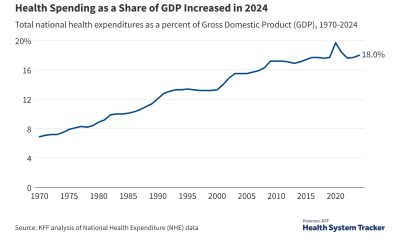
Prescription drug spending has grown rapidly in the past couple of years, following years of slow growth. Several studies by the federal government, pharmacy benefit managers, and insurers point to high prices for new “specialty” drugs as driving this recent spike, in addition to price increases for some existing brand name drugs. Prescription drugs are one of the leading contributors to health spending growth, and insurers frequently cite these higher drug costs as a reason for raising premiums.
Deductibles represent a growing share of out-of-pocket drug costs Share on XThis analysis examines trends in drug spending for people who have insurance coverage through their or a family member’s large employer, with a particular focus on those with high total drug spending or high out-of-pocket drug spending (a collection of additional related charts can be found here). The analysis is based on a sample of health benefit claims from the Truven MarketScan Commercial Claims and Encounters Database to calculate the amounts paid by insurance and out-of-pocket on prescription drugs from 2004 – 2014. We use a sample of between 785,000 and 15.3 million enrollees per year to analyze the change from 2004 to 2014 in average prescription drug spending for covered prescriptions overall, the average amount paid by health benefit plans, and the average amounts attributable to deductibles, copayments, and coinsurance.
Trends in Total Prescription Drug Spending
We find drug spending trends in employer coverage that generally reflect national patterns, with a similar spike in 2014 spending. Average retail drug spending in employer plans held relatively steady from 2004 to 2013, ranging from $909 in 2004 to $947 in 2013 (adjusted for inflation), before growing 13.0% in 2014 to $1,053 per enrollee. Though drug spending trends in large employer plans generally mirror national trends, retail prescription drug spending does, however, represent a larger share of total employer insurance benefits (21%) than retail drugs represent as a share of total national health spending (10%), so growth in prescription drug spending may have a relatively large effect on employer-sponsored health insurance premiums.
Related Content:
Growth in prescription drug spending had slowed, but increased rapidly in 2014 nationally and for employer-sponsored plans
Over time, the share of people with high retail drug spending (exceeding $5,000, including amounts paid by insurance and out-of-pocket) has increased from 1.6% in 2004 to 3.9% in 2014, as has the share of people with exceptionally high drug spending (exceeding $20,000) from 0.1% to 0.8% over the same period. Workers and their family members who are older, and women tend to have higher drug spending. People diagnosed with certain conditions, particularly diseases of the blood (like hemophilia), cancer, digestive diseases, circulatory conditions, and endocrine disorders are also more likely to have high drug spending.
Workers and their family members with certain diagnoses have much higher average drug spending
Trends in Out-of-Pocket Prescription Drug Spending
While there is significant public concern about prescription drug spending, we find that when average out-of-pocket spending for retail prescription drugs has decreased for people with large employer coverage. On average, people with large employer coverage spent $144 per person in 2014, down from a recent high of $167 in 2009 (or about $185 in 2014 dollars). Note that these data include out-of-pocket spending for covered retail drugs (cost-sharing), but some enrollees may purchase drugs that are not covered and pay all of the cost without submitting a claim.
On average, insurance covers a larger share of retail prescription drug spending than a decade ago
This trend toward lower average out-of-pocket drug spending among people with employer coverage is likely influenced by the loss of patent protection for some popular drugs and the corresponding generic substitution. Some of this decrease in out-of-pocket spending on prescription drugs is also likely due to the Affordable Care Act’s preventive services provision that makes birth control available without cost-sharing (except in “grandfathered” plans that were in place before the ACA was enacted): women saw a sharper drop-off than men in the share with any out-of-pocket drug spending, and the share of women of reproductive age with out-of-pocket spending on oral contraceptive pills plummeted from 20.9% in 2012 to 3.6% in 2014, corresponding to the timing of the ACA provision.
The share of women of reproductive age who had out-of-pocket spending on oral contraceptive pills fell sharply after the ACA
On average, annual out-of-pocket spending on prescriptions by people with large employer coverage dropped by about $24 from 2009 – 2014. Most of this drop ($16) occurred between 2009 – 2012, and is likely attributable to several popular drugs losing patent protection during that time period. From 2012 – 2014, average out-of-pocket spending on drugs continued to fall (by another $8 per person), with 63% of the drop during this period resulting from a sharp decrease in out-of-pocket spending on oral contraceptive pills corresponding to the ACA’s contraception provision.
Oral contraceptive pills account for 63% of the drop in average out-of-pocket spending on retail drugs since 2012
Women's spending on birth control dropped sharply after ACA Share on X
Although average out-of-pocket retail drug spending has dropped slightly for people with employer coverage, there are at the same time more people with exceptionally high out-of-pocket drug spending. The share of people covered by a large employer who had out-of-pocket spending on retail prescription drugs exceeding $1,000 nearly tripled from 1.0% in 2004 to 2.8% in 2014. Similarly, the share of people with out-of-pocket retail drug spending in excess of $2,000 increased from 0.1% in 2004 to 0.6% in 2014.
Workers and their family members with certain diagnoses are more likely to be exposed to high out-of-pocket drug spending. While 2.8% of enrollees have out-of-pocket drug spending in excess of $1,000, those with diagnoses of cancer (5.6%), digestive diseases (6.0%), mental illness (6.2%), endocrine disorders (6.8%), circulatory diseases (6.9%) and diseases of the blood (7.8%) are more likely to incur these high prescription out-of-pocket expenses.
Though representing fewer than 3% of all people with large employer coverage, those with out-of-pocket drug spending in excess of $1,000 account for a third (33%) of aggregate out-of-pocket spending on drugs. People in this group tend to be older (average age of 46 compared to an average of 33 years old for those with out-of-pocket drug spending below $1,000).
People with high out-of-pocket drug spending represent a small share of enrollees, but a larger share of drug spending
People with large-employer coverage who have retail drug out-of-pocket spending in excess of $1,000 are more likely to be diagnosed with certain conditions, particularly endocrine disorders (70% of people with high out-of-pocket spending on drugs have an endocrine disorder like diabetes or obesity, compared to 27% of people with prescription out-of-pocket spending at or below $1,000); musculoskeletal disorders (57% vs. 29%); and circulatory conditions (56% vs. 21%). People with out-of-pocket drug spending in excess of $1,000 are also much more likely to be taking certain medications, particularly central nervous system agents like pain medication (75% vs. 33%); hormones and synthetic substitutes like insulin (70% vs. 26%); and cardiovascular drugs (63% vs. 18%).
Aside from the total amount of out-of-pocket exposure people face over the course of the year, another factor that could affect affordability is the type of out-of-pocket payment required. Over the past decade, out-of-pocket spending for prescription drugs has shifted from being almost entirely paid through copayments, toward significantly more deductible and coinsurance spending. In 2014, 24% of out-of-pocket prescription drug expenses were paid through deductibles, compared to just 4% in 2004. Similarly, 20% of out-of-pocket drug expenses were paid through coinsurance spending in 2014, compared to just 3% in 2004. These higher deductible and coinsurance payments relative to copays reflect a general trend of higher deductibles in employer plans, as well as greater use of tiered formularies. Enrollees may be more sensitive to the actual price of health care with deductibles and coinsurance than they are with copays, which are flat dollar amounts. Additionally, copays require smaller periodic payments that may add up over time, while a deductible may need to be met at once, potentially causing affordability challenges.
Deductibles and coinsurance represent a larger share of out-of-pocket drug spending than a decade ago
Methods
We analyzed a sample of claims obtained from the Truven Health Analytics MarketScan Commercial Claims and Encounters Database. The database has claims information provided by large employers and health plans. We used a subset of claims from the years 2004 through 2014. The analysis for each is limited to claims for enrollees with more than six months of enrollment in that year. We excluded claims paid on a capitated basis. With these limitations, the number of enrollees in the sample varied from about 785,000 in 2004 to over 15.3 million in 2014.
Cynthia Cox, Gary Claxton, and Larry Levitt are with the Kaiser Family Foundation. Anthony Damico is an independent consultant to the Kaiser Family Foundation.
The Peterson Center on Healthcare and KFF are partnering to monitor how well the U.S. healthcare system is performing in terms of quality and cost.