The Build Back Better Act, which has passed the House but stalled in the Senate, would cap insulin out-of-pocket costs for people with insurance. Several other recent legislative proposals would also limit out-of-pocket spending on insulin, including the Ending Pricey Insulin Act, introduced in April 2021 by Senator John Kennedy and the Affordable Insulin Now Act, introduced in February 2022 by Senator Reverend Raphael Warnock. Recently, on March 22, 2022, Senate Majority Leader Chuck Schumer indicated that bipartisan talks are underway led by Senator Susan Collins and Senator Jeanne Shaheen to combine Senator Warnock’s bill to cap insulin out-of-pocket costs with policies to lower insulin list prices. A 2019 bill introduced by Senator Jeanne Shaheen and co-sponsored by Senator Susan Collins, the Insulin Price Reduction Act, proposed to limit insulin price growth.
Under both the Affordable Insulin Now Act and Build Back Better, insurers, including private plans and Medicare Part D plans, would be required to charge no more than $35 per month for insulin products. Private group or individual plans would have to cover at least one of each dosage form (i.e., vial, pen) of each type of insulin (i.e., rapid-acting, short-acting, intermediate-acting, ultra long-acting, and premixed) when available and limit the cost sharing to no more than $35 per 30-day supply of each type.
In this analysis, we look at claims data from private health plans to assess how many insulin users might save money with a $35 monthly cap on out-of-pocket costs in the individual, small group and large group markets. Our analysis is based on the 2018 Enrollee-Level External Data Gathering Environment (EDGE) limited dataset, which includes all individual and small group Affordable Care Act (ACA) compliant plans, including those sold on and off the Marketplace. We also look at claims data for people with large employer coverage using IBM MarketScan data. We examine how many enrollees paid more than $420 annually out-of-pocket for an insulin product (which is an average of $35 a month). This analysis represents about 110 million of the 160 million Americans with private insurance. The data we analyzed do not represent all people with private insurance. Of the privately insured people represented in these data, about 1 million (184,000 enrollees in the individual market, 105,000 in the small employer market, and a weighted count of 802,000 in the large employer plans with over 1,000 workers) had an insulin prescription fill in 2018.
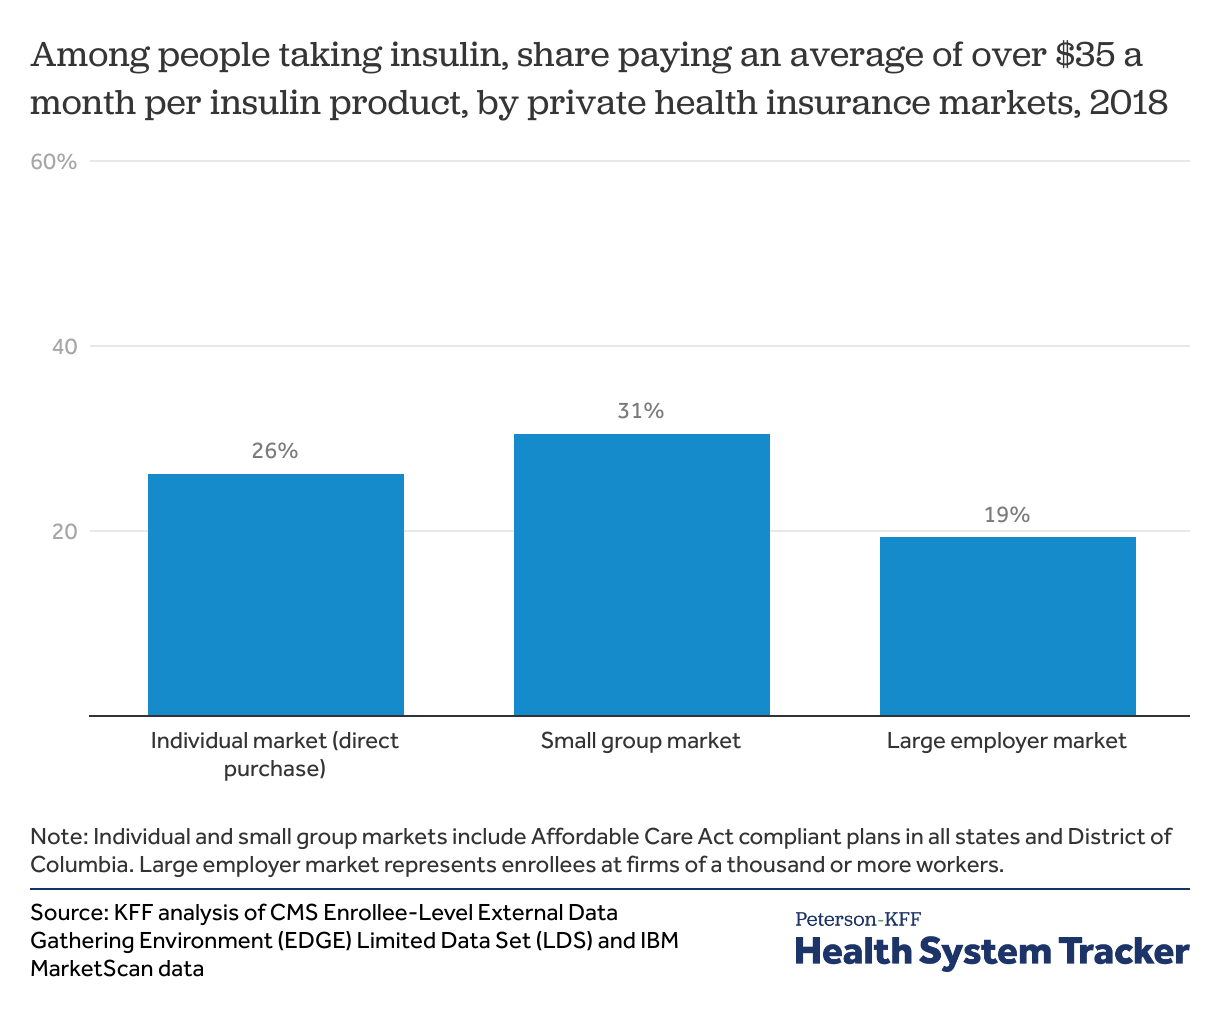
We find that among enrollees in the individual and small group markets taking insulin, over 1 in 4 (26% and 31%, respectively) paid more than an average of $35 per month out-of-pocket for insulin in 2018. Low-income ACA Marketplace enrollees receiving significant cost-sharing assistance were less likely to have out-of-pocket insulin costs averaging over $35 per month. We also find that 1 in 5 insulin users (19%) with large employer coverage – which tends to have lower deductibles and copays — spend more than an average of $35 per month.
Over 1 in 4 individual and small group enrollees with an insulin prescription paid more than $35 a month out-of-pocket for insulin
With a $35 per month cap on out-of-pocket insulin costs per product, savings could be substantial in some cases for people who use insulin. Over 1 in 20 insulin users whose costs currently exceed the cap in the private insurance markets pay more than $150 per month per insulin product.
Related Content:
-
In the individual market, median monthly savings would be $27 among those whose costs currently exceed the cap. One-quarter of people would save at least $71.
-
In the small group market, median savings would be $19 and one-quarter would save at least $48.
-
In the large group market, median savings would be $19 and one-quarter would save at least $42.
Under the Affordable Care Act (ACA), individual and small group market plans are offered in four “metal” level categories based on plan actuarial value (the average share of costs the plan will cover for covered benefits). Bronze plans tend to have the lowest share of covered costs (60% actuarial value on average) and highest deductibles and other cost sharing, followed by silver (70%), gold (80%), and platinum (90%). Platinum plans have very low out-of-pocket costs.
Low-income enrollees with incomes below 250% of poverty who enroll in silver Marketplaces plans also get help with cost sharing. Cost-sharing reductions (CSRs) help reduce out-of-pocket costs for enrollees on a sliding scale. People with incomes up to 150% of poverty (for a single individual just over $18,000 in 2018 and just over $19,000 in 2022) enrolled in a silver Marketplace plan get cost sharing reduced and the insurance plan will cover 94% of the costs of covered benefits on average. People with incomes between 150% and 200% of poverty get cost sharing reduced to 87%. Those with incomes between 200% and 250% get some cost-sharing reduction help to 73% (from 70% of typical silver plan benefits).
Among those getting significant help with cost sharing in the individual market, fewer insulin users paid over $35 a month for insulin
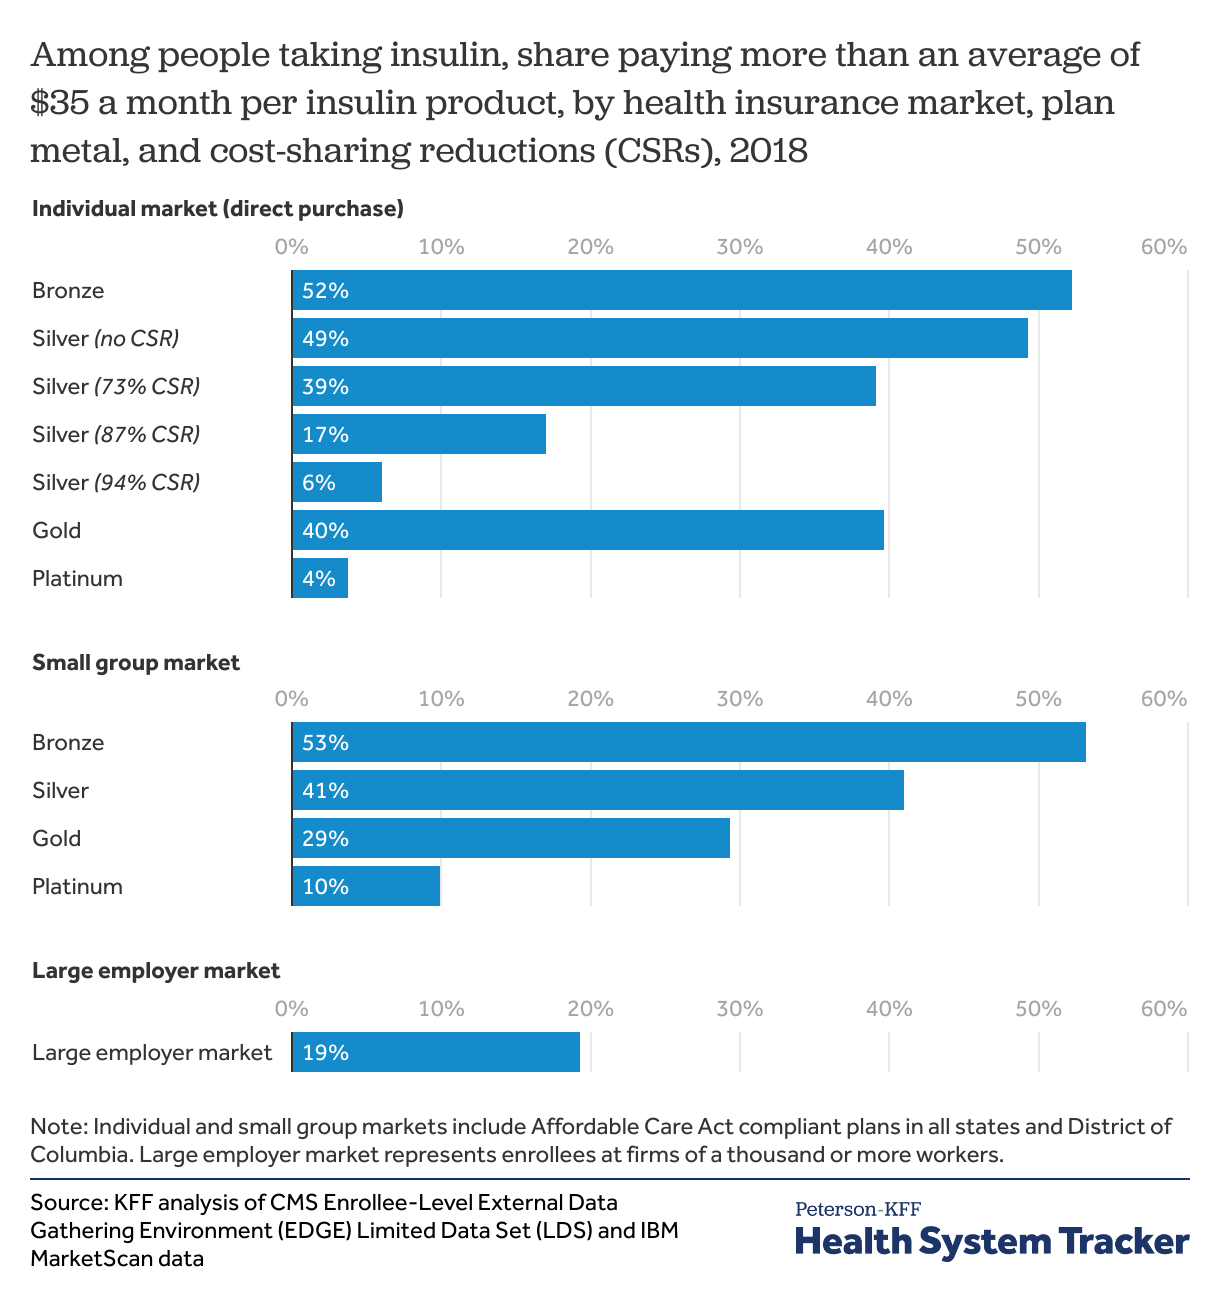
Fewer people using insulin covered by plans with significant cost-sharing reductions paid more than $35 per month out-of-pocket per insulin product. In the plans with the highest cost sharing help (94% CSR, available to ACA Marketplace silver plan enrollees with incomes below 150% of poverty), just 6% had out-of-pocket cost sharing for insulin exceeding an average of $35 per month (compared to 26% in individual market overall). The share of insulin users paying over $35 per month generally followed plan actuarial value, with a greater share of insulin users paying over $35 a month in bronze, and the fewest in platinum.
In the individual market, over two in three insulin users (70%) were enrolled in a silver plan, including about half (55%) enrolled in a silver CSR plan. The remaining insulin users in the individual market were in gold (13%), bronze (11%), and platinum plans (just 3%).
In the small group market, 44% of insulin users were in gold plans, followed by 31% in silver, 19% in platinum, and just 5% in bronze plans. (Percentages do not sum to 100% due to rounding.)
People in small group plans are particularly vulnerable to high out-of-pocket costs for insulin because coverage tends to be less comprehensive than in large employer plans and there is no reduced cost sharing for low-income people as there is in the individual market.
Discussion
Cost sharing is often used in health insurance plans to engage patients in making cost-effective medical and prescription drug choices. However, cost sharing can pose a barrier to getting necessary care. In 2020, nearly 1 in 6 adults reported delaying or not getting prescription drugs due to costs or skipping or taking less medication to save money. Increased barriers to accessing necessary medication can sometimes lead to lower medication use and increase in cost of related hospitalizations and emergency room visits.
People with diabetes taking insulin generally need it for survival and may need multiple types of insulin (rapid-acting, short-acting, intermediate-acting, ultra long-acting, and premixed). Here, we find over 1 in 4 people using insulin in the ACA-compliant individual and small group market plans would benefit from a cap to insulin out-of-pocket costs at $35 per month. Similarly, about 1 in 5 people with large employer coverage who take insulin would save under such a proposal.
Reducing patient out-of-pocket cost sharing for insulin would mean payers and insurers cover a greater share of the insulin costs. However, some of the costs may be offset with increased insulin medication adherence and reduced hospitalization rates. A cap on insulin out-of-pocket costs does not address the underlying insulin prices. Per unit prices of insulin in the U.S. are 7 times those in peer countries.
Methods
The Centers for Medicare and Medicaid Services (CMS) 2018 benefit year enrollee-level EDGE limited dataset (LDS) was used for this analysis. The 2018 EDGE data include masked enrollment and claims information for nearly 30 million enrollees in ACA-compliant individual and small group plans in all states and the District of Columbia. Enrollees with more than 300 days of enrollment in each market in EDGE were included. Enrollees in catastrophic plans and American Indians and Alaskan Native enrollees were excluded due to small counts. For enrollees with enrollment in multiple metal or cost-sharing reduction plans during the year, the plan with the highest share of enrollment during the year was assigned to each enrollee. In the EDGE data, out-of-pocket spending was estimated based on the difference between the plan allowed and plan paid amounts. Prescription fill records were excluded in the EDGE data if plan paid amount exceeded the plan allowed amount by $25 or more. For additional technical details on the enrollee-level EDGE limited dataset, see CMS data documentation.
For large group employer plans, we analyzed prescription drug claims from the 2018 IBM Health Analytics MarketScan Commercial Claims and Encounters Database, which contains claims information provided by a sample of large employer plans. Enrollees in MarketScan claims data were included if they were enrolled for 12 months. This analysis used claims for almost 18 million people representing about 22% of the 82 million people in large group market plans (employers with a thousand or more workers) in 2018. To make MarketScan data representative of large group plans, weights were applied to match counts in the Current Population Survey for enrollees at firms of a thousand or more workers by sex, age, state, and whether the enrollee was a policy holder or dependent. Weights were trimmed at eight times the interquartile range.
People taking insulin were identified if an insulin NDC product identifier was present on at least one prescription fill record. Out-of-pocket spending was summed for each enrollee at the NDC level. If enrollees taking insulin received a prescription drug coupon or discount, those are not reflected in these data. We did not combine out-of-pocket cost sharing for all NDCs under the same insulin product type (pre-mixed, rapid acting, long acting, short acting, or intermediate acting), which yields a conservative estimate of the share of people who could be helped with a $35 out-of-pocket cost-sharing limit per 30-day supply. If the enrollee paid over $420 for the year for each insulin NDC, the enrollee was flagged as paying an average of over $35 a month per insulin product.
The Peterson Center on Healthcare and KFF are partnering to monitor how well the U.S. healthcare system is performing in terms of quality and cost.